2020 Drought Update: A Look at Drought Across the United States in 15 Maps
U.S. Drought Monitor - August 25, 2020
As of August 25, 2020, every state from the Great Plains to the West Coast has some drought. In this area, OR, CA, NV, UT, WY, CO, AZ, NM, OK, and TX all have parts in Extreme (D3) or Exceptional Drought (D4). Outside of the West, much of the Northeast is in drought. Drought has also developed recently in western PA. Western IA into SD and NE has been one of the driest areas in the U.S. compared to their averages, with a sizable area in D3. Other pockets of drought exist in the Midwest, Plains, and HI.

2020 U.S. Drought Monitor Week-by-Week Animation
Outside of the Four Corners and the Pacific Northwest/Northern California, most of the drought in the U.S. has been of the short-term nature, meaning less than 6 months. Further, some areas that were hit with drought earlier in the year, such as FL, South TX, and the Gulf Coast, are now all but drought free. Some of the hardest hit areas right now, such as parts of the Southwest, Rockies, Western IA, and the Northeast, had drought develop relatively recently.
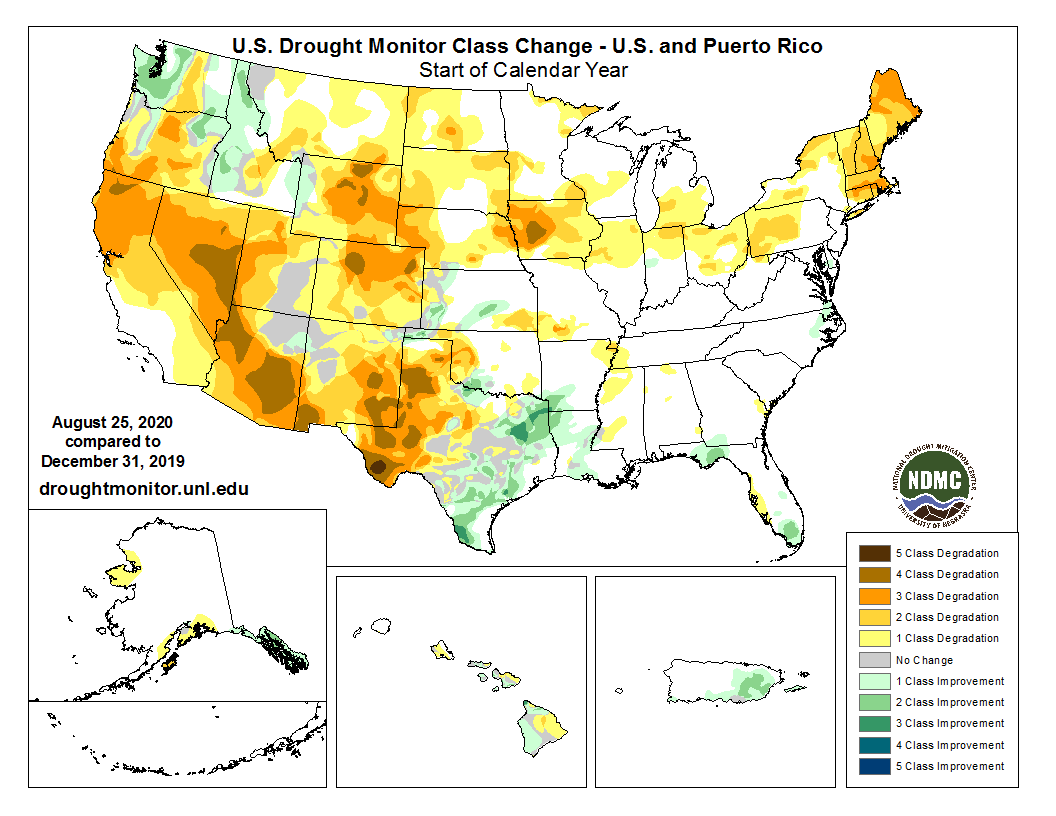
2020 U.S. Drought Monitor Year-to-Date Change Map
2020 has seen mostly drought degradation. A few areas have seen improvement, such as parts of the Northwest and Southern Plains. But these regions have also seen parts with degradations too.
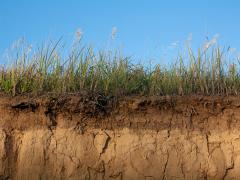
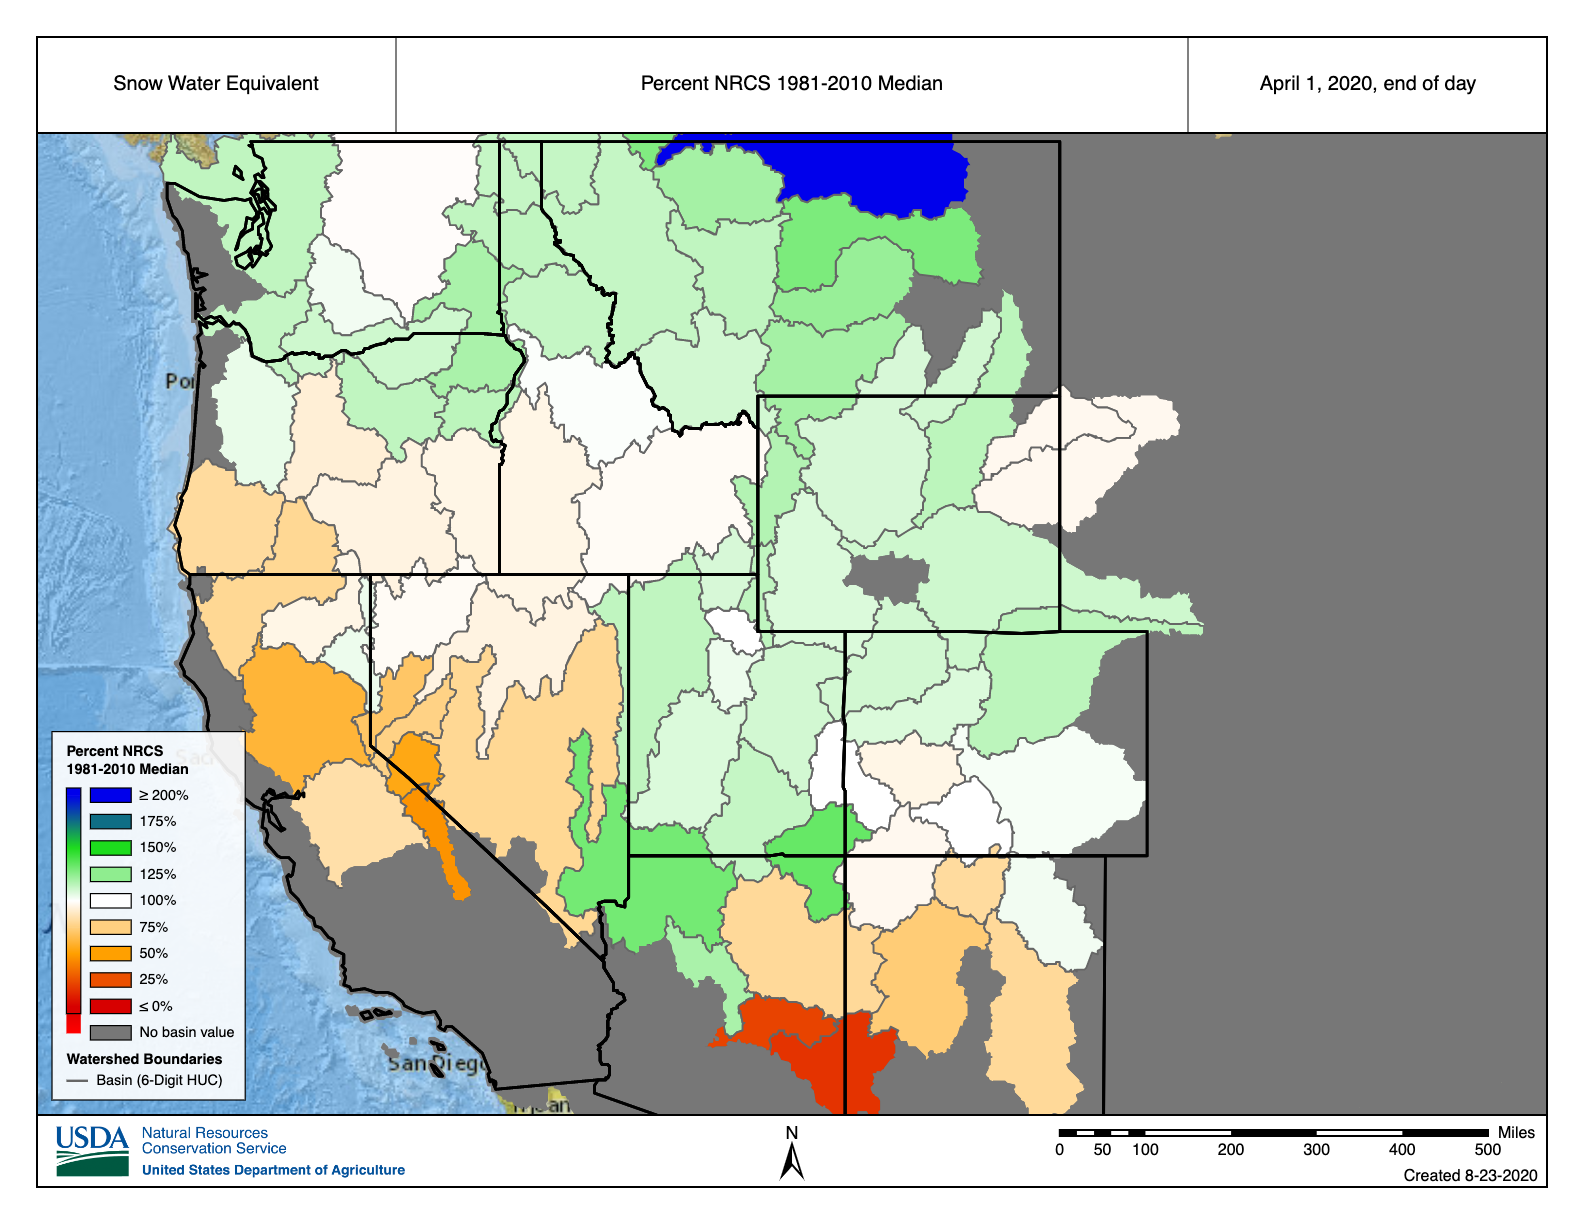
Looking Back: Snow Drought
The seeds of Drought 2020 were laid over the winter of 2019-2020. The western snow season is typically considered to end around April 1. The 2019-2020 snow season ended with a few regions in snow drought, including part of the Lower Colorado River Basin in Arizona and New Mexico, the Sierra Nevada, the Great Basin, and parts of the Cascade Range. Interestingly, in terms of total snow covered area for the western U.S. as a whole, this year wound up being not too far from average. But warm spring temperatures led to an abnormally quick snowmelt in many areas.
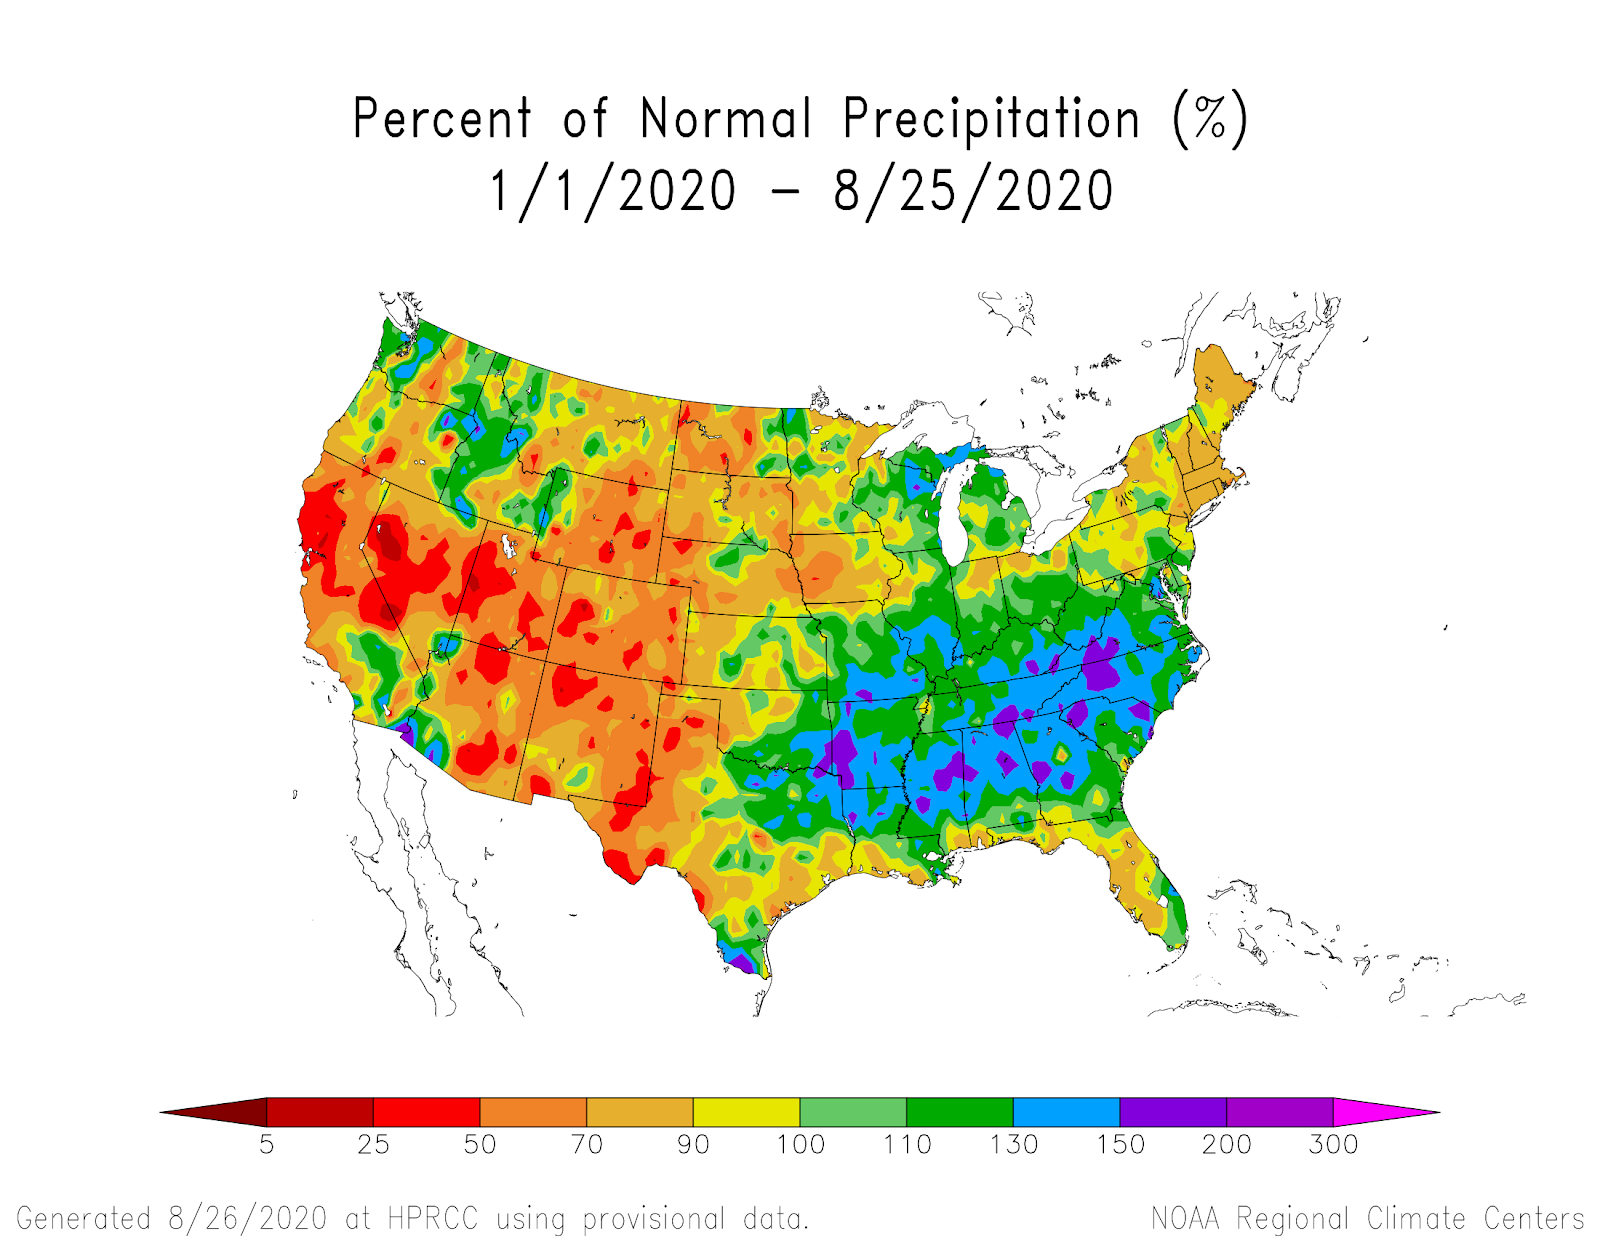
Year-to-Date Percent of Normal Precipitation
In general, it’s been a dry year from the Great Plains to the West Coast. FL and the Gulf Coast went through a dry period in the spring, but have improved greatly since. In contrast, the Northeast has really dried out in the last few months.
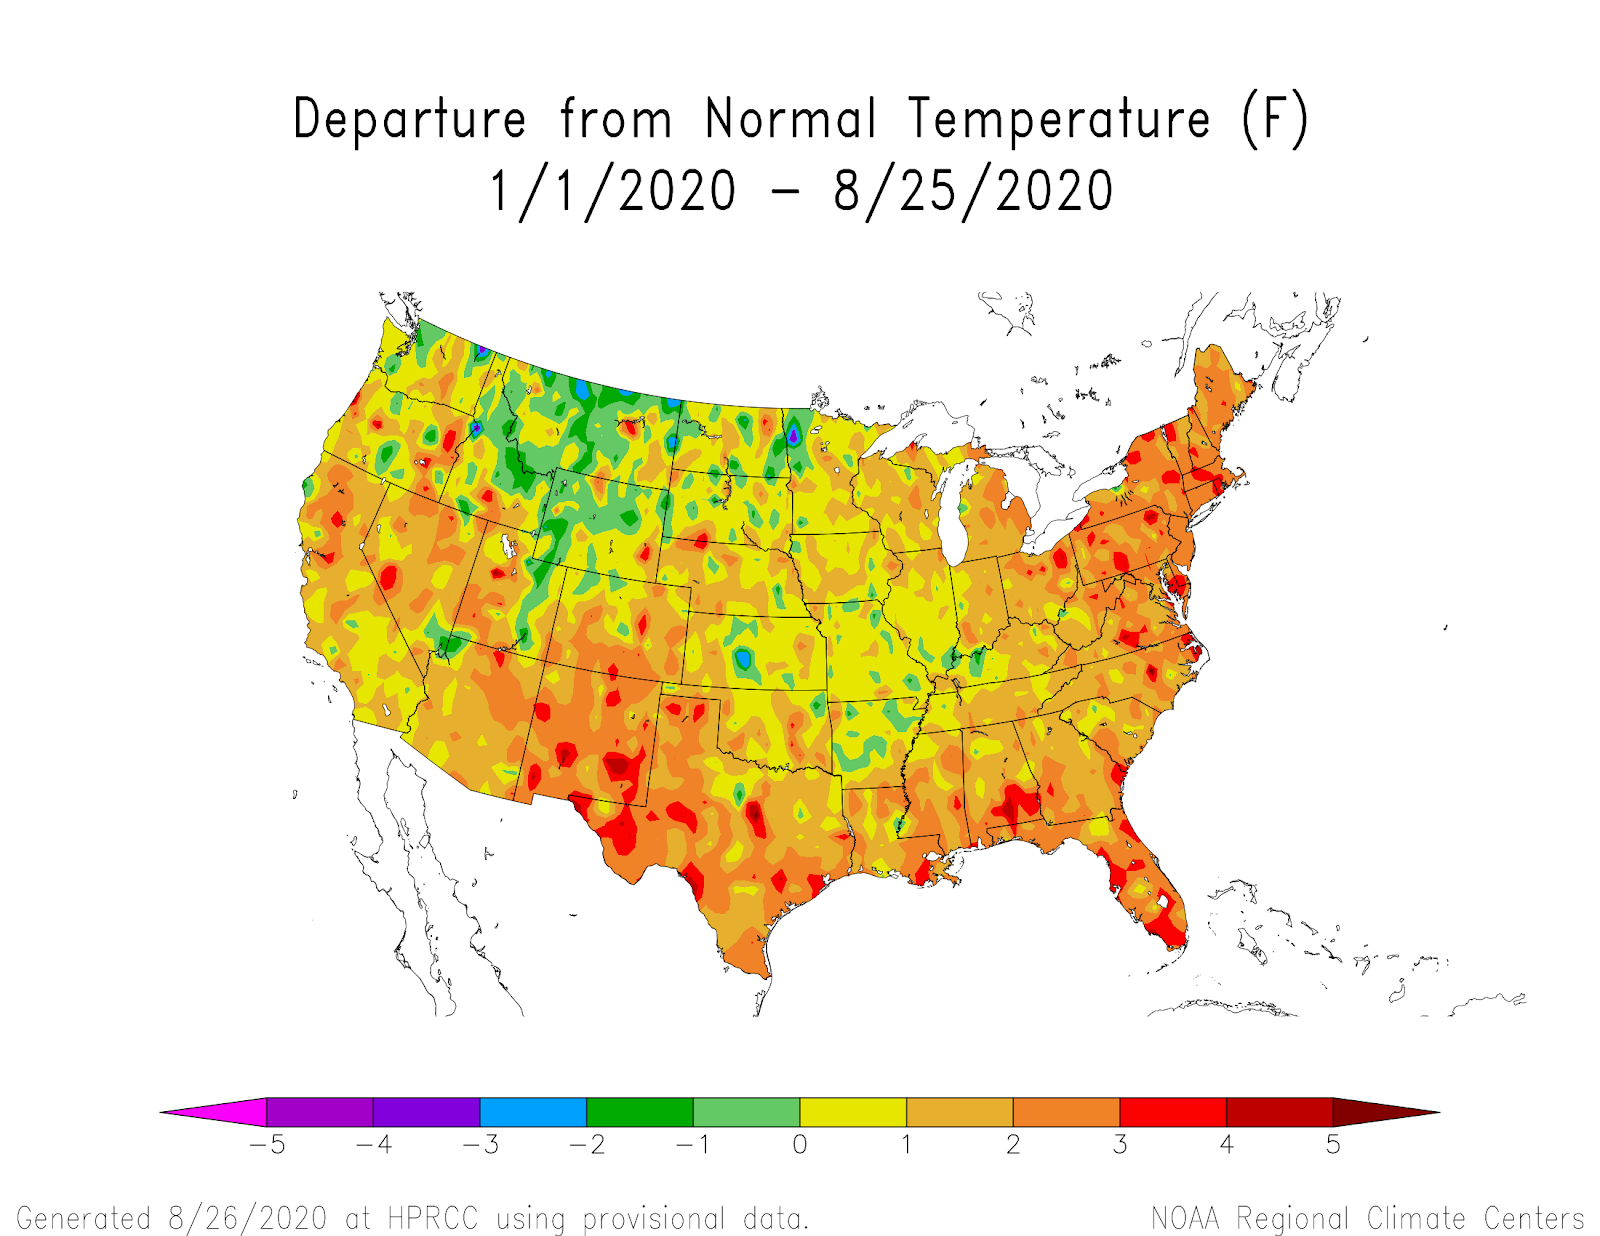
Year-to-Date Departure from Normal Temperature
As shown on the year-to-date departure from normal temperature map, it’s been relatively hot this year.
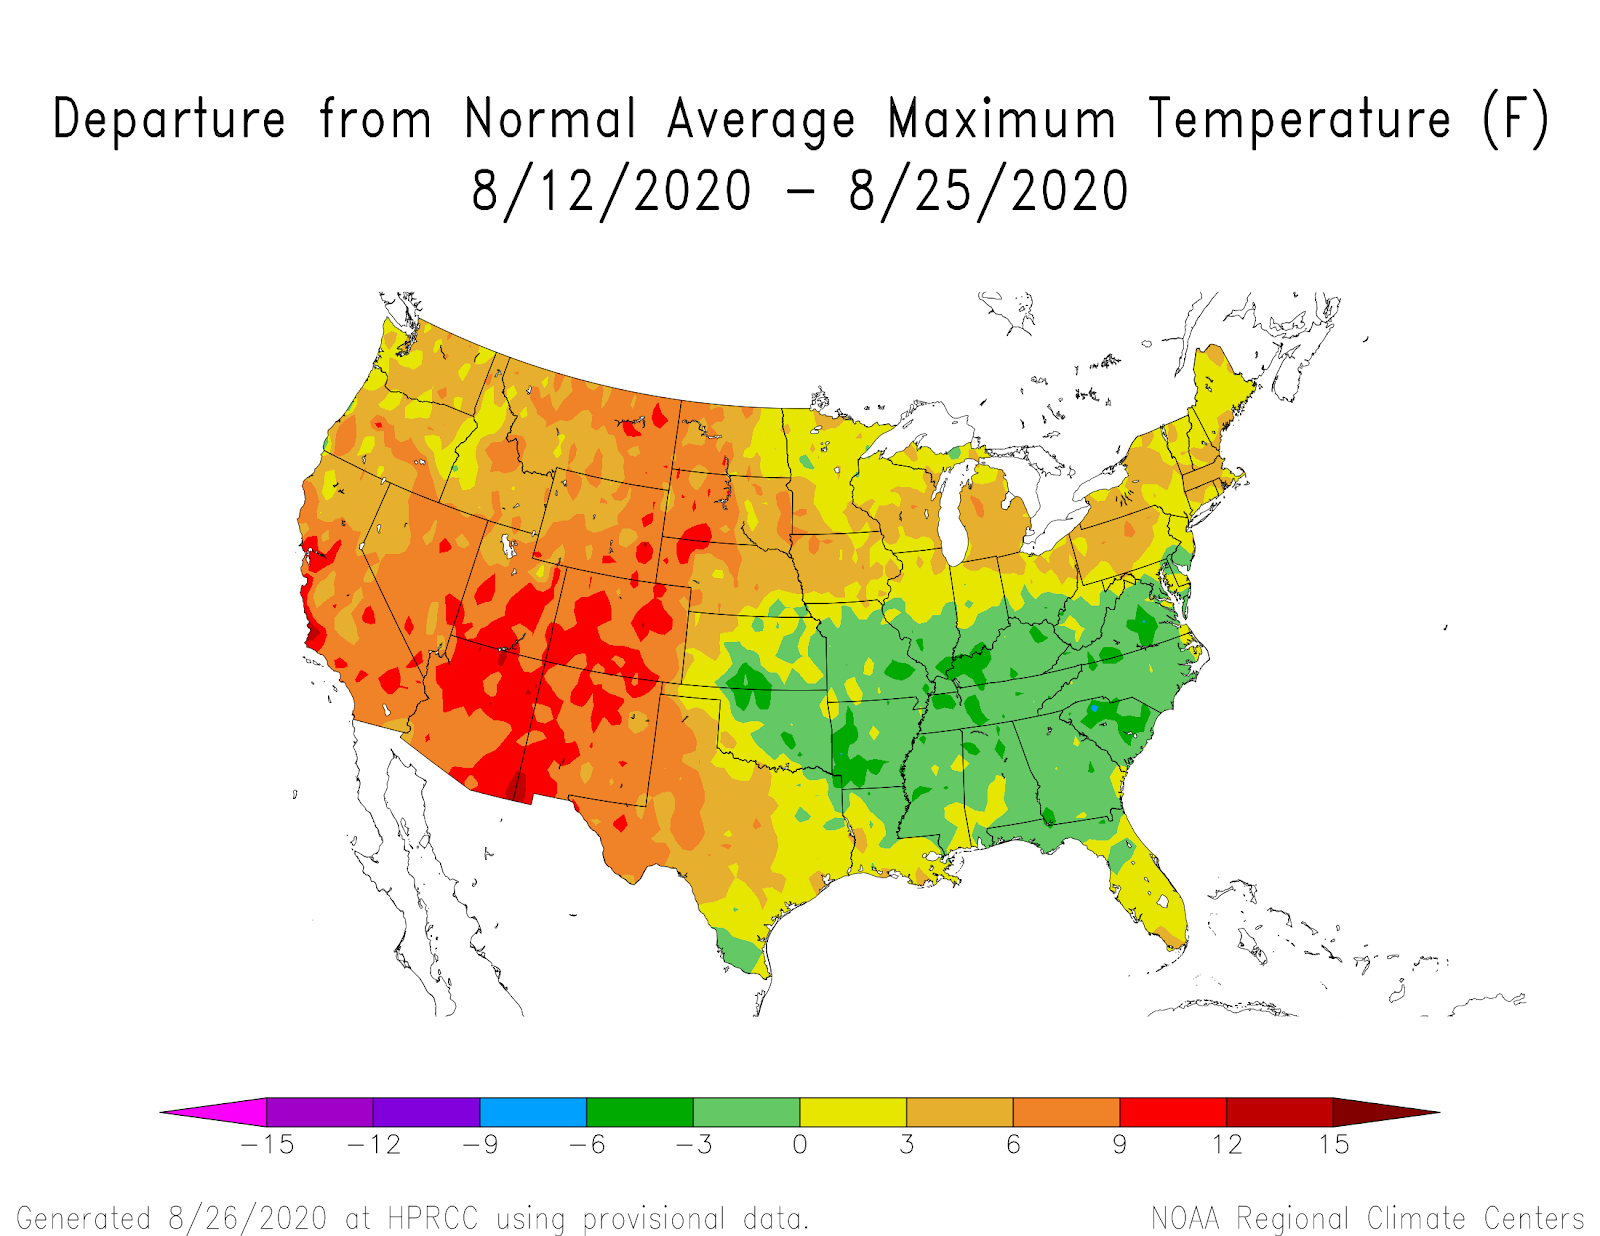
Departure from Normal Maximum Temperature - Last 2 Weeks
The last couple weeks have seen record heat across areas of the West, especially the Southwest and California. Numerous records have been broken. This has led to large expansion of drought in the Southwest as well as a greatly increased wildfire risk.
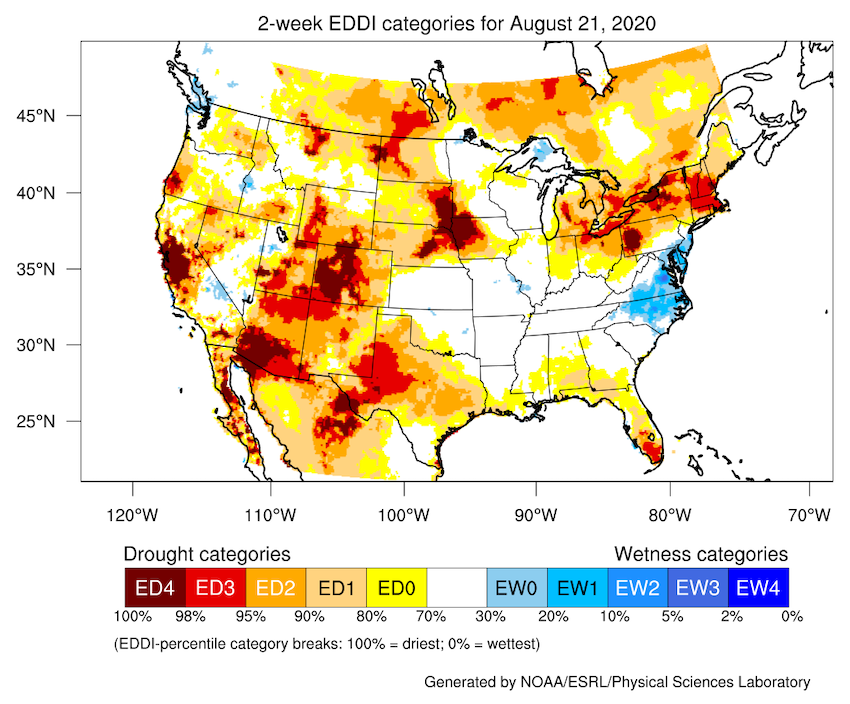
Evaporative Demand Drought Index (EDDI)
The Evaporative Demand Drought Index (EDDI) is an experimental drought monitoring and early warning guidance tool. It examines how anomalous the atmospheric evaporative demand (E0; also known as "the thirst of the atmosphere") is for a given location and across a time period of interest. EDDI can offer early warning of agricultural drought, hydrologic drought, and fire-weather risk. The driest areas on the two-week EDDI include Central CA, the Southwest, West TX, the Northeast and Western PA, parts of the Rockies, IA into SD and NE, and pockets in other states.
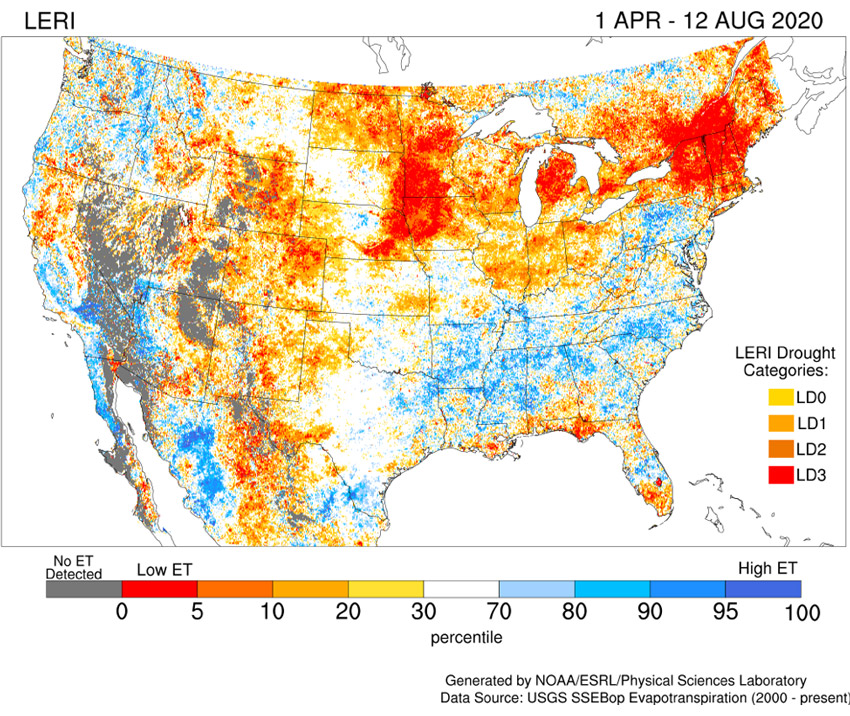
Landscape Evaporative Response Index (LERI)
The Landscape Evaporative Response Index (LERI) is an experimental drought-monitoring and early warning guidance tool that measures the anomaly in the actual evapotranspiration (ETa) from the land surface. It represents the anomalous state of land-surface moisture (i.e., soil moisture) that is readily accessible to plants (for transpiration) and the atmosphere (for evaporation). Work is ongoing to evaluate the early warning potential for agricultural and ecological droughts, flash drought, and wildfire risk. The 8-day accumulated LERI map shows severe to extreme drought in a large swath of the southwestern U.S, Great Basin, and Rockies (with the gray signifying extreme arid conditions). Other large areas showing severe to extreme drought include the Northeast, Western IA and MN into the surrounding states, and MI. Parts of the Great Plains, Midwest, and even a few spots in the Southeast show drought in the LERI map too.
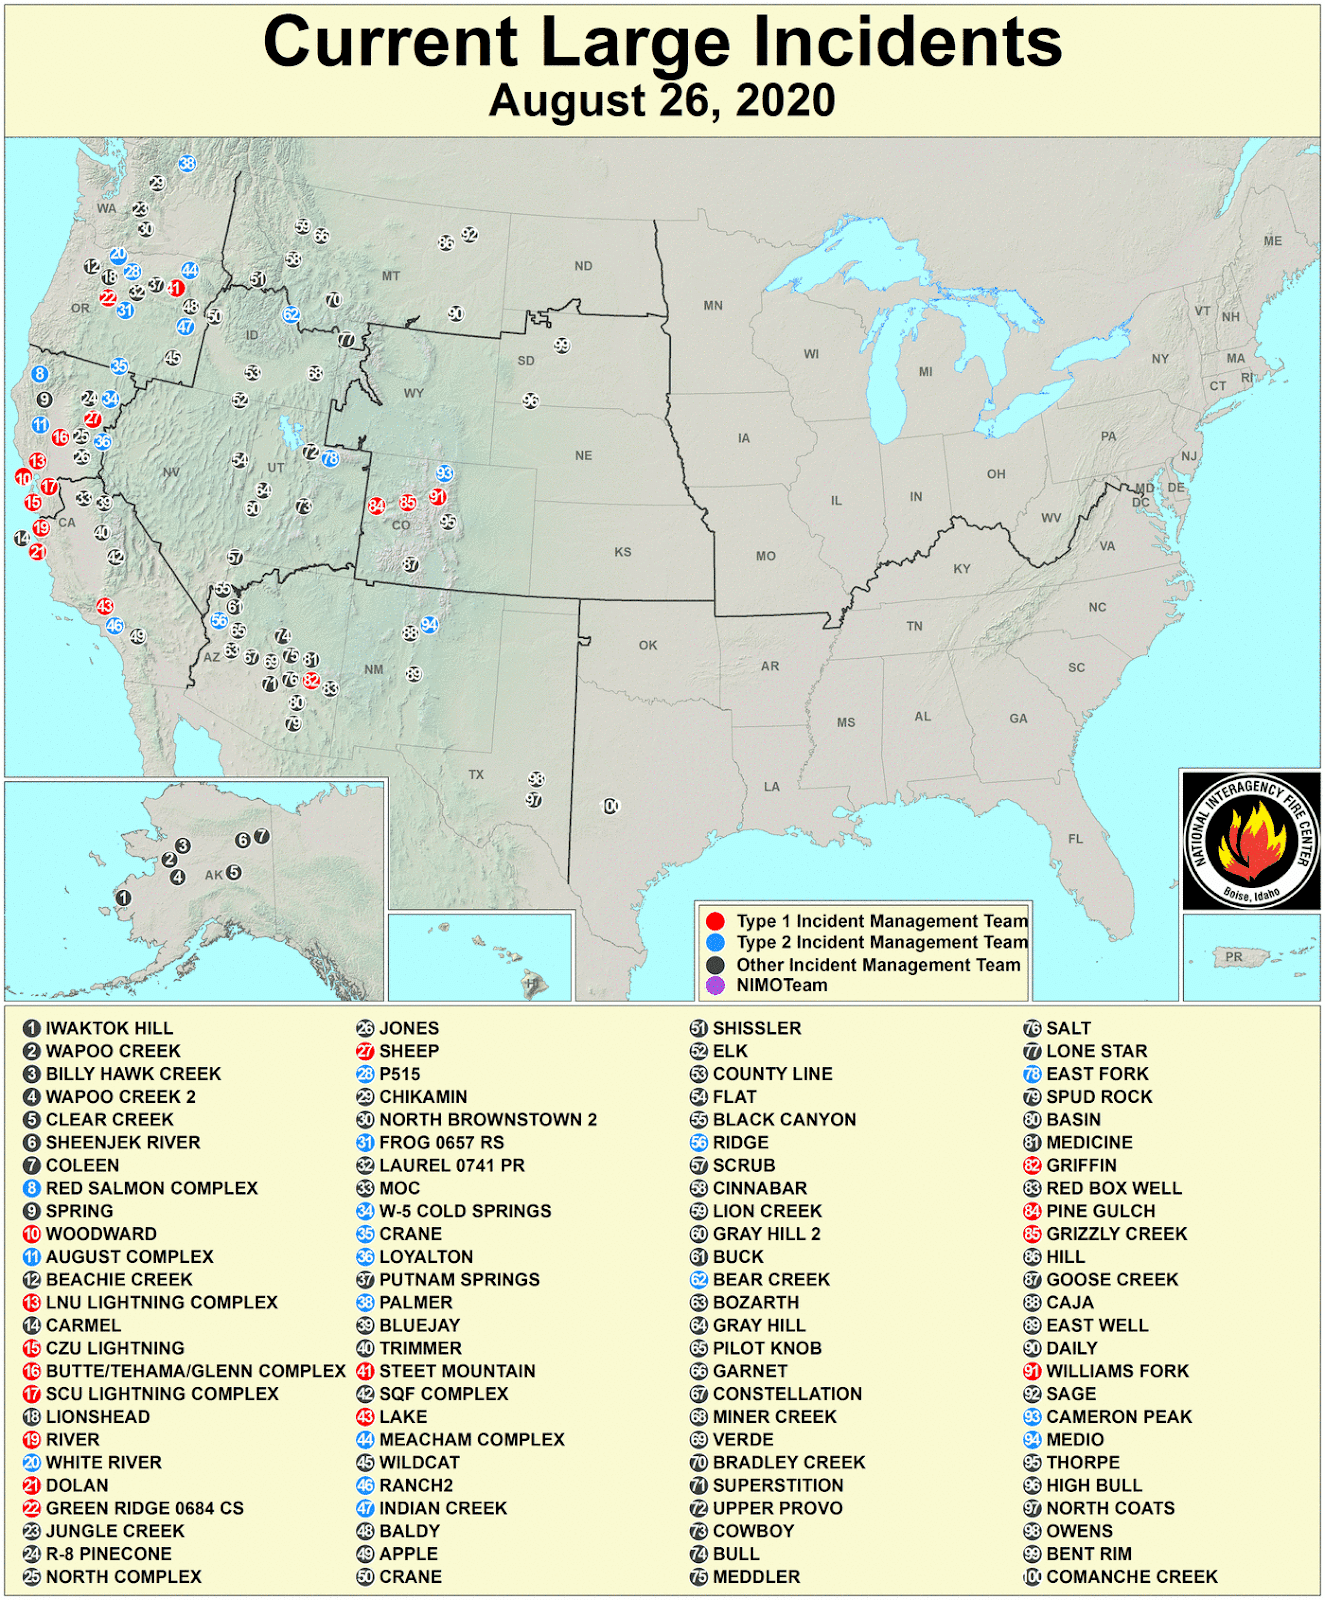
Current Large Fire Incidents
The extreme heat across the West the last few weeks, along with the current drought, has led to an explosion in large wildfires. As of August 26, there are 100 large fires in the U.S., according to the National Interagency Fire Center. Of these fires, 15 are being managed by Type 1 Incident Management Teams (red circles on the map).
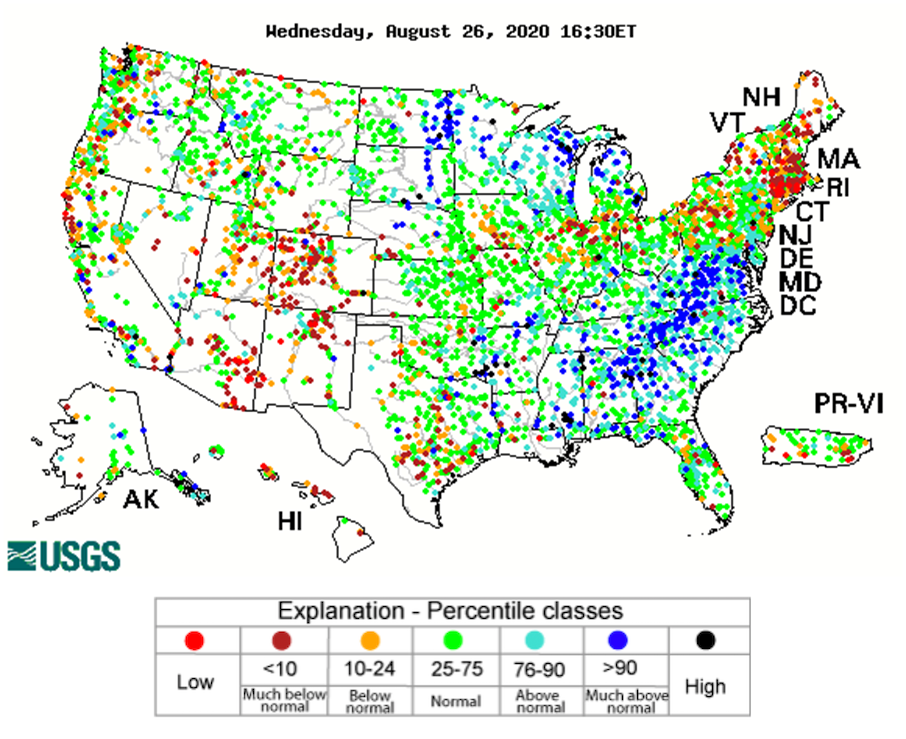
Streamflows
Streamflows are much below normal in Colorado through the Southwest, and in most of the Northeast. Low streamflows are also scattered throughout other drought areas.
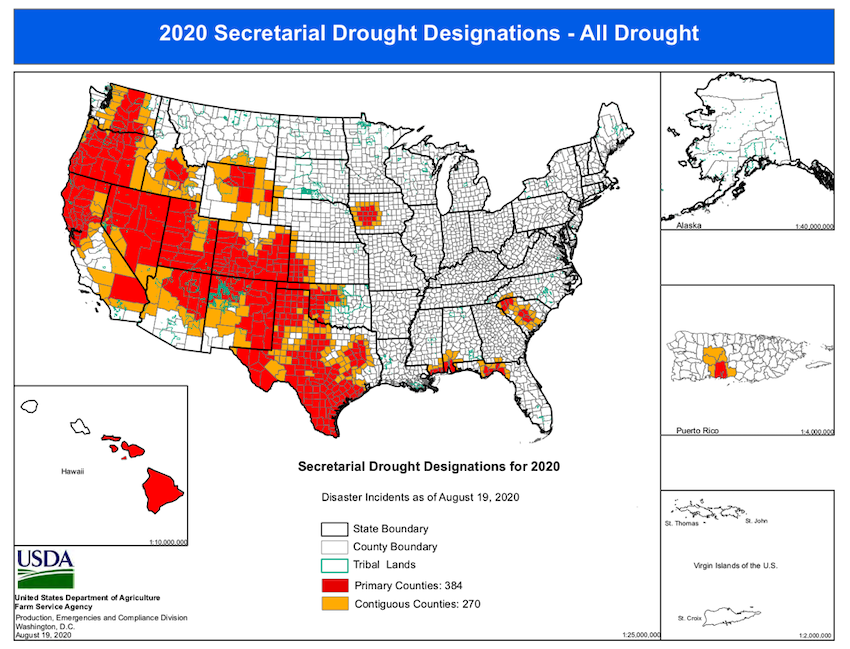
2020 USDA Drought Designated Counties Map
The Secretary of Agriculture is authorized to designate counties as disaster areas to make emergency loans (EM) available to producers suffering losses in those counties and in counties that are contiguous to a designated county. In addition to EM eligibility, other emergency assistance programs, such as Farm Service Agency disaster assistance programs, have historically used disaster designations as an eligibility trigger.
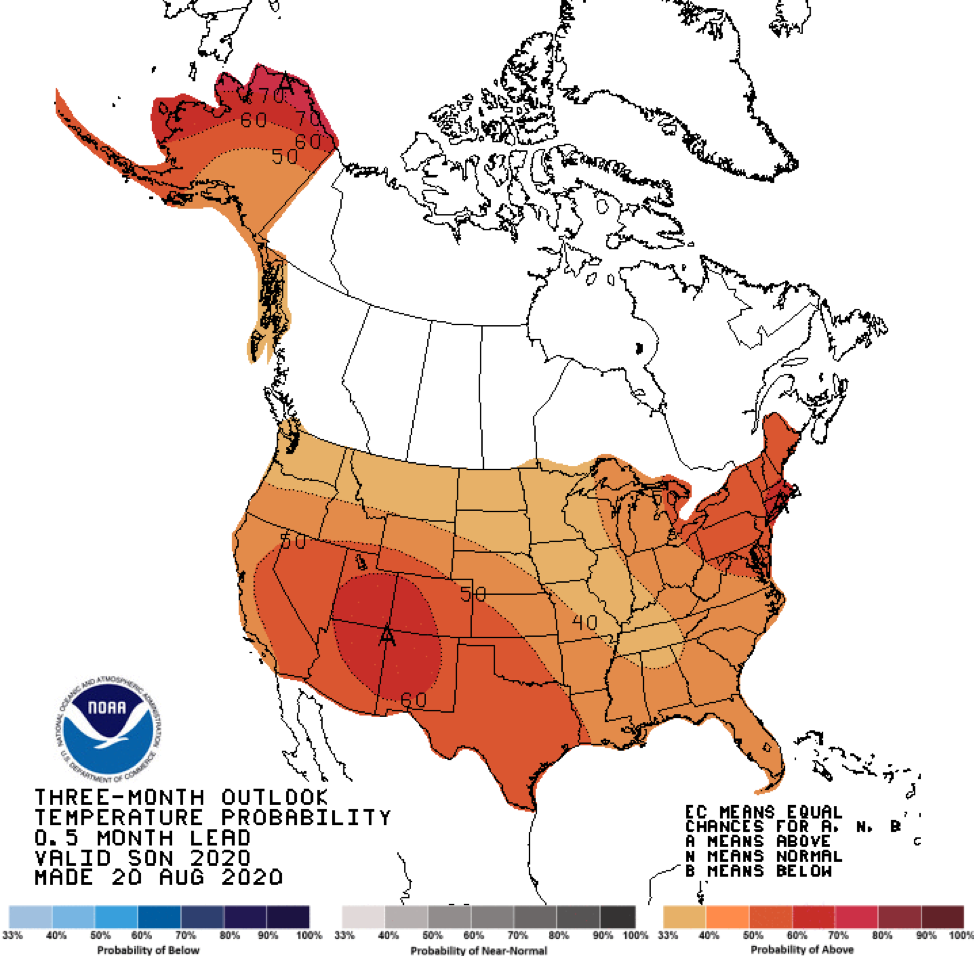
Three-Month Temperature Outlook
The entire U.S. is expected to have above-normal temperatures over the next three months. The highest probability of above-normal temperatures in the contiguous U.S. are in the Southwest and Northeast, two regions in drought.
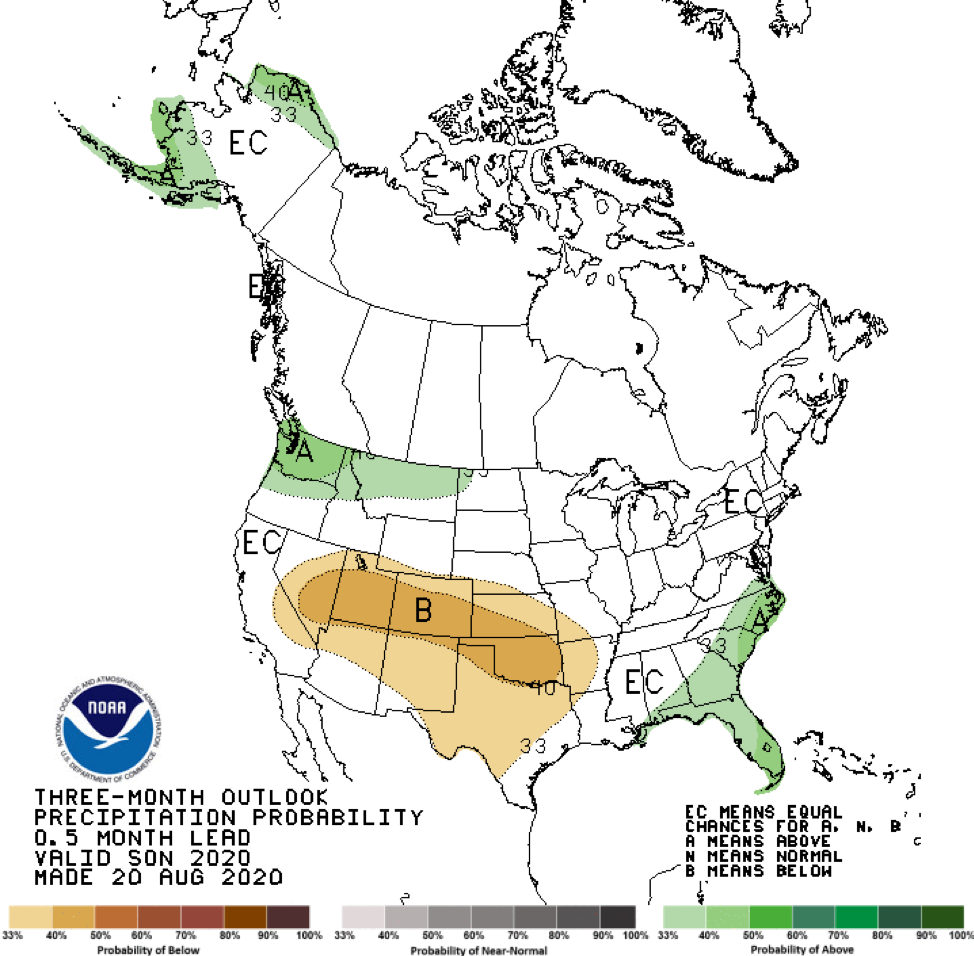
Three-Month Precipitation Outlook
Most of the Southwest and Southern Plains are expected to have below-normal precipitation over the next three months. In contrast, most of the Northwest is expected to have above-normal precipitation over the next three months. Other areas in drought, such as the Northeast and parts of the Midwest, have equal chances for above- or below-normal precipitation.
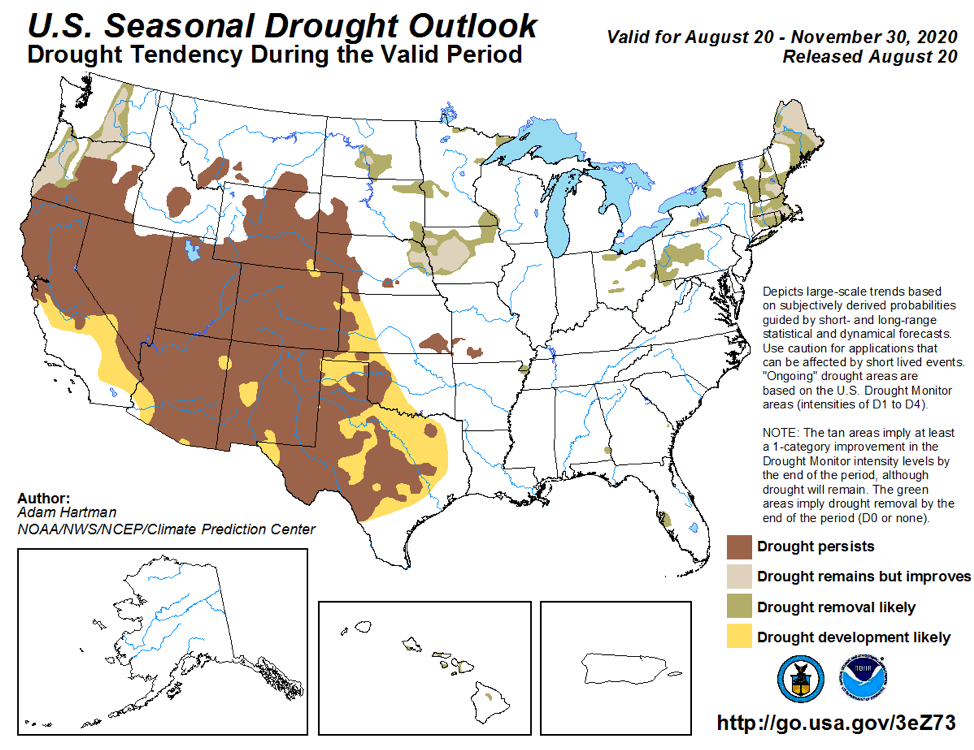
Seasonal Drought Outlook
The Seasonal Drought Outlook shows the predicted drought tendency to November 30. The outlook predicts that drought in the West will not only persist, but may in fact expand into more of the Southern Plains and Southern California. Areas that may improve include the Northwest, Northeast, Midwest, parts of the Northern Plains, and Hawaii.