GPCC: Drought Indices
Deutscher Wetterdienst
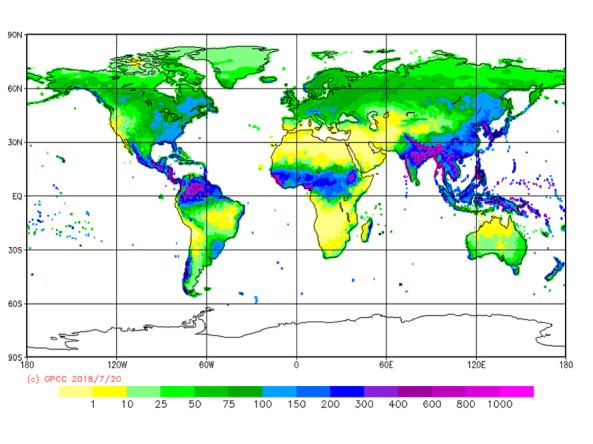
The Global Precipitation Climatology Centre (GPCC) provides unrestricted access to its monthly gridded precipitation data sets for climate monitoring purposes and related research. All users are requested to refer to the GPCC and the product specific DOI (Digital Object Identifier) reference as provided below. Available are the following user tailored products that differ with regard to the underlying data and the use case:
Near real-time First Guess of monthly precipitation anomalies based on SYNOP messages of meanwhile approx. 7,000 stations arriving with Deutscher Wetterdienst.
SPI
The Standardized Precipitation Index, or SPI, is a drought index that captures how observed precipitation deviates from the climatological average over a given time period. This global SPI is derived from the GPCC dataset, using the Climate Engine tool, and includes timescales of 1, 2, 3, 6, 9, 12, 24, 36, 48, 60, and 72 months. The SPI calculation uses a climatology period of 1991-2020 and non-parametric distribution type.
SPEI
The Standardized Precipitation Evapotranspiration Index (SPEI), derived from the GPCC dataset, is computed and hosted by the Consejo Superior de Investigaciones Científicas (CSIC), and includes timescales of 1, 2, 3, 6, 9, 12, 24, 36, and 48 months. The CSIC global SPEI database offers long-time, robust information about drought conditions at the global scale, with a 0.5 degrees spatial resolution and a monthly time resolution. It has a multi-scale character, providing SPEI time-scales between 1 and 48 months. It is based on monthly precipitation and potential evapotranspiration data from the Climatic Research Unit of the University of East Anglia, starting in January 1901, and it is updated as soon as new data becomes available.
DI
The GPCC drought index is a combination of the Standardized Precipitation Index (SPI; McKee et al., 1993) with the DWD modification according to Pietzsch et al. (2011) and the Standardized Precipitation Evapotranspiration Index (SPEI) according to Vicento-Serrano et al. (2009).
The 'Full Data Monthly, Version 7' DOI:10.5676/DWD_GPCC/FD_M_V7_100 is used as precipitation input data. For the monthly mean temperature data, NOAA's Climate Prediction Center (CPC) Monthly Global Surface Air Temperature Data Set is utilized (Fan and van den Dool, 2008). The temperature data are applied to calculate the potential evapotranspiration (PET) according to Thornthwaite (1948). Parameters to calculate SPI and SPEI were referenced to 1952-2013. Due to the non-applicability of the gamma distribution for precipitation in arid regions the SPI can not be calculated there. On the other hand, the PET can not be computed in cold regions applying the formula from Thornthwaite. Hence, the GPCC Drought Index is calculated as the mean of the SPI and SPEI. If one of these indices can not be computed, the one available is used, yielding an almost global coverage of the GPCC Drought Index.
The GPCC Drought Index is computed with aggregation periods of 1, 3, 6, 9, 12, 24 and 48 months. Each aggregation period is stored in a separate netCDF file. The GPCC Drought Index has a spatial resolution of 1° latitude by longitude using gridded input data fields at the same resolution.
Access
Global Precipitation Climatology Centre (GPCC) First Guess Monthly Data: Global gridded monthly totals available for download
Global Precipitation Climatology Centre (GPCC) Data Products: Visualize and download GPCC products
Data processed via Climate Engine available for download from NOAA/NIDIS
Documentation