Keetch-Byram Drought Index (KBDI) – North Carolina State Climate Office
North Carolina State Climate Office
The Keetch-Byram Drought Index (KBDI) assesses the likelihood of wildfires becoming large and difficult to contain by representing the net effect of evapotranspiration and precipitation in producing cumulative moisture deficiency in deep duff and upper soil layers.
The KBDI attempts to measure the amount of precipitation, in hundredths of inches, necessary to return the soil to full field capacity. The index ranges from zero, the point of no moisture deficiency, to 800, the maximum drought that is possible, and represents a moisture regime from 0 to 8 inches of water through the soil layer. At 8 inches of water, the KBDI assumes saturation. At any point along the scale, the index number indicates the amount of net rainfall that is required to reduce the index to zero, or saturation.
While KBDI does not indicate the risk of fire activity, at higher KBDI values, fires that do ignite are likely to be longer-lasting due to the increased dry fuel loading, and may require additional resources beyond local firefighting crews.
The KBDI from the Fire Weather Intelligence Portal, currently hosted by the North Carolina State Climate Office, is a gridded product based on National Weather Service radar-based precipitation estimates and gridded temperature estimates from PRISM.
The Keetch-Byram Drought Index (KBDI) assesses the likelihood of wildfires becoming large and difficult to contain by representing cumulative deficits in soil moisture.
The KBDI attempts to measure the amount of precipitation needed to return the soil to full field capacity (saturation). The index ranges from 0, the point of saturation (no moisture deficiency), to 800, the maximum dryness that is possible. The KBDI value indicates the amount of net rainfall (in hundredths of inches) required to reduce the index to zero, or saturation.
A drought index combines multiple drought indicators (e.g., precipitation, temperature, soil moisture) to depict drought conditions. For some products, like the U.S. Drought Monitor, authors combine their analysis of drought indicators with input from local observers. Other drought indices, like the Standardized Precipitation Index (SPI), use an objective calculation to describe the severity, location, timing, and/or duration of drought.
Learn MoreSoil moisture plays an important role in drought and flood forecasting, agricultural monitoring, forest fire prediction, water supply management, and other natural resource activities. Soil moisture observations can forewarn of impending drought or flood conditions before other more standard indicators are triggered.
Learn MoreDrought can alter the ecological balance of natural systems and harm fish, wildlife, and plant species, as well as the benefits that these ecosystems provide to human communities. The environmental consequences of drought include losses in plant growth; increases in fire and insect outbreaks; altered rates of carbon, nutrient, and water cycling; and local species extinctions.
Learn MoreDuring drought conditions, fuels for wildfire, such as grasses and trees, can dry out and become more flammable. Drought can also increase the probability of ignition and the rate at which fire spreads. Temperature, soil moisture, humidity, wind speed, and fuel availability (vegetation) are all factors that interact to influence the frequency of large wildfires.
Learn MoreKeetch-Byram Drought Index
0–200
The KBDI value indicates the amount of net rainfall (in hundredths of inches) required to reduce the index to zero, or saturation. A value of 0–200 indicates that 0–2 inches of rainfall are required to achieve soil saturation.
200–250
The KBDI value indicates the amount of net rainfall (in hundredths of inches) required to reduce the index to zero, or saturation. A value of 220–250 indicates that 2–2.5 inches of rainfall are required to achieve soil saturation.
250–300
The KBDI value indicates the amount of net rainfall (in hundredths of inches) required to reduce the index to zero, or saturation. A value of 250–300 indicates that 2.5–3 inches of rainfall are required to achieve soil saturation.
300–350
The KBDI value indicates the amount of net rainfall (in hundredths of inches) required to reduce the index to zero, or saturation. A value of 300–350 indicates that 3–3.5 inches of rainfall are required to achieve soil saturation.
350–400
The KBDI value indicates the amount of net rainfall (in hundredths of inches) required to reduce the index to zero, or saturation. A value of 350–400 indicates that 3.5–4 inches of rainfall are required to achieve soil saturation.
400–450
The KBDI value indicates the amount of net rainfall (in hundredths of inches) required to reduce the index to zero, or saturation. A value of 400–450 indicates that 4–4.5 inches of rainfall are required to achieve soil saturation.
450–500
The KBDI value indicates the amount of net rainfall (in hundredths of inches) required to reduce the index to zero, or saturation. A value of 450–500 indicates that 4.5–5 inches of rainfall are required to achieve soil saturation.
500–550
The KBDI value indicates the amount of net rainfall (in hundredths of inches) required to reduce the index to zero, or saturation. A value of 500–550 indicates that 5–5.5 inches of rainfall are required to achieve soil saturation.
550–600
The KBDI value indicates the amount of net rainfall (in hundredths of inches) required to reduce the index to zero, or saturation. A value of 550–600 indicates that 5.5–6 inches of rainfall are required to achieve soil saturation.
600–650
The KBDI value indicates the amount of net rainfall (in hundredths of inches) required to reduce the index to zero, or saturation. A value of 600–650 indicates that 6–6.5 inches of rainfall are required to achieve soil saturation.
650–700
The KBDI value indicates the amount of net rainfall (in hundredths of inches) required to reduce the index to zero, or saturation. A value of 650–700 indicates that 6.5–7 inches of rainfall are required to achieve soil saturation.
700–800
The KBDI value indicates the amount of net rainfall (in hundredths of inches) required to reduce the index to zero, or saturation. A value of 700–800 indicates that 7–8+ inches of rainfall are required to achieve soil saturation.
The Keetch-Byram Drought Index (KBDI) assesses the likelihood of wildfires becoming large and difficult to contain by representing cumulative deficits in soil moisture.
The KBDI attempts to measure the amount of precipitation needed to return the soil to full field capacity (saturation). The index ranges from 0, the point of saturation (no moisture deficiency), to 800, the maximum dryness that is possible. The KBDI value indicates the amount of net rainfall (in hundredths of inches) required to reduce the index to zero, or saturation.
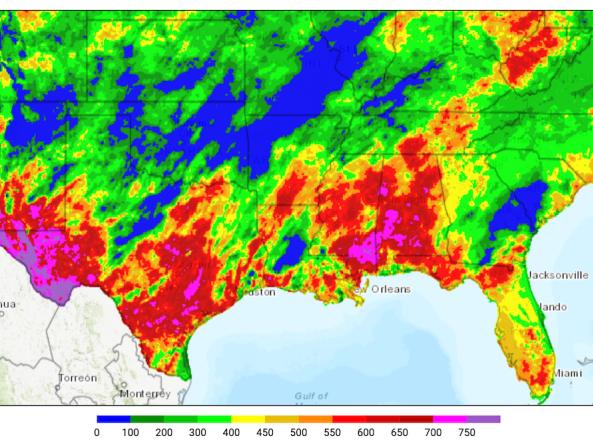
This Keetch-Byram Drought Index (KBDI) map is updated daily.
A drought index combines multiple drought indicators (e.g., precipitation, temperature, soil moisture) to depict drought conditions. For some products, like the U.S. Drought Monitor, authors combine their analysis of drought indicators with input from local observers. Other drought indices, like the Standardized Precipitation Index (SPI), use an objective calculation to describe the severity, location, timing, and/or duration of drought.
Learn MoreSoil moisture plays an important role in drought and flood forecasting, agricultural monitoring, forest fire prediction, water supply management, and other natural resource activities. Soil moisture observations can forewarn of impending drought or flood conditions before other more standard indicators are triggered.
Learn MoreDrought can alter the ecological balance of natural systems and harm fish, wildlife, and plant species, as well as the benefits that these ecosystems provide to human communities. The environmental consequences of drought include losses in plant growth; increases in fire and insect outbreaks; altered rates of carbon, nutrient, and water cycling; and local species extinctions.
Learn MoreDuring drought conditions, fuels for wildfire, such as grasses and trees, can dry out and become more flammable. Drought can also increase the probability of ignition and the rate at which fire spreads. Temperature, soil moisture, humidity, wind speed, and fuel availability (vegetation) are all factors that interact to influence the frequency of large wildfires.
Learn MoreAccess
Fire Weather Intelligence Portal
For questions about these data, please contact climate-office@ncsu.edu.
How To
KBDI values range from 0 to 800 and represent cumulative soil moisture deficiency measured in hundredths of an inch. While the KBDI measures dryness, it isn’t designed to assess whether a certain level of dryness is unusual for a particular location and time of year.
Because the KBDI includes a temperature component, it has a pronounced seasonality, and it is often not appropriate to compare values from different times of year. For example, KBDI values that represent “normal” dryness in the summer may be above-normal in the winter. The KBDI also includes reference to local climate by incorporating annual average precipitation, so it is often difficult or incorrect to compare values from different locations, especially if they have sharply different climate regimes.
The descriptions below can act as a helpful guide to interpreting KBDI values:
- 0–200: Soil moisture and large class fuel moistures are high and do not contribute much to fire intensity. Typical of spring dormant season following winter precipitation.
- 200–400: Typical of late spring, early growing season. Lower litter and duff layers are drying and beginning to contribute to fire intensity.
- 400–600: Typical of late summer, early fall. Lower litter and duff layers actively contribute to fire intensity and will burn actively. A KBDI value of 450 is often treated as a critical threshold, as fires starting at or beyond this level are likely to be severe and may burn deep enough to cause root damage in pine trees.
- 600–800: Often associated with more severe drought with increased wildfire occurrence. Intense, deep burning fires with significant downwind spotting can be expected. Live fuels can also be expected to burn actively at these levels.
Documentation