Landscape Evaporative Response Index (LERI)
National Oceanic and Atmospheric Administration (NOAA) Physical Sciences Laboratory (PSL), University of Colorado Boulder, Cooperative Institute for Research in Environmental Sciences (CIRES), Western Water Assessment (WWA, a NOAA RISA team), U.S. Geological Survey, North Central Climate Adaptation Science Center
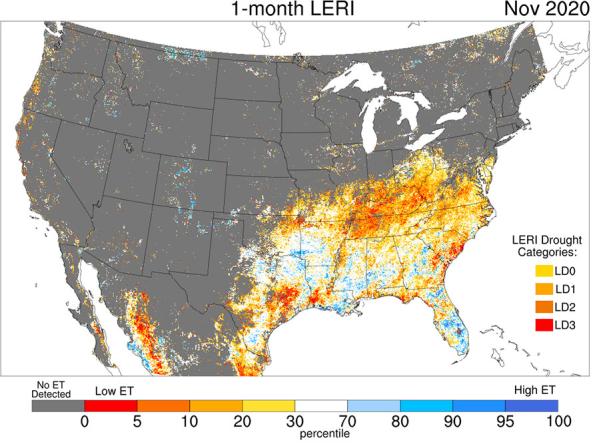
The Landscape Evaporative Response Index (LERI) is an experimental drought-monitoring and early warning guidance tool that measures the anomaly in the actual evapotranspiration (ETa) from the land surface. By its design, LERI largely reflects the anomalous state of land-surface moisture (i.e., soil moisture) that is readily accessible to plants (for transpiration) and the atmosphere (for evaporation from bare soils and water bodies).
NOAA's Physical Sciences Laboratory provides LERI plots based on accumulated 8-day, monthly, seasonal, growing season, and annual ETa for the contiguous United States and northern Mexico at a 1-km spatial resolution. LERI uses high-resolution MODIS satellite data, and data are available from January 2000 to the present.
ETa is the sum of transpiration from vegetation and evaporation from soil (and water bodies), and is accumulated over a given time period for a given location. The ETa data on which LERI is based are produced by the U. S. Geological Survey using the operational Simplified Surface Energy Balance (SSEBop) model (Senay et al., 2013). SSEBop combines evapotranspiration fraction (i.e., the ability of the land surface to meet the atmospheric demand for water vapor, expressed as a proportion of that demand) generated from remotely sensed MODIS thermal imagery, acquired every 8 days, with climatological atmospheric evaporative demand as represented by reference evapotranspiration derived using the Penman-Montieth formulation and driven by from University of Idaho's Gridded Surface Meteorological Data for that period.
LERI uses a rank-based, non-parametric (Tukey) method to estimate percentiles of the SSEBop ETa data compared to the available period of record (January 2000 to present). LERI percentiles are binned into four drought categories (LD0 - LD3) analogous to the U.S. Drought Monitor (USDM) categories (i.e., D0 - D3) and using the same percentile breaks that USDM considers for soil moisture. LERI does not have an LD4 category (i.e., the 2nd-percentile break) because of the short period of the record.
Access
Landscape Evaporative Response Index (LERI) Landing Page: View LERI information, monthly and 8-day LERI maps, and LERI time series from NOAA's Physical Sciences Laboratory
LERI Resources: Access LERI data downloads, documentation, and presentations.
LERI Data and Maps (FTP): Download LERI data as netCDF files.
R Utility to Extract LERI Data: Download LERI data from GitHub.
How To
Documentation
Atual evapotranspiration (ETa) is the sum of transpiration from vegetation and evaporation from soil (and water bodies), and is accumulated over a given time period for a given location. The ETa data on which LERI is based are produced by the U. S. Geological Survey using the operational Simplified Surface Energy Balance (SSEBop) model (Senay et al., 2013). SSEBop combines evapotranspiration fraction (i.e., the ability of the land surface to meet the atmospheric demand for water vapor, expressed as a proportion of that demand) generated from remotely sensed MODIS thermal imagery, acquired every 8 days, with climatological atmospheric evaporative demand as represented by reference evapotranspiration derived using the Penman-Montieth formulation and driven by from University of Idaho's Gridded Surface Meteorological Data for that period.
LERI uses a rank-based, non-parametric (Tukey) method to estimate percentiles of the SSEBop ETa data compared to the available period of record (January 2000–present). LERI percentiles are binned into four drought categories (LD0–LD3) analogous to the U.S. Drought Monitor (USDM) categories (i.e., D0–D3) and using the same percentile breaks that USDM considers for soil moisture. LERI does not have an LD4 category (i.e., the 2nd-percentile break) because of the short period of record.
References
Rangwala, I., Smith, L.L., Senay, G., Barsugli, J., Kagone, S., and Hobbins, M. 2019. Landscape Evaporative Response Index (LERI): A High Resolution Monitoring and Assessment of Evapotranspiration Across the Contiguous United States. U.S. Geological Survey ScienceBase.
Savoca, M.E., Senay, G.B., Maupin, M.A., Kenny, J.F., and Perry, C.A., 2013. Actual evapotranspiration modeling using the operational Simplified Surface Energy Balance (SSEBop) approach. U.S. Geological Survey Scientific Investigations Report 2013-5126.
Senay, Gabriel B., Stefanie Bohms, Ramesh K. Singh, Prasanna H. Gowda, Naga M. Velpuri, Henok Alemu, James P. Verdin. 2013b. Operational Evapotranspiration Mapping Using Remote Sensing and Weather Datasets: A New Parameterization for the SSEB Approach. Journal of the American Water Resources Association (JAWRA). 49(3): 577-591.