Multi-Radar Multi-Sensor System (MRMS)
NOAA National Severe Storms Laboratory (NSSL); Cooperative Institute for Severe and High-Impact Weather Research and Operations (CIWRO); NOAA National Weather Service National Centers for Environmental Prediction (NCEP)
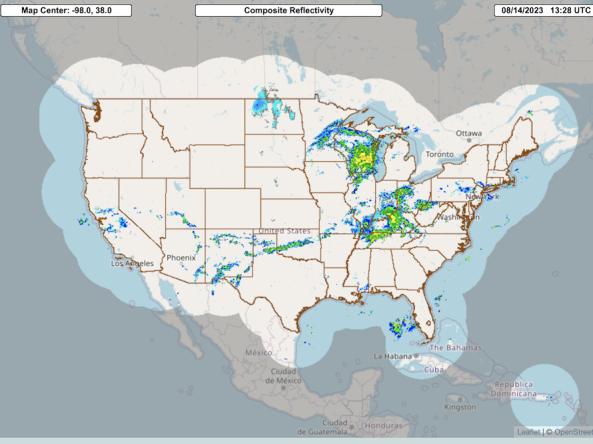
The Multi-Radar Multi-Sensor (MRMS) system combines data streams from multiple radars, satellites, surface observations, upper air observations, lightning reports, rain gauges, and numerical weather prediction models to produce a suite of decision-support products every two minutes. Because it provides better depictions of high-impact weather events such as heavy rain, snow, hail, tornadoes, and other threats, forecasters can quickly diagnose severe weather and issue more accurate and earlier forecasts and warnings.
The MRMS system was developed to produce severe weather, transportation, and precipitation products for improved decision-making capability to improve hazardous weather forecasts and warnings, along with hydrology, aviation, and numerical weather prediction.
The MRMS system was jointly developed by the NOAA National Severe Storms Laboratory (NSSL) and the Cooperative Institute for Severe and High-Impact Weather Research and Operations (CIWRO; formerly CIMMS). MRMS was deployed operationally in 2014 at the National Weather Service's National Centers for Environmental Prediction (NCEP).
This map shows precipitation accumulations (in inches) for the past 7 days. Darker green/blue shades indicate greater precipitation amounts.
This map shows precipitation accumulations (in inches) for the past 30 days. Darker green/blue shades indicate greater precipitation amounts.
This map shows precipitation accumulations (in inches) for the past 3 months (90 days). Darker green/blue shades indicate greater precipitation amounts.
This map shows precipitation accumulations (in inches) for the past 3 months (120 days). Darker green/blue shades indicate greater precipitation amounts.
Drought is defined as the lack of precipitation over an extended period of time, usually for a season or more, that results in a water shortage. Changes in precipitation can substantially disrupt crops and livestock, influence the frequency and intensity of severe weather events, and affect the quality and quantity of water available for municipal and industrial use.
Learn MorePeriods of drought can lead to inadequate water supply, threatening the health, safety, and welfare of communities. Streamflow, groundwater, reservoir, and snowpack data are key to monitoring and forecasting water supply.
Learn MoreDrought can reduce the water availability and water quality necessary for productive farms, ranches, and grazing lands, resulting in significant negative direct and indirect economic impacts to the agricultural sector. Monitoring agricultural drought typically focuses on examining levels of precipitation, evaporative demand, soil moisture, and surface/groundwater quantity and quality.
Learn MoreDrought is defined as the lack of precipitation over an extended period of time, usually for a season or more, that results in a water shortage. Changes in precipitation can substantially disrupt crops and livestock, influence the frequency and intensity of severe weather events, and affect the quality and quantity of water available for municipal and industrial use.
Learn MorePeriods of drought can lead to inadequate water supply, threatening the health, safety, and welfare of communities. Streamflow, groundwater, reservoir, and snowpack data are key to monitoring and forecasting water supply.
Learn MoreDrought can reduce the water availability and water quality necessary for productive farms, ranches, and grazing lands, resulting in significant negative direct and indirect economic impacts to the agricultural sector. Monitoring agricultural drought typically focuses on examining levels of precipitation, evaporative demand, soil moisture, and surface/groundwater quantity and quality.
Learn MoreInches of Precipitation
Less than 0.01 Inch
This location received less than 0.01 inch of precipitation during this 7-day period.
0.01 to 0.1 Inch
This location received 0.01–0.5 inch of precipitation during this 7-day period.
0.5 to 1 Inch
This location received 0.5–1 inch of precipitation during this 7-day period.
1–2 Inches
This location received 1–2 inches of precipitation during this 7-day period.
2–4 Inches
This location received 2–4 inches of precipitation during this 7-day period.
4–6 Inches
This location received 4–6 inches of precipitation during this 7-day period.
6–8 Inches
This location received 6–8 inches of precipitation during this 7-day period.
8 or More Inches
This location received 8 or more inches of precipitation during this 7-day period.
Inches of Precipitation
Less than 0.01 Inch
This location received less than 0.01 inch of precipitation during this 30-day period.
0.01 to 0.5 Inch
This location received 0.01–0.5 inch of precipitation during this 30-day period.
0.5–1 Inch
This location received 0.5–1 inch of precipitation during this 30-day period.
1–2 Inches
This location received 1–2 inches of precipitation during this 30-day period.
2–4 Inches
This location received 2–4 inches of precipitation during this 30-day period.
4–6 Inches
This location received 4–6 inches of precipitation during this 30-day period.
6–8 Inches
This location received 6–8 inches of precipitation during this 30-day period.
8 or More Inches
This location received 8 or more inches of precipitation during this 30-day period.
Inches of Precipitation
Less than 0.01 Inch
This location received less than 0.01 inch of precipitation during this 90-day period.
0.01 to 1 Inch
This location received 0.01–1 inch of precipitation during this 90-day period.
1–3 Inches
This location received 1–3 inches of precipitation during this 90-day period.
3–6 Inches
This location received 3–6 inches of precipitation during this 90-day period.
6–12 Inches
This location received 6–12 inches of precipitation during this 90-day period.
12–18 Inches
This location received 12–18 inches of precipitation during this 90-day period.
18–24 Inches
This location received 18–24 inches of precipitation during this 90-day period.
24 or More Inches
This location received 24 or more inches of precipitation during this 90-day period.
Inches of Precipitation
This location received less than 0.1 inch of precipitation during this 3-month period.
This location received 0.1–1 inch of precipitation during this 3-month period.
This location received 1–3 inch of precipitation during this 3-month period.
This location received 3–6 inches of precipitation during this 3-month period.
This location received 6–12 inches of precipitation during this 3-month period.
This location received 12–18 inches of precipitation during this 3-month period.
This location received 18–24 inches of precipitation during this 3-month period.
This location received more than 24 inches of precipitation during this 3-month period.
This map shows precipitation accumulations (in inches) for the past 7 days. Darker green/blue shades indicate greater precipitation amounts.
This map shows precipitation accumulations (in inches) for the past 30 days. Darker green/blue shades indicate greater precipitation amounts.
This map shows precipitation accumulations (in inches) for the past 3 months (90 days). Darker green/blue shades indicate greater precipitation amounts.
This map shows precipitation accumulations (in inches) for the past 3 months (120 days). Darker green/blue shades indicate greater precipitation amounts.
MRMS precipitation maps are updated daily on Drought.gov, with data valid through 7 a.m. Eastern that morning.
MRMS precipitation maps are updated daily on Drought.gov, with data valid through 7 a.m. Eastern that morning.
MRMS precipitation maps are updated daily on Drought.gov, with data valid through 7 a.m. Eastern that morning.
MRMS precipitation maps are updated daily on Drought.gov, with data valid through 7 a.m. Eastern that morning.
Drought is defined as the lack of precipitation over an extended period of time, usually for a season or more, that results in a water shortage. Changes in precipitation can substantially disrupt crops and livestock, influence the frequency and intensity of severe weather events, and affect the quality and quantity of water available for municipal and industrial use.
Learn MorePeriods of drought can lead to inadequate water supply, threatening the health, safety, and welfare of communities. Streamflow, groundwater, reservoir, and snowpack data are key to monitoring and forecasting water supply.
Learn MoreDrought can reduce the water availability and water quality necessary for productive farms, ranches, and grazing lands, resulting in significant negative direct and indirect economic impacts to the agricultural sector. Monitoring agricultural drought typically focuses on examining levels of precipitation, evaporative demand, soil moisture, and surface/groundwater quantity and quality.
Learn MoreDrought is defined as the lack of precipitation over an extended period of time, usually for a season or more, that results in a water shortage. Changes in precipitation can substantially disrupt crops and livestock, influence the frequency and intensity of severe weather events, and affect the quality and quantity of water available for municipal and industrial use.
Learn MorePeriods of drought can lead to inadequate water supply, threatening the health, safety, and welfare of communities. Streamflow, groundwater, reservoir, and snowpack data are key to monitoring and forecasting water supply.
Learn MoreDrought can reduce the water availability and water quality necessary for productive farms, ranches, and grazing lands, resulting in significant negative direct and indirect economic impacts to the agricultural sector. Monitoring agricultural drought typically focuses on examining levels of precipitation, evaporative demand, soil moisture, and surface/groundwater quantity and quality.
Learn MoreDrought is defined as the lack of precipitation over an extended period of time, usually for a season or more, that results in a water shortage. Changes in precipitation can substantially disrupt crops and livestock, influence the frequency and intensity of severe weather events, and affect the quality and quantity of water available for municipal and industrial use.
Learn MorePeriods of drought can lead to inadequate water supply, threatening the health, safety, and welfare of communities. Streamflow, groundwater, reservoir, and snowpack data are key to monitoring and forecasting water supply.
Learn MoreDrought can reduce the water availability and water quality necessary for productive farms, ranches, and grazing lands, resulting in significant negative direct and indirect economic impacts to the agricultural sector. Monitoring agricultural drought typically focuses on examining levels of precipitation, evaporative demand, soil moisture, and surface/groundwater quantity and quality.
Learn MoreDrought is defined as the lack of precipitation over an extended period of time, usually for a season or more, that results in a water shortage. Changes in precipitation can substantially disrupt crops and livestock, influence the frequency and intensity of severe weather events, and affect the quality and quantity of water available for municipal and industrial use.
Learn MorePeriods of drought can lead to inadequate water supply, threatening the health, safety, and welfare of communities. Streamflow, groundwater, reservoir, and snowpack data are key to monitoring and forecasting water supply.
Learn MoreDrought can reduce the water availability and water quality necessary for productive farms, ranches, and grazing lands, resulting in significant negative direct and indirect economic impacts to the agricultural sector. Monitoring agricultural drought typically focuses on examining levels of precipitation, evaporative demand, soil moisture, and surface/groundwater quantity and quality.
Learn MoreAccess
MRMS Operational Product Viewer: Interactive map viewer that displays a rolling archive of real-time operational MRMS products dating back to October 2020.
Data Download: Operational MRMS products are available in realtime from NCEP via HTTP and LDM in GRIB2 format.
- HTTP: https://mrms.ncep.noaa.gov/data/
- LDM: Contact NCEP Central Operations at idp-support@noaa.gov using “MRMS Data Request” in your subject line. Provide your IP address and contact name, phone number, and email address.