National Water Prediction Service (NWPS) River Gauge Observations/Forecasts and Flood Outlooks
NOAA National Weather Service's National Water Prediction Service (NWPS)
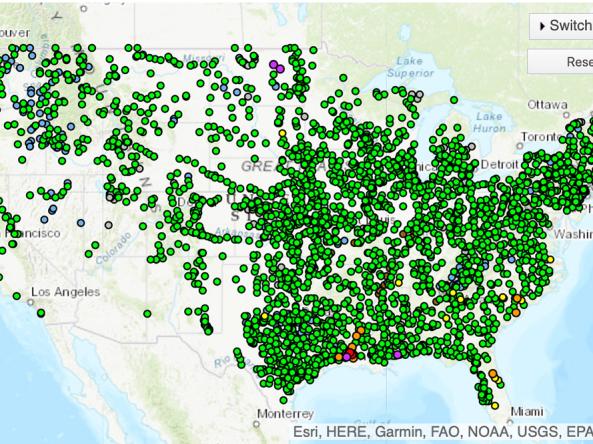
The National Weather Service (NWS) National Water Prediction Service (NWPS) provides short-term observed and climatic trends of precipitation, river stage observations and forecasts, and long-range river flood outlooks across the lower 48 United States (CONUS), Puerto Rico, and Alaska. The NWPS river stage observation and forecast products and long-range river flood outlooks display the magnitude and uncertainty of occurrence of floods or droughts, from hours to days and months, in advance.
The majority of the observed water level data displayed on the NWPS web pages originates from the U.S. Geological Survey (USGS) National Streamflow Information Program, which maintains a national network of streamgages. In addition, real-time water level information is collected from other federal, state, and local streamgage networks.
In March 2024, the NWPS replaced the NWS Advanced Hydrologic Prediction Service (AHPS) as the primary source for NWS water prediction information.
River forecast data from the National Weather Service's National Water Prediction Service (NWPS) provide valuable information about the chances of flood occurring. These river stage/flow forecasts show the maximum forecast flood category, taking into account past precipitation and the precipitation amounts expected approximately 48 hours into the future from the forecast issuance time.
Periods of drought can lead to inadequate water supply, threatening the health, safety, and welfare of communities. Streamflow, groundwater, reservoir, and snowpack data are key to monitoring and forecasting water supply.
Learn MoreExtreme weather events can interact or cascade—where one disaster event triggers or changes the probability of another event. For example, drought conditions can increase the probability of large-scale wildfires, and droughts are often accompanied by extreme heat. By including drought in multi-hazard planning, a community can consolidate its resources and develop coordinated responses before a disaster.
Learn MoreIn a drought, lower water levels or snowpack can affect the availability of recreational activities and associated tourism, and a resulting loss of revenue can severely impact supply chains and the economy. Drought—as well as negative perceptions of drought, fire bans, or wildfires—may also result in decreased visitations, cancellations in hotel stays, a reduction in booked holidays, or reduced merchandise sales.
Learn MoreDuring drought conditions that result in low water levels on rivers and other waterways, port and maritime navigation and transportation operations may be limited due to a reduction in available routes and cargo-carrying capacity, resulting in increased costs. In addition, higher temperatures that often coexist with drought can impact roads, airport runways, and rail lines.
Learn MoreMaximum Forecast River Stage
Major Flood
According to the National Weather Service, the Major Flood stage indicates "extensive inundation of structures and roads, significant evacuations of people, and/or transfer of property to higher elevations."
Moderate Flood
According to the National Weather Service, the Moderate Flood stage indicates "some inundation of structures and roads near stream, evacuations of people, and/or transfer of property to higher elevations."
Minor Flood
According to the National Weather Service, the Minor Flood stage indicates flooding with "minimal or no property damage, but possible some public threat (e.g., inundation of roads)."
Action Stage
When a location on the river hits the Action Stage, water levels have reached a height where "action is taken in preparation for possible significant hydrological activity," according to the National Weather Service.
No Flood
According to the National Weather Service, no flooding is indicated.
Low Water
According to the National Weather Service, the Low Water Threshold is the stage at which "low water levels begin to have significant negative impacts on a water-related industry or user community."
River forecast data from the National Weather Service's National Water Prediction Service (NWPS) provide valuable information about the chances of flood occurring. These river stage/flow forecasts show the maximum forecast flood category, taking into account past precipitation and the precipitation amounts expected approximately 48 hours into the future from the forecast issuance time.
River gauge forecasts from the National Weather Service are updated daily.
Periods of drought can lead to inadequate water supply, threatening the health, safety, and welfare of communities. Streamflow, groundwater, reservoir, and snowpack data are key to monitoring and forecasting water supply.
Learn MoreExtreme weather events can interact or cascade—where one disaster event triggers or changes the probability of another event. For example, drought conditions can increase the probability of large-scale wildfires, and droughts are often accompanied by extreme heat. By including drought in multi-hazard planning, a community can consolidate its resources and develop coordinated responses before a disaster.
Learn MoreIn a drought, lower water levels or snowpack can affect the availability of recreational activities and associated tourism, and a resulting loss of revenue can severely impact supply chains and the economy. Drought—as well as negative perceptions of drought, fire bans, or wildfires—may also result in decreased visitations, cancellations in hotel stays, a reduction in booked holidays, or reduced merchandise sales.
Learn MoreDuring drought conditions that result in low water levels on rivers and other waterways, port and maritime navigation and transportation operations may be limited due to a reduction in available routes and cargo-carrying capacity, resulting in increased costs. In addition, higher temperatures that often coexist with drought can impact roads, airport runways, and rail lines.
Learn MoreHow to
View the User's Guide to the National Water Prediction Service (NWPS).
- On the interactive NWPS map, under “River Gauge,” users can select “observations and forecasts” or the “long range flood outlook.”
- When “observations & forecasts” is selected, check the boxes next to each flood category to display or hide them on the map.
- Gauge location icons now have both observed and forecast (where available) status shown in relation to flood category; observed status is the circle, while forecast is the surrounding square.
- When “long range flood outlook” is selected, a dropdown menu allows you to choose the percent chance of exceeding river flood levels to display, from 5% to 95%. Then, use the checkboxes to select the flood categories you’d like to display.
- Hover over a point on the map to view a hydrograph for that river gauge location. The first click of a map icon brings up a robust hydrograph popup display, while a second click brings you to a full hydrograph page. Features include:
- Upstream/downstream hydrographs available in a single click.
- Listings of metadata, crest histories, local impacts, probabilistic info, and gage photos remain from AHPS.
- Separate National Water Model (NWM) display tab allows you to view NWM flow guidance over different time scales (ie. short, medium, long-range) and ensemble analysis.
- The supplemental “National Water Model Guidance” hydrograph displays the NWM model output in addition to the official hydrograph. the details about each details about NWPS and how it was developed.
- Users can also adjust the basemap in the “Map” dropdown, add administrative boundaries, and view precipitation data alongside other NWPS datasets (e.g., river stage observations and forecasts).
Access
Access the NWPS Interactive Map Viewer:
Data Downloads: