U.S. Gridded Palmer Drought Severity Index (PDSI) from gridMET
University of California, Merced
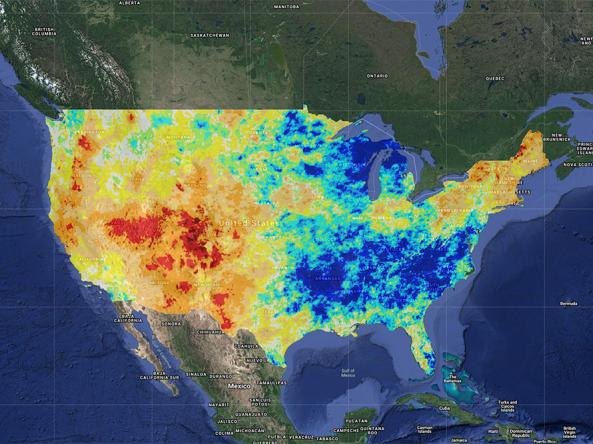
This new experimental implementation of the Palmer Drought Severity Index (PDSI) updates every 5 days using the high-resolution gridMET gridded research dataset and USDA STATSGO soils data. The PDSI is a standardized index based on a simplified soil water balance and estimates relative soil moisture conditions. The magnitude of PDSI indicates the severity of the departure from normal conditions. A PDSI value >4 represents very wet conditions, while a PDSI <-4 represents an extreme drought.
This PDSI uses a new methodology for sub-monthly PDSI, outlined in the Documentation section below.
This new experimental implementation of the Palmer Drought Severity Index (PDSI) updates every 5 days, with a delay of 4 to 5 days, using the high-resolution gridMET gridded research dataset and USDA STATSGO soils data. A PDSI value >4 represents very wet conditions, while a PDSI <-4 represents an extreme drought.
Dry Conditions (Relative)
Wet Conditions (Relative)
This new experimental implementation of the Palmer Drought Severity Index (PDSI) updates every 5 days, with a delay of 4 to 5 days, using the high-resolution gridMET gridded research dataset and USDA STATSGO soils data. A PDSI value >4 represents very wet conditions, while a PDSI <-4 represents an extreme drought.
Access
Climate Engine: View this sub-monthly PDSI with the Climate Engine tool.
THREDDS: Access this sub-monthly PDSI data with THREDDS, including service access using OPeNDAP, Web Map Service (WMS) and the NetCDF Subset tool. Data downloads are available in NetCDF for grids or CSV/XML/JSON for single grid cell subsets.
Documentation
This PDSI uses a new methodology for sub-monthly PDSI, based on the methodology outlined in Rhee, J., and G. J. Carbone. 2007. "A Comparison of Weekly Monitoring Methods of the Palmer Drought Index." Journal of Climate, 20(24): 6033-6044.
PDSI and Z are calculated using a modified version of the Palmer formula, which uses reference evapotranspiration and precipitation from gridMET, and a static soil water holding capacity layer (top 1500mm) from STATSGO. The Z-index is calculated using non-overlapping 6-pentad (30-day) blocks of precipitation and potential ET. To compute the pentad PDSI, the authors apply modifications to the standard PDSI equations similar to Rhee et al. 2007. First, the Z-index is divided by 6 given the differences between a ~30-day month and a 5-day pentad. Second, the coefficient of the drought severity equation is modified as X(i)=0.9828*X(i-1)+Z/3; and modified effective wetness/dryness accordingly to scale for differences between the timescales. The baseline period for PDSI and Z calculations is 1979-2018. Given the non-standard nature of the calculations, the pentad PDSI and Z-index are experimental.