U.S. flag

An official website of the United States government

The U.S. government is closed. This site will not be updated; however, NOAA websites and social media channels necessary to protect lives and property will be maintained. To learn more, visit commerce.gov.

For the latest forecasts and critical weather information, visit weather.gov.
DATA & MAPS

Select categories to browse data

Looking to Download Data? The Drought.gov team reformats data from multiple partners into web- and GIS-ready formats, which we use throughout Drought.gov. These data are free for all to download.
Search Results(189)

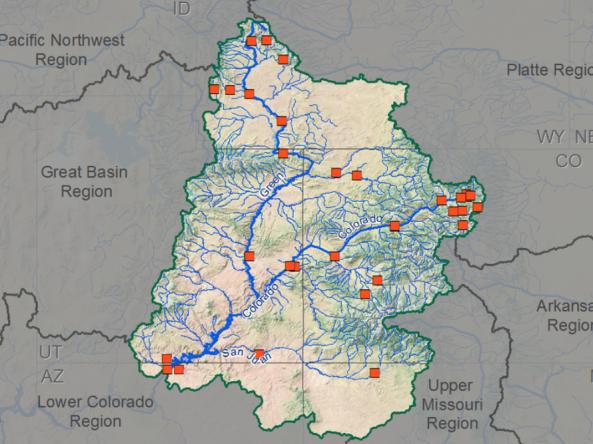
Selected research papers, reports, and other resources which show the current state-of-knowledge and the progress in our understanding of the variability of climate and hydrology in the Colorado River Basin and the potential impacts of future climate change.

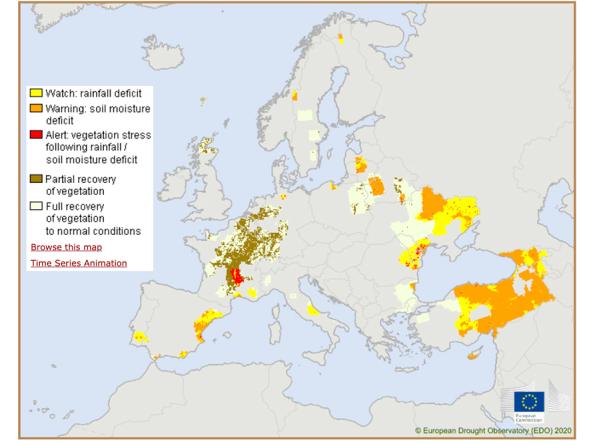
The CDI is derived by combining Standardized Precipitation Index (SPI), the Soil Moisture Anomaly (SMA), and the FAPAR Anomaly, and is used for detecting and monitoring areas that either are affected or have the potential to be affected by agricultural drought.

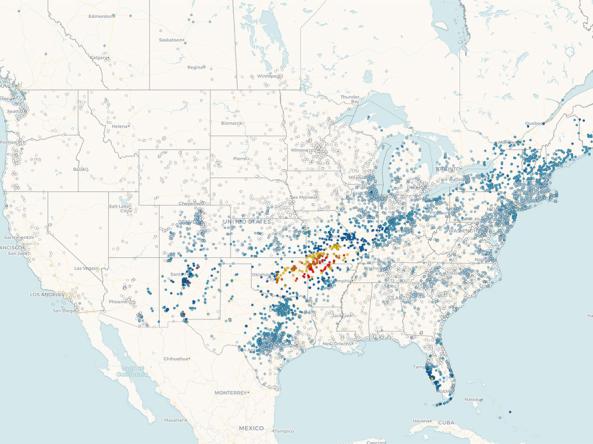
Precipitation data from CoCoRaHS: a non-profit, community-based network of volunteers of all ages and backgrounds working together to measure and map precipitation (rain, hail, and snow) across the U.S.

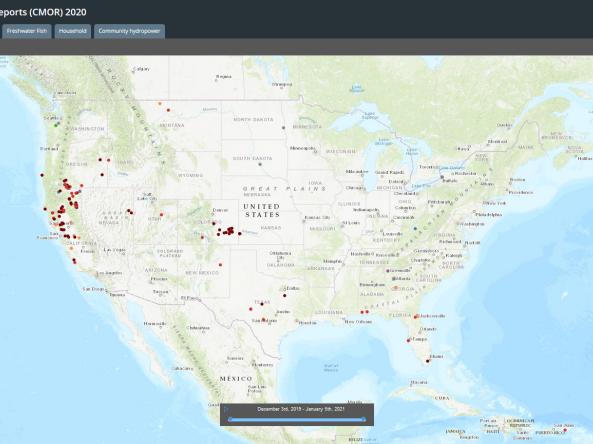
Condition Monitoring Observer Reports on Drought (CMOR-Drought) is a tool that allows citizen scientists to submit observation reports relating to drought, which are presented in a map that can be used to view and access submitted information and attachments.