Quarterly Climate Impacts and Outlook for the Great Lakes Region for March – May 2018. Dated June 2018.
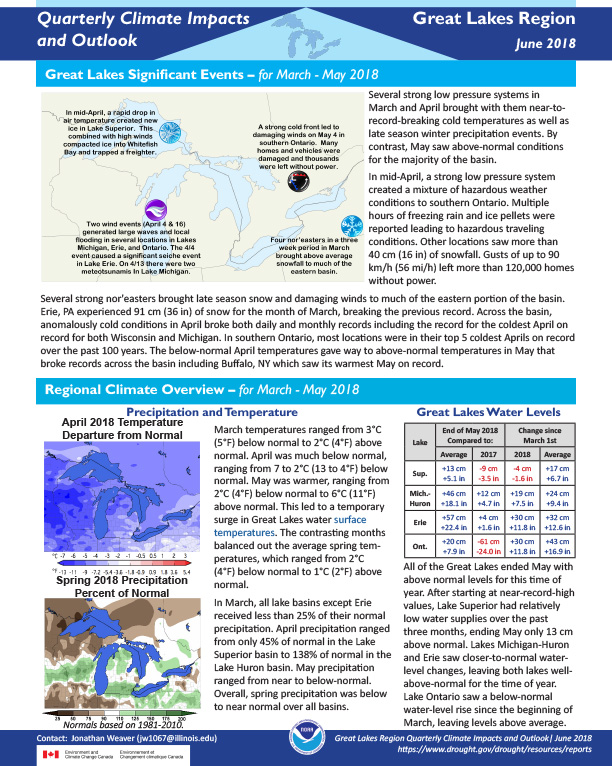
Several strong low pressure systems in March and April brought with them near-to-record-breaking cold temperatures as well as late season winter precipitation events. By contrast, May saw above-normal conditions for the majority of the basin.
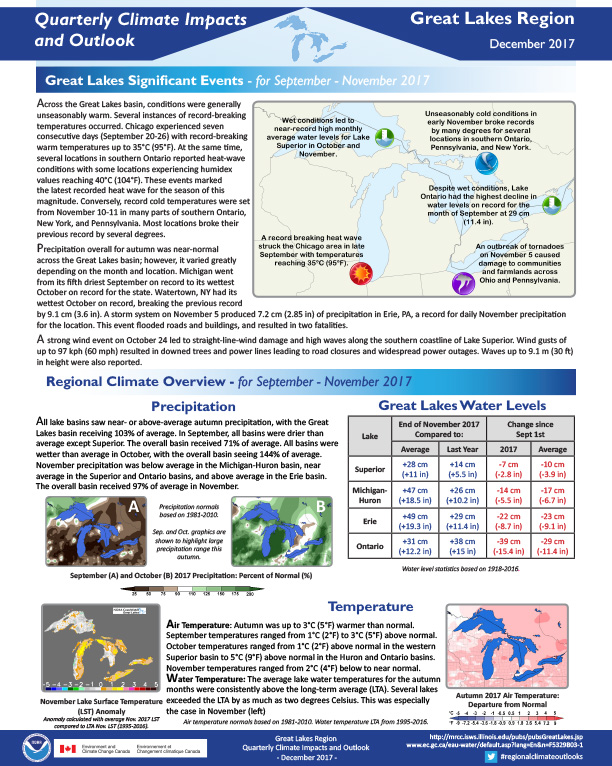
Quarterly Climate Impacts and Outlook for the Great Lakes Region for September – November 2017. Dated December 2017.
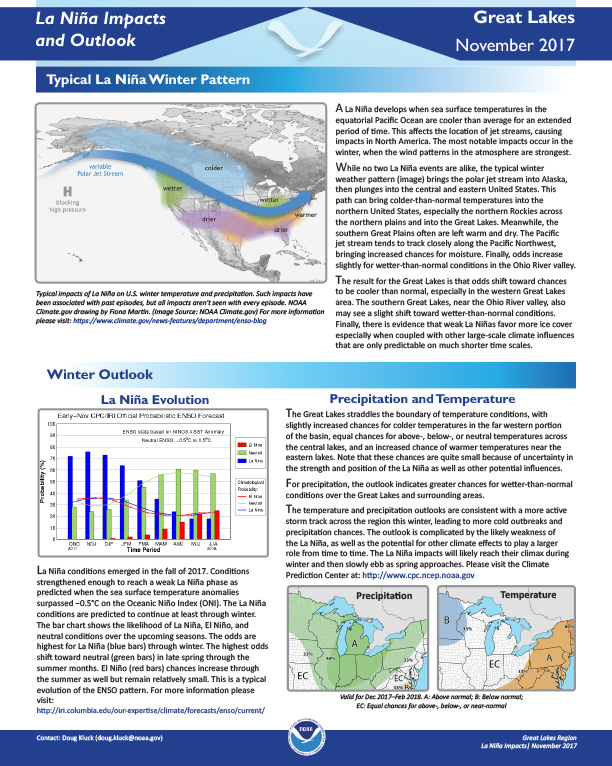
Defines La Niña; gives outlook for winter temperatures and precipitation; possible effects of La Niña on the Great Lakes region, including agriculture, the economy, water levels and lake ice.
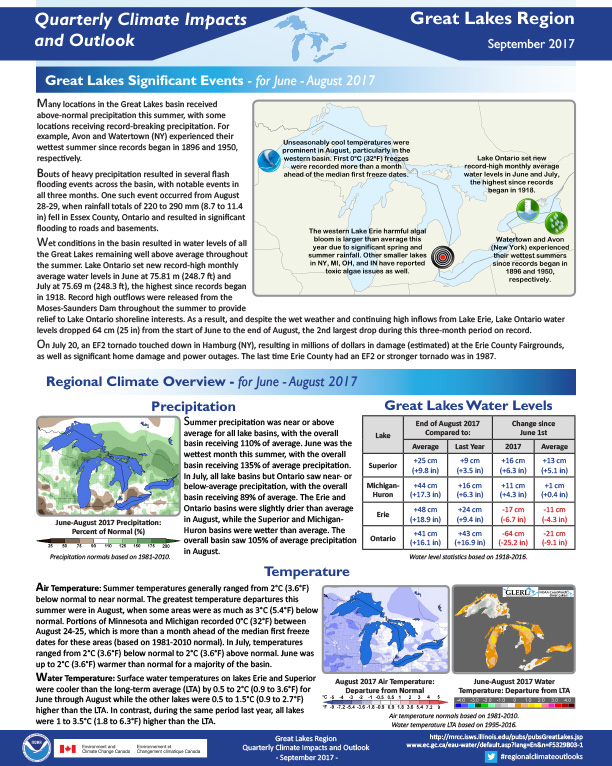
Quarterly Climate Impacts and Outlook for the Great Lakes Region for June – August 2017. Dated September 2017.
Quarterly Climate Impacts and Outlook for the Great Lakes Region for March – May 2017. Dated June 2017.
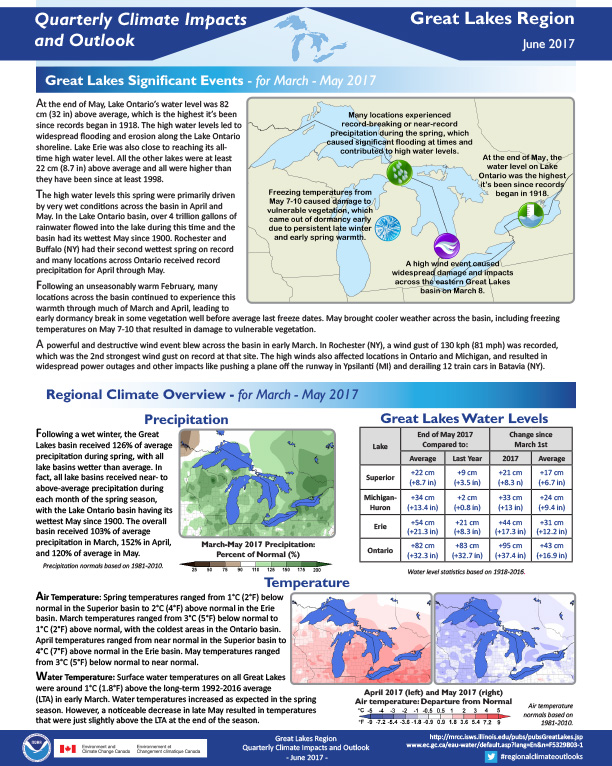
At the end of May, Lake Ontario’s water level was 82 cm (32 in) above average, which is the highest it’s been since records began in 1918. The high water levels led to widespread flooding and erosion along the Lake Ontario shoreline. Lake Erie was also close to reaching its all-time high water level. All the other lakes were at least 22 cm (8.7 in) above average and all were higher than they have been since at least 1998.
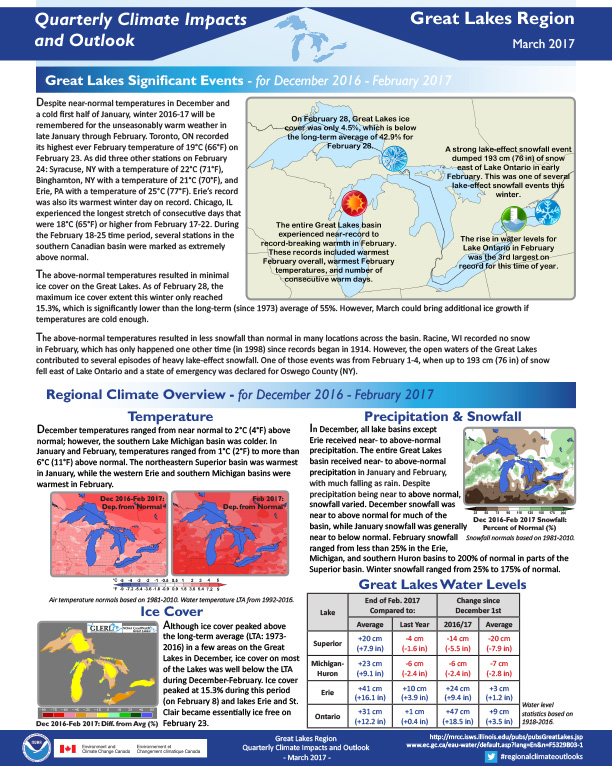
Quarterly Climate Impacts and Outlook for the Great Lakes Region for December 2016 – February 2017. Dated March 2017.
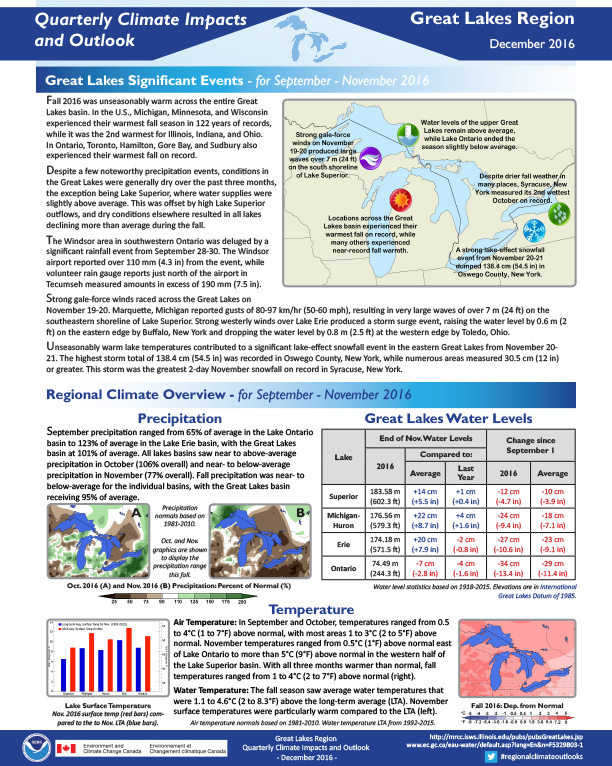
Quarterly Climate Impacts and Outlook for the Great Lakes Region for September – November 2016. Dated December 2016.
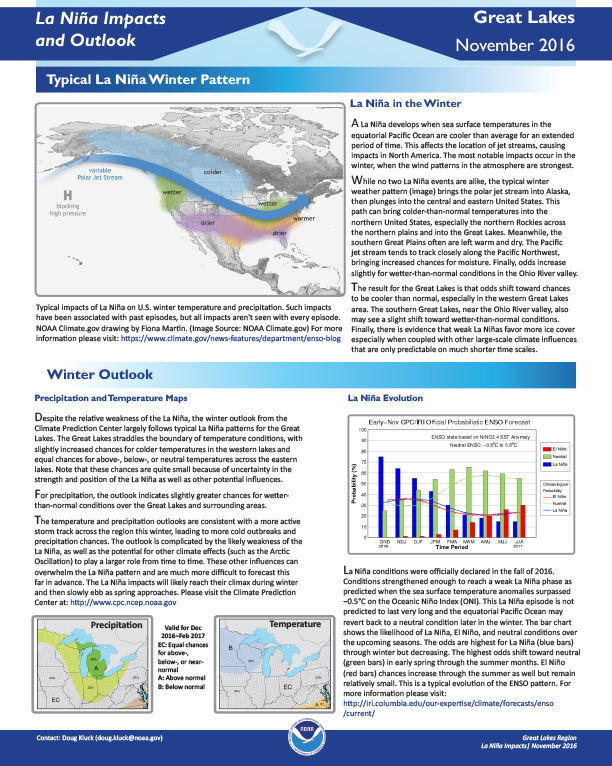
Defines La Niña; gives outlook for winter temperatures and precipitation; possible effects of La Niña on the Great Lakes region, including agriculture, the economy, water levels and lake ice.
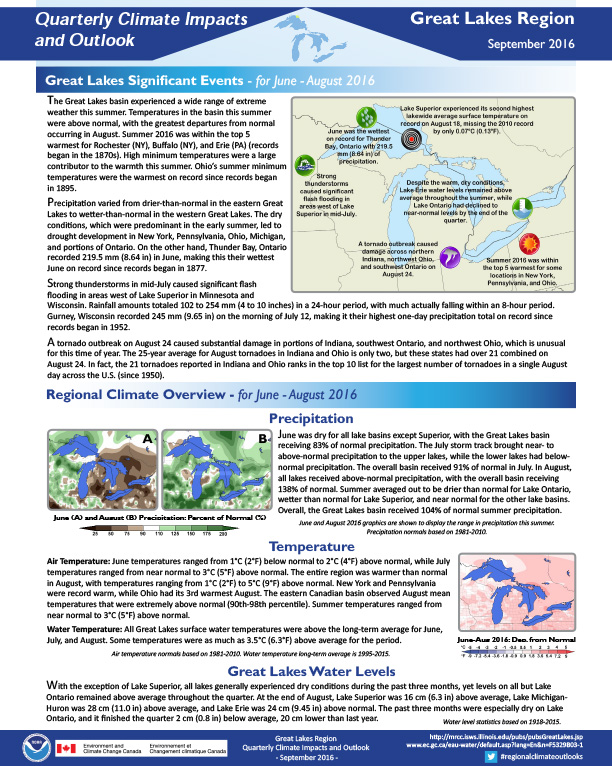
Quarterly Climate Impacts and Outlook for the Great Lakes Region for June – August 2016. Dated September 2016.
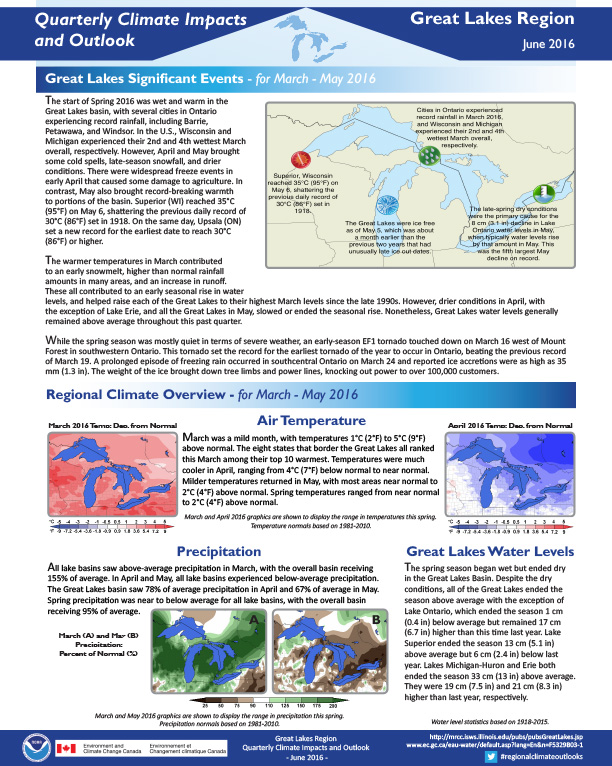
Quarterly Climate impacts and Outlook for the Great Lakes Region for March – May 2016. Dated June 2016.