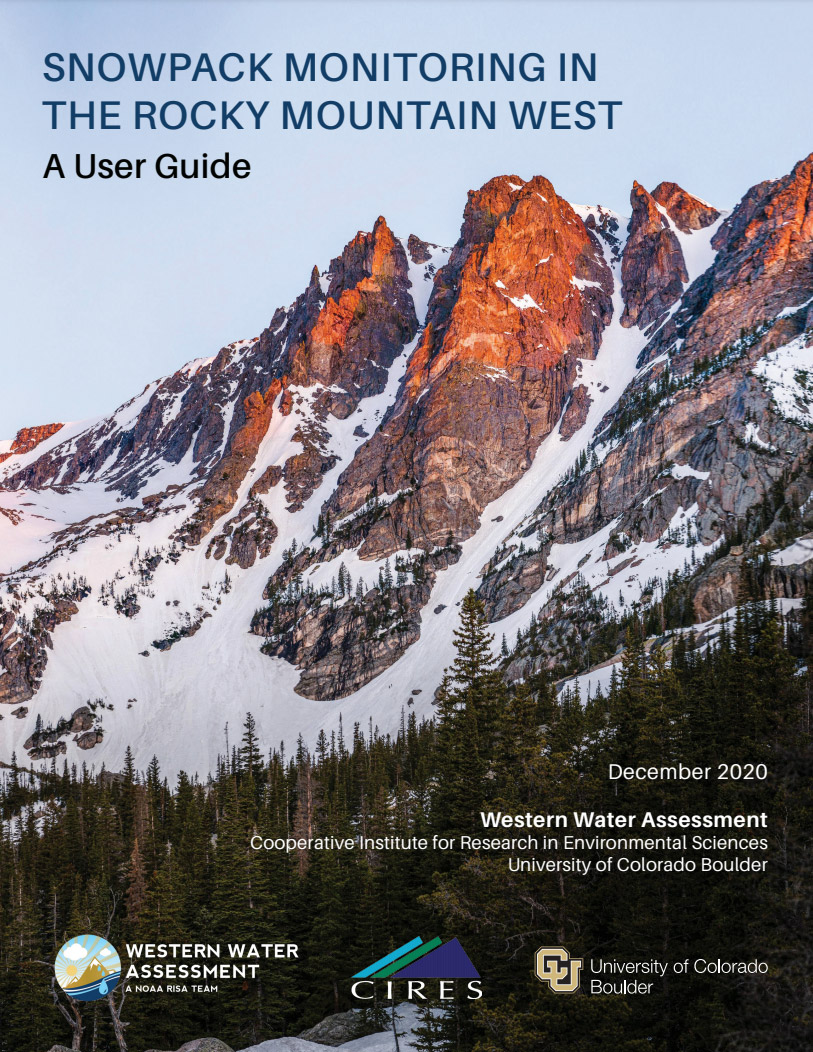
In the Rocky Mountain West, monitoring the evolution of the snowpack over the course of the winter and spring is critical to forecasting streamflow and managing water supply as well as fisheries management and guided rafting.
The PNW DEWS Strategic Plan outlines priority tasks and activities to build drought early warning capacity and resilience. Partners from across the PNW met in Portland, OR in October 2019 to discuss progress made since the 2017-2018 strategic plan and next steps. Discussions acknowledged the progress made to better communicate and collaborate in preparing for and responding to drought, and led participants to ask how the DEWS might further facilitate not only information delivery but also action to reduce the impacts of drought.
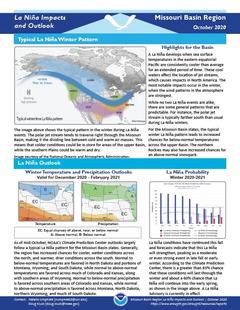
Provides information on the typical La Niña winter pattern; the La Niña outlook; potential winter and spring impacts; and comparisons of conditions during previous La Niña years.
NOAA’s Regional Climate Services Program created these outlooks to inform the public about climate impacts within their respective regions. Each regional report contains easy-to-understand language, and anyone can access them through the Drought Portal.
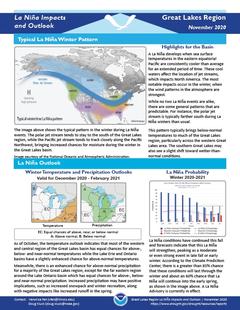
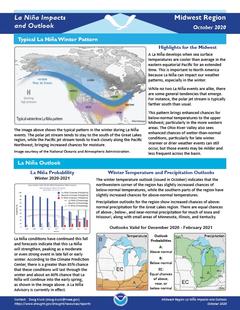
Provides information on the typical La Niña winter pattern; the La Niña outlook; potential winter and spring impacts; and comparisons of conditions during previous La Niña years.
NOAA’s Regional Climate Services Program created these Outlooks to inform the public about climate impacts within their respective regions. Each regional report contains easy-to-understand language, and anyone can access them through the Drought Portal.
In order to ensure the inclusion of indigenous perspectives in the implementation of our DEWS, NIDIS launched a Tribal Drought Engagement initiative in January 2019 in collaboration with the Masters of the Environment Program at University of Colorado-Boulder. The project aimed to strengthen relationships with tribal resource managers across the Missouri River Basin and Midwest DEWS regions in order to effectively deliver timely and relevant drought information.
Provides information on the typical La Niña winter pattern; the La Niña outlook; potential impacts; and comparisons of conditions during previous La Niña years.
NOAA’s Regional Climate Services Program created these outlooks to inform the public about climate impacts within their respective regions. Each regional report contains easy-to-understand language, and anyone can access them through the Drought Portal.
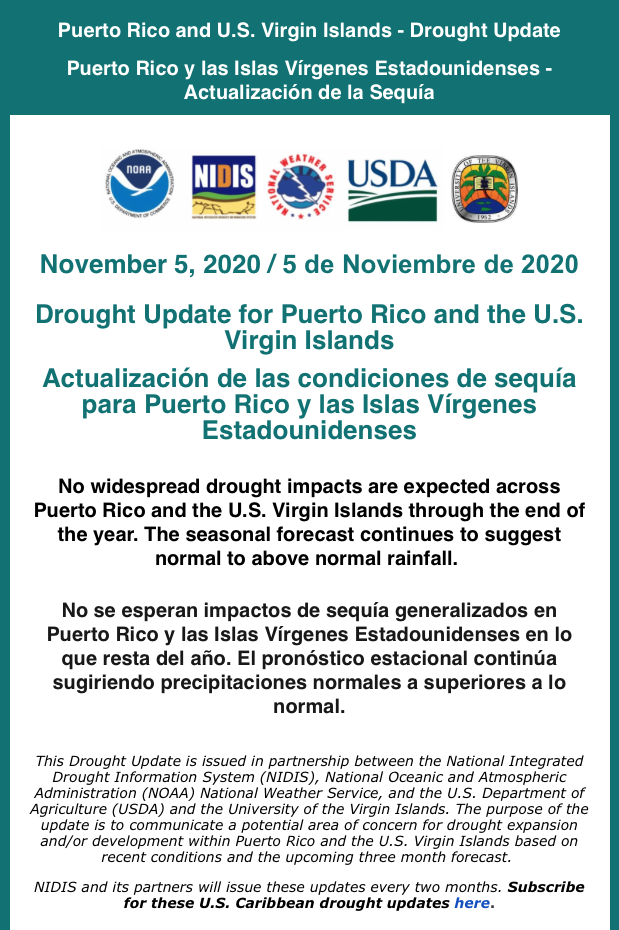
No widespread drought impacts are expected across Puerto Rico and the U.S. Virgin Islands through the end of the year. The seasonal forecast continues to suggest normal to above normal rainfall.
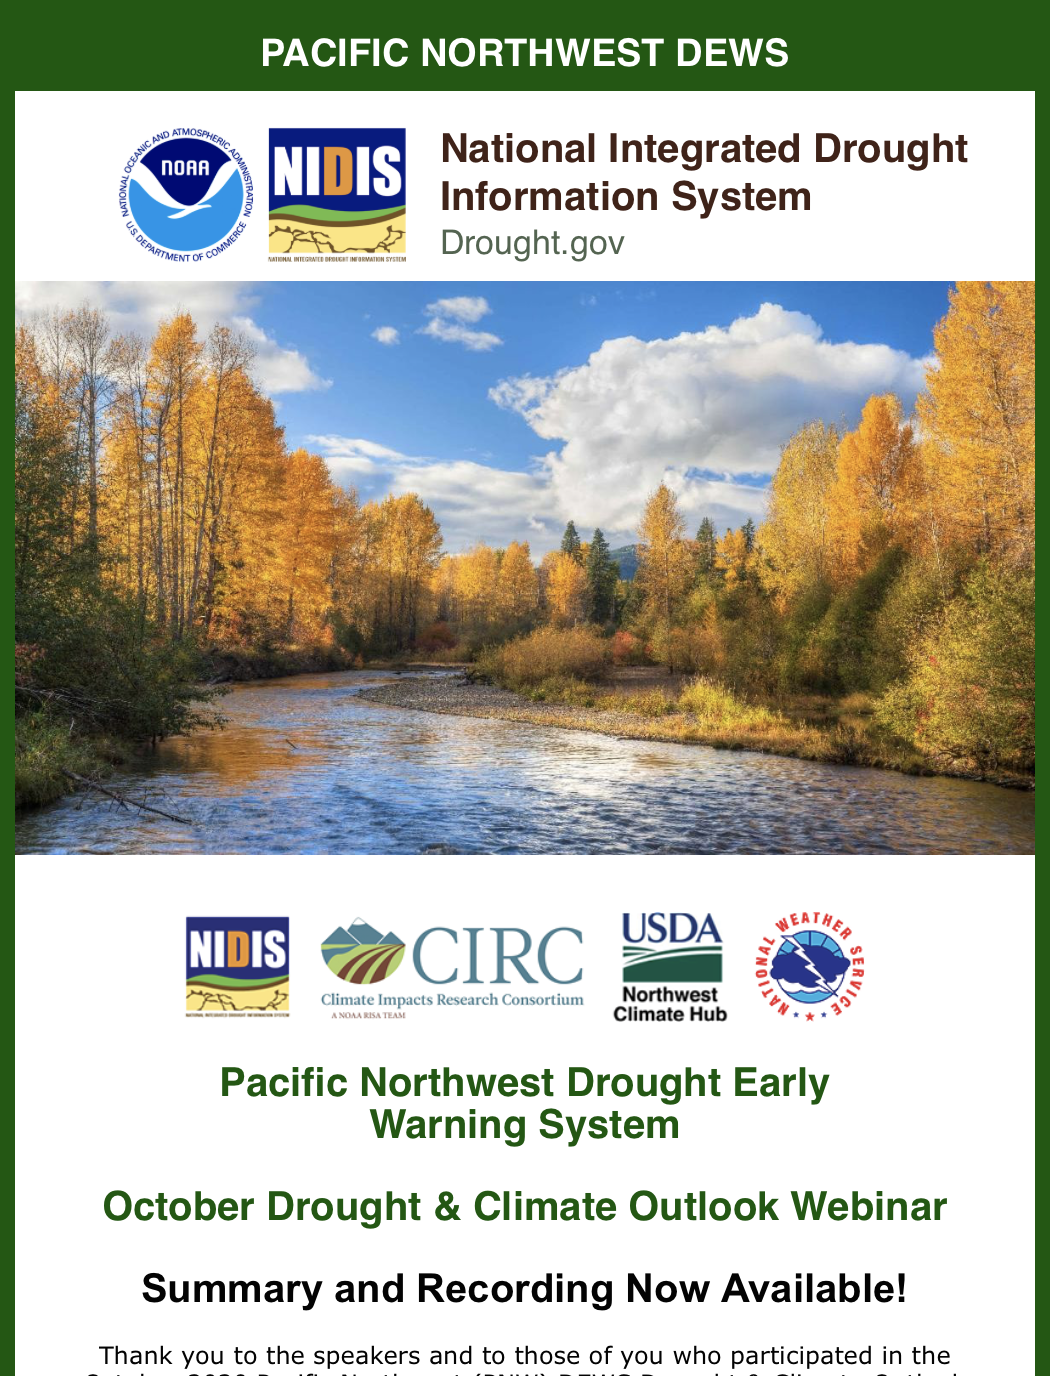
This drought and climate outlook was originally sent via email to the Pacific Northwest DEWS email list.
Climate Recap and Current ConditionsNicholas Bond, Office of the Washington State Climatologist
This drought early warning update was originally sent via email to the Northeast DEWS email list.
This water year recap and drought & climate webinar summary was originally sent via email to the California-Nevada DEWS email list.