Quarterly Climate Impacts and Outlook for the Southern Region for June–August 2025. Dated September 2025.
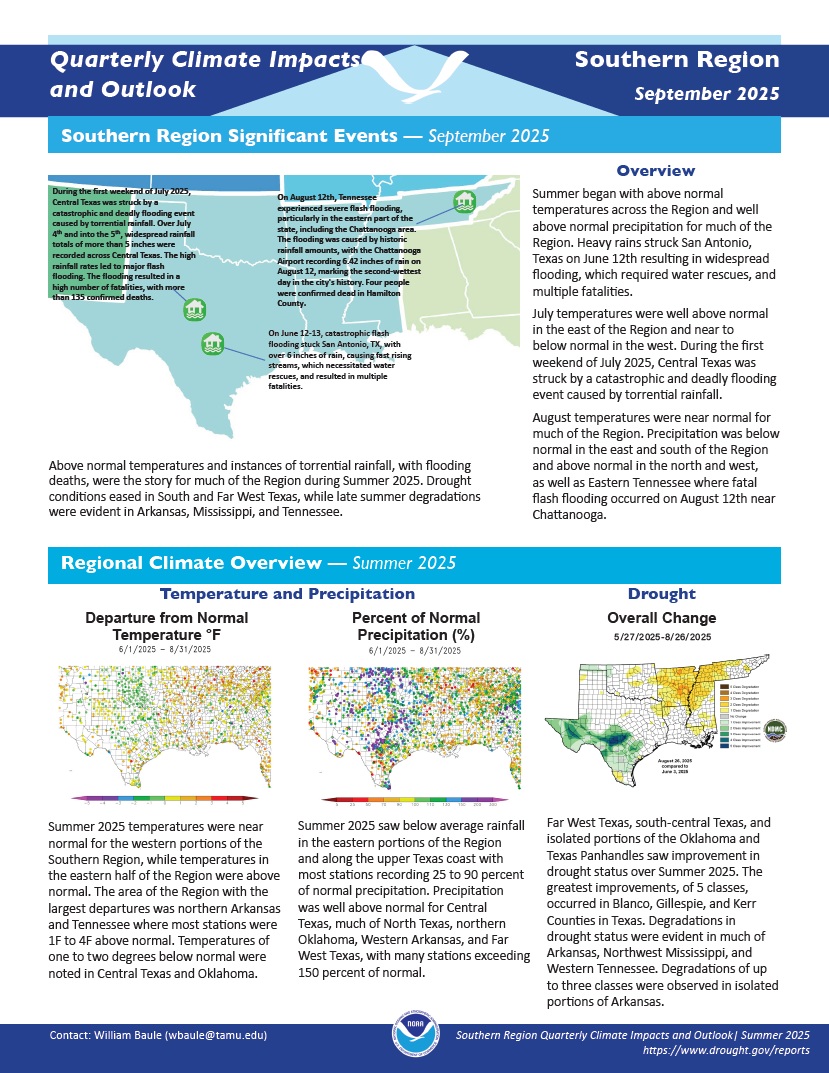
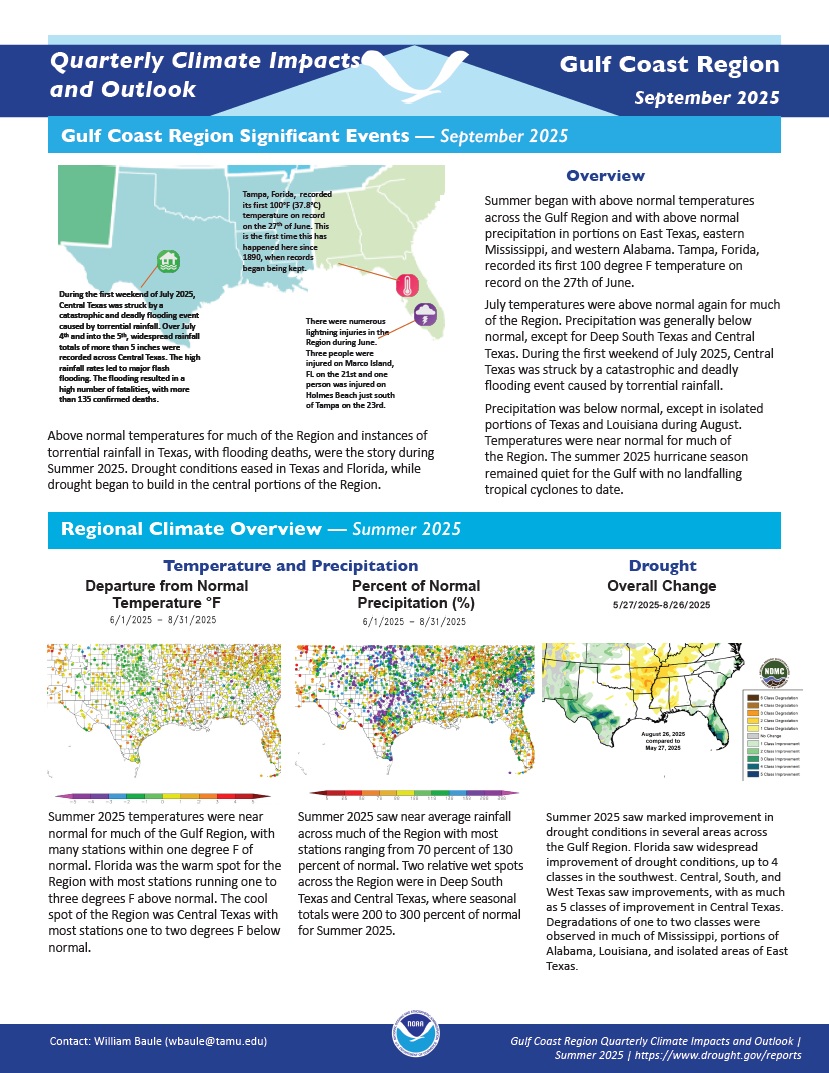
Summer 2025 temperatures were near normal for the western portions of the Southern Region, while temperatures in the eastern half of the Region were above normal. Summer 2025 saw below average rainfall in the eastern portions of the Region and along the upper Texas coast. Precipitation was well above normal for Central Texas, much of North Texas, northern Oklahoma, Western Arkansas, and Far West Texas.
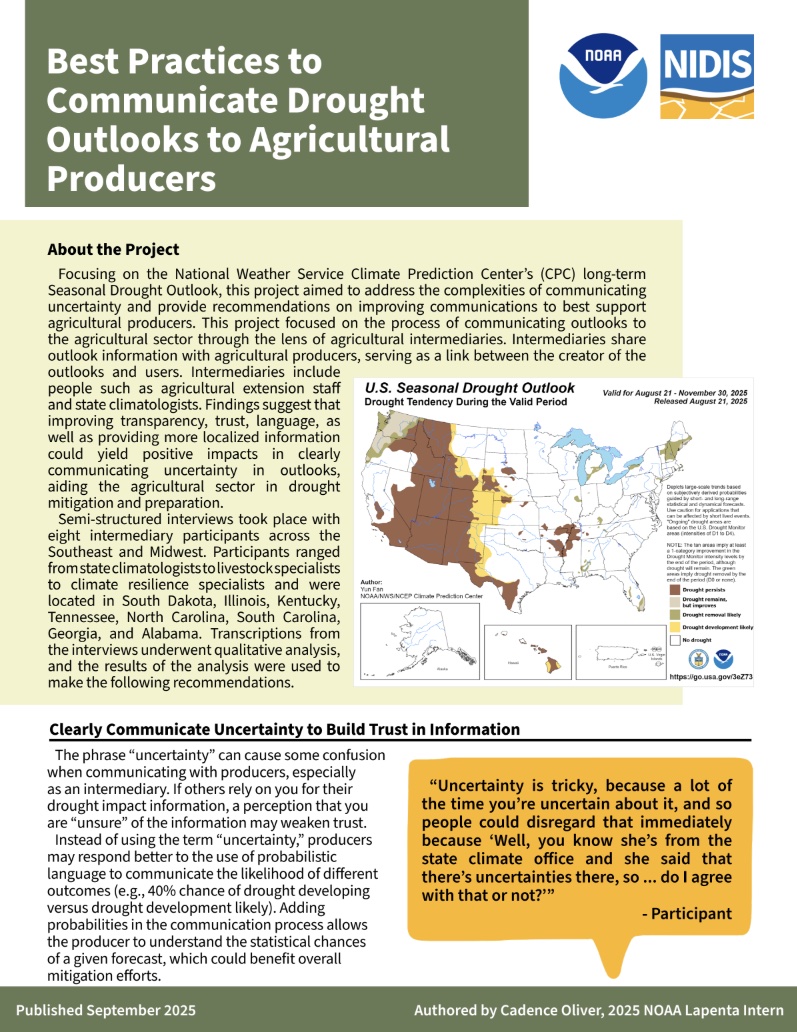
Focusing on the National Weather Service Climate Prediction Center’s (CPC) long-term Seasonal Drought Outlook, this William M. Lapenta NOAA student internship project aimed to address the complexities of communicating uncertainty and provide recommendations on improving communications to best support agricultural producers. This project focused on the process of communicating outlooks to the agricultural sector through the lens of agricultural intermediaries, such as agricultural extension staff and state climatologists.
NOAA’s National Integrated Drought Information System (NIDIS) and Physical Sciences Laboratory are partnering with the California State Climatologist/California Department of Water Resources, NOAA’s National Weather Service and National Centers for Environmental Information, and the California-Nevada Adaptation Program (a NOAA CAP team) on the Sector-Specific Drought Early Warning Outlook – Southern California Pilot.
Quarterly Climate Impacts and Outlook for the Canadian and U.S. Prairies and High Plains for June–August 2025, with an outlook for October–December 2025. Dated September 2025.
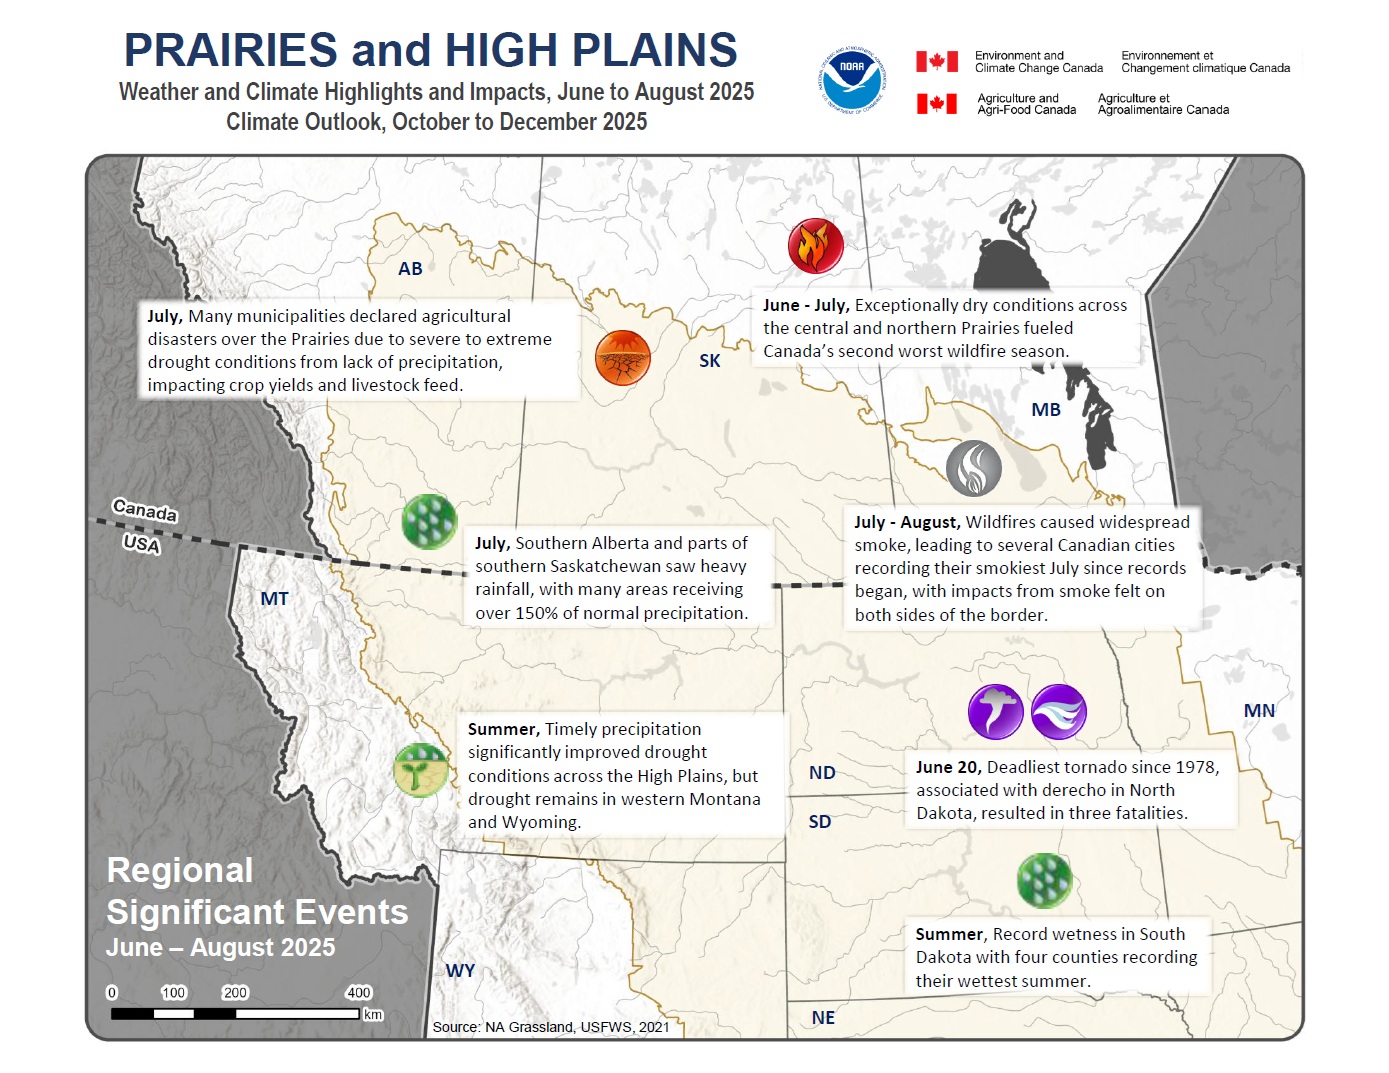
Summer brought mostly near normal temperatures across the Prairies and High Plains, with a small pocket of cooler conditions in the southern parts of North Dakota and slightly warmer along the southeastern High Plains. The Prairies and High Plains saw varied precipitation over the region, with some areas observing much wetter than normal conditions, while others remain near normal or very dry.
Quarterly Climate Impacts and Outlook for the Gulf Coast Region for June–August 2025. Dated September 2025.
Summer 2025 temperatures were near normal for much of the Gulf Region, with many stations within one degree F of normal. Summer 2025 saw near average rainfall across much of the Region with most stations ranging from 70 percent of 130 percent of normal.
Quarterly Climate Impacts and Outlook for the Western Region for June–August 2025. Dated September 2025.
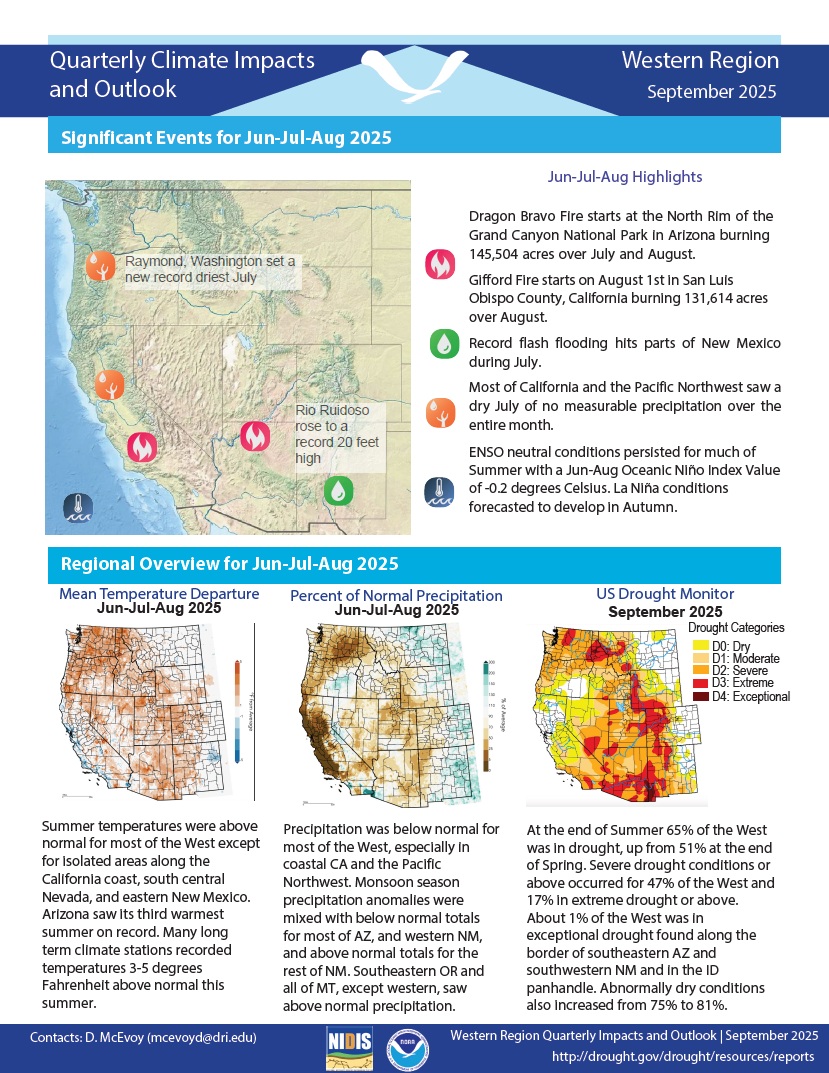
Summer temperatures were above normal for most of the West except for isolated areas along the California coast, south central Nevada, and eastern New Mexico. Precipitation was below normal for most of the West, especially in coastal California and the Pacific Northwest. Monsoon season precipitation anomalies were mixed with below-normal totals for most of Arizona and western New Mexico, and above-normal totals for the rest of New Mexico.
Quarterly Climate Impacts and Outlook for the Missouri River Basin for June–August 2025. Dated September 2025.
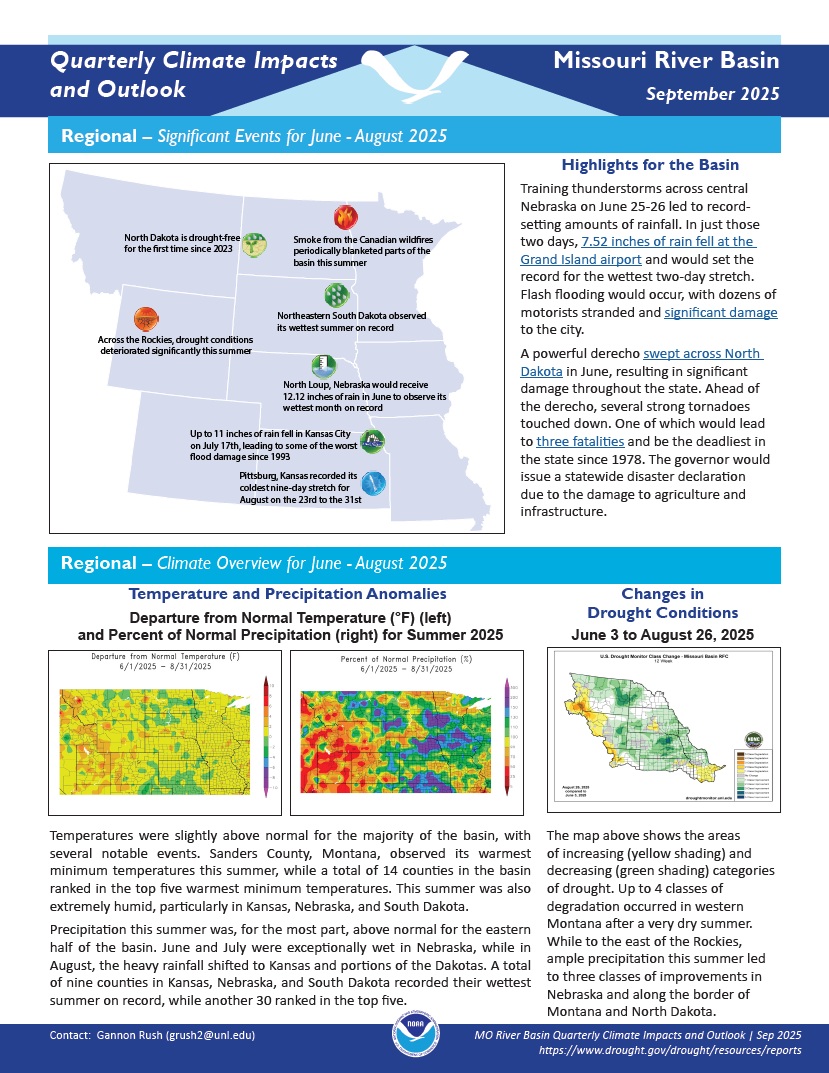
Temperatures were slightly above normal for the majority of the basin. This summer was also extremely humid, particularly in Kansas, Nebraska, and South Dakota. Precipitation this summer was, for the most part, above normal for the eastern half of the basin. A total of nine counties in Kansas, Nebraska, and South Dakota recorded their wettest summer on record, while another thirty ranked in the top five.
Drought has occurred frequently in the Mid-Atlantic states over the past century. Major droughts occurred in the 1930s, 1940s, 1960s, and 1980s, with several lasting for more than a year. In 2024, heat and a lack of rainfall led to widespread drought across Delaware, Maryland, New Jersey, Pennsylvania, Virginia, West Virginia, and the District of Columbia. For some locations, the 2024 drought was the worst the region had experienced in more than two decades.
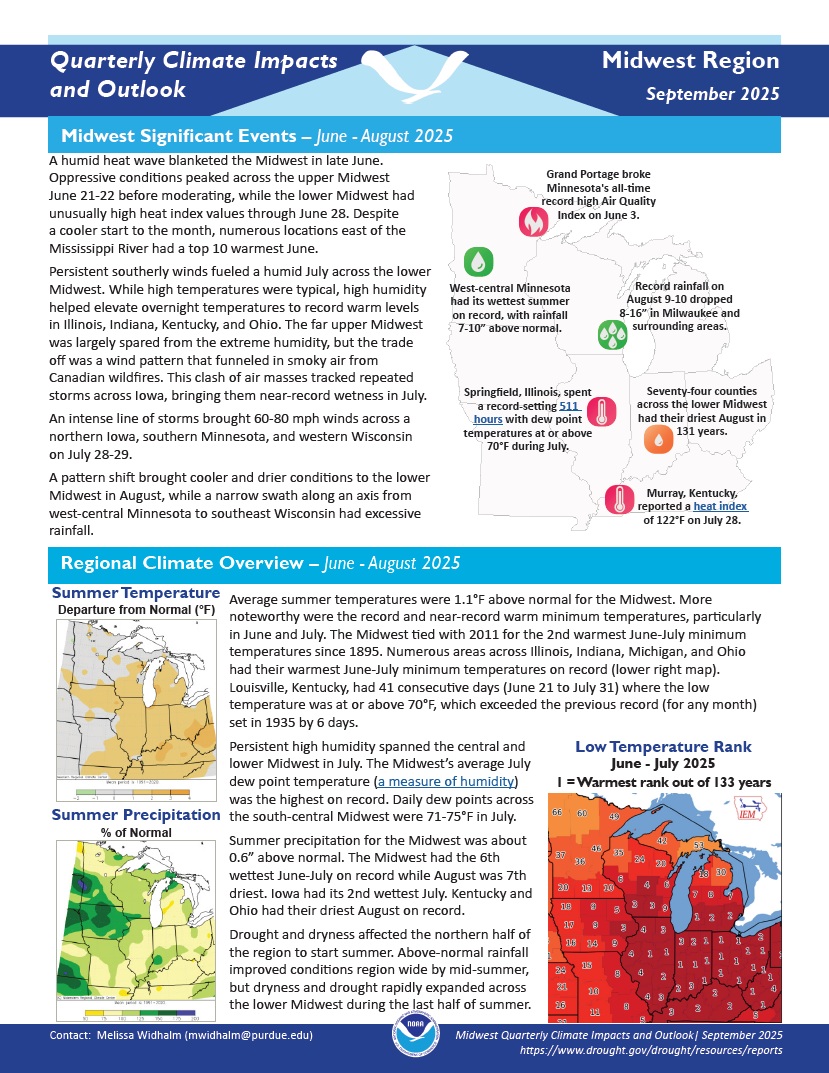
Quarterly Climate Impacts and Outlook for the Midwest Region for June–August 2025. Dated September 2025.
Average summer temperatures were 1.1°F above normal for the Midwest. More noteworthy were the record and near-record warm minimum temperatures, particularly in June and July. Drought and dryness affected the northern half of the region to start summer. Above-normal rainfall improved conditions region-wide by mid-summer, but dryness and drought rapidly expanded across the lower Midwest during the last half of summer.
Quarterly Climate Impacts and Outlook for the Southeast and Caribbean Region for June–August 2025. Dated September 2025. (Updated to add Spanish translation of Caribbean information.)