Improving Understandability, Interpretation, and Use of the National Weather Service’s U.S. Drought Outlooks
NOAA National Weather Service’s Climate Prediction Center (CPC) releases drought and other hazard outlooks for a range of stakeholders to aid in their situational awareness, operations, planning, and decision-making. The goal of this project is to use social science methods and analysis to make the U.S. drought outlooks easier for users to understand and interpret accurately.
Led by social scientist Melissa Kenney (University of Minnesota), the research team will conduct user research to provide NOAA actionable, evidence-based, recommendations to improve the understandability and usability of U.S. drought outlooks. The team will use social science methods, such as diagnosing visualization problems, evaluating trade-offs of different design modifications, and testing existing and modified graphics.
Specifically, this research team will:
- Identify major understandability challenges for the current deterministic and new probabilistic U.S. drought outlook graphics. (Deterministic outlooks provide a single, direct forecast of future drought conditions—such as whether conditions will improve, persist, or worsen—based on expert forecaster assessment. Probabilistic outlooks would present a range of statistical probabilities.
- Engage with users and producers of the outlooks to understand the goals for the outlooks, primary and secondary audiences, and user needs.
- Develop recommendations and apply them to improve the understandability and potential utility of the current deterministic and new probabilistic U.S. drought outlook graphics.
This work is part of a broader NIDIS-supported research effort to improve NOAA National Weather Service drought outlooks. For more information, please contact Amanda Sheffield (amanda.sheffield@noaa.gov).
Research Snapshot
Melissa A. Kenney, University of Minnesota; Jon Gottschalck, NOAA National Weather Service
What to expect from this research
In close collaboration with the National Weather Service and NIDIS, the research team provided recommendations for redesigned map graphics for the U.S. deterministic drought outlooks. In a study of more than 800 participants, users were significantly more likely to understand that the outlooks show expected changes in drought conditions, not drought intensity.
On October 15, 2026, the National Weather Service transitioned updated monthly and seasonal U.S. drought outlooks into operations. This fact sheet provides an overview of the changes.
Ongoing work will evaluate user-centered approaches to visual communication of new probabilistic drought outlooks, supporting impact-based decision-making. The research team will:
- Engage with drought planning communities and regional stakeholders to co-design probabilistic drought forecast data products.
- Co-design testable prototypes of probabilistic drought outlook graphics.
- Empirically test the effectiveness of probabilistic drought outlook visualizations.
- Synthesize and share results with NIDIS, the National Weather Service, drought community partners, and regional stakeholders.
- Share actionable recommendations for developing operationally feasible and effective probabilistic drought decision support and communication products.
Related Data & Maps
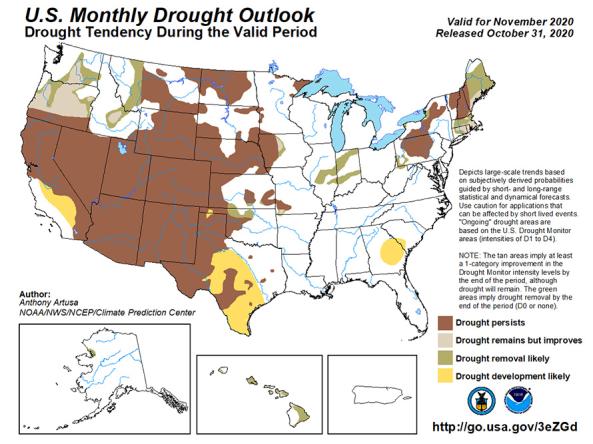
The U.S. Monthly Drought Outlook predicts whether drought will emerge, stay the same or get better over the next 30 days or so.
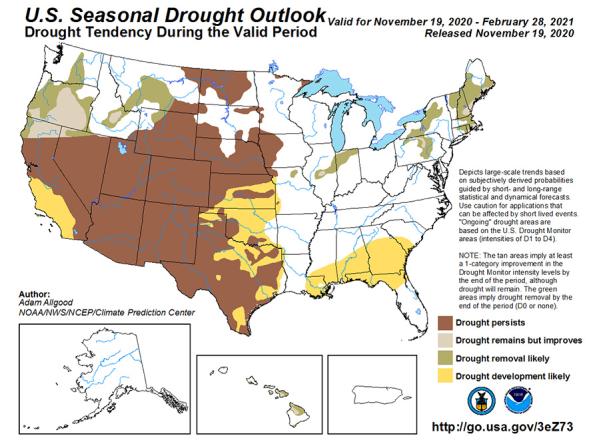
The U.S. Seasonal Drought Outlook depicts large-scale trends based on subjectively derived probabilities guided by short- and long-range statistical and dynamical forecasts.