2019 in Review: A Look Back at Drought across the United States in 10 Maps
2019 USDM Weekly Maps
This animation displays the weekly drought maps published by the US Drought Monitor (USDM) during 2019.
2019 Most Intense Drought
This map displays the most intense weekly USDM classification for locations across the United States, regardless of when the designation occurred.
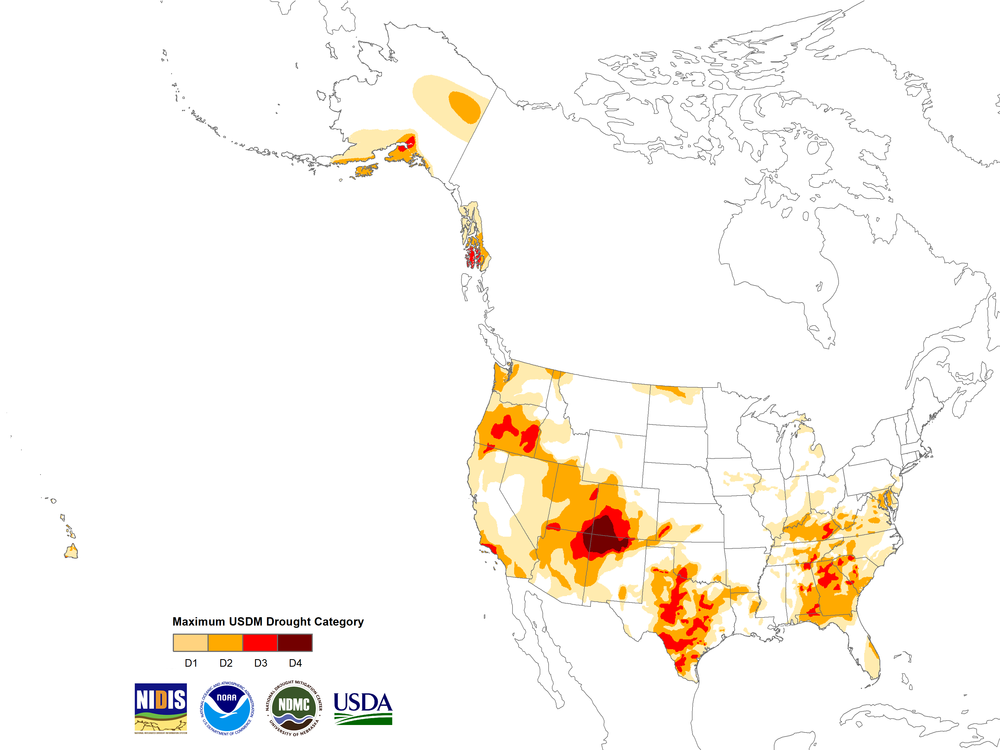
Fig 2. Map displays the maximum weekly U.S. Drought Monitor category reached during 2019
2019 Weeks in Drought
This map shows the number of weeks, throughout the year, a location experienced drought, defined as USDM category “D1 – Moderate Drought” or greater, across the United States.
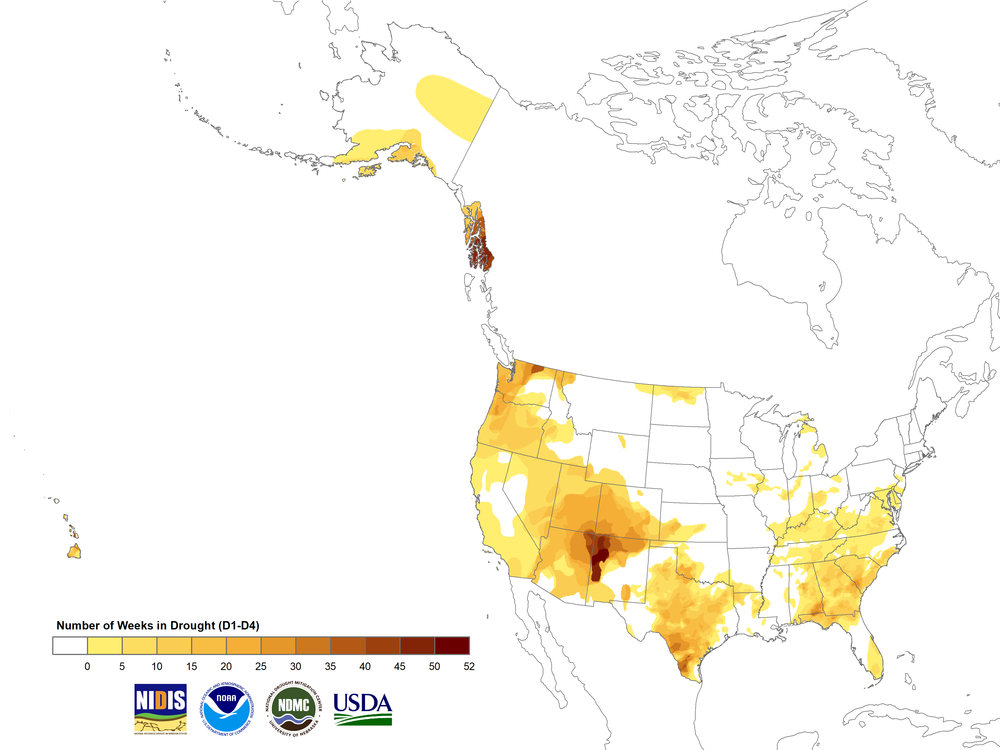
Fig 3. Map displays the number of weeks during 2019 the U.S. experienced USDM Category D1 or greater
2019 Cumulative Drought Index
This map combines the intensity and duration of drought, tabulated over the course of the year. It is calculated by multiplying the USDM category (D1=1, D2=2, D3=3, & D4=4) by the number of weeks designated in that category. For example, a location in D2 drought for 20 weeks and D1 drought for 5 weeks equals a cumulative intensity of 45 (20x2 plus 5x1). The maximum value possible is 208 (52x4).
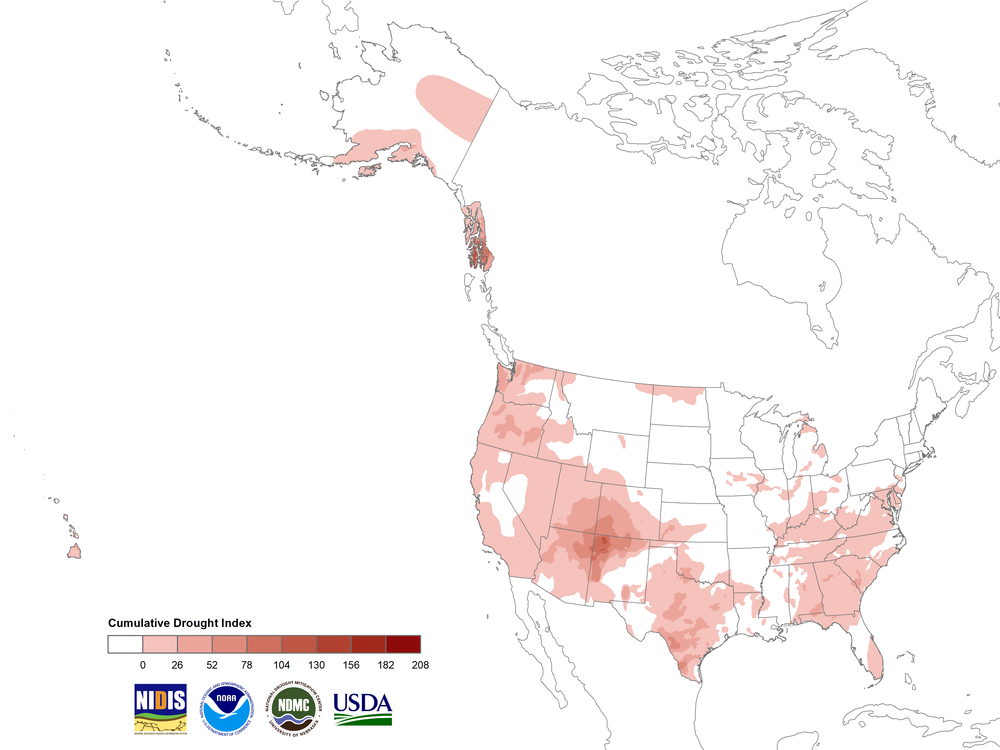
Fig 4. Map displays the cumulative drought intensity, a combination of drought intensity and duration, during 2019
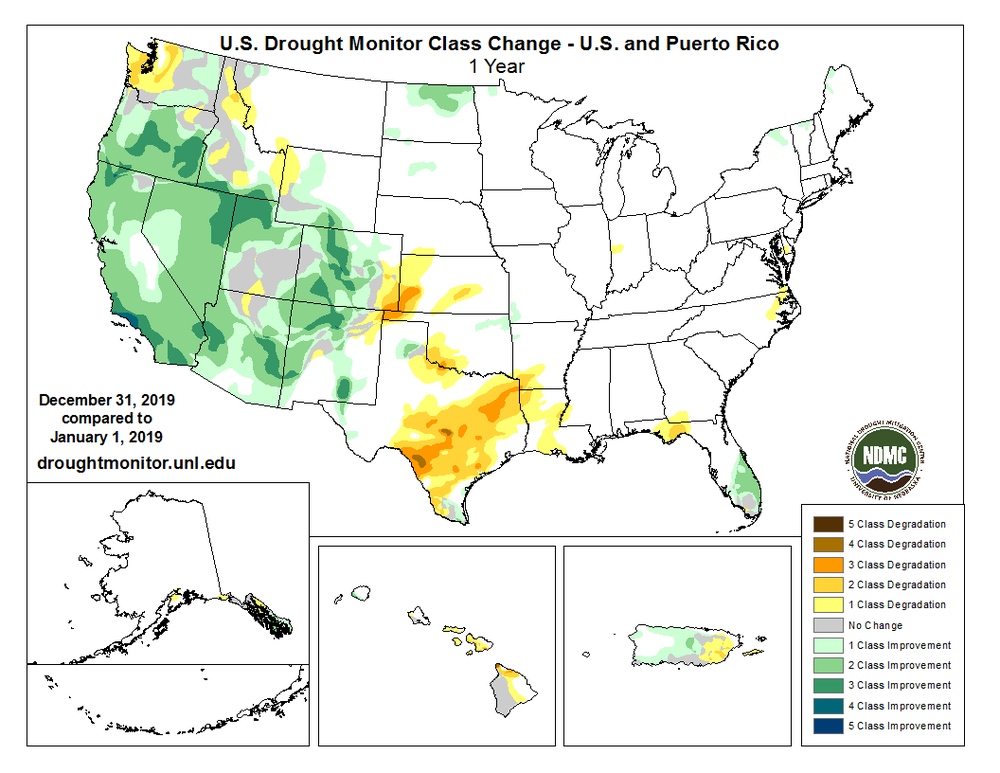
2019 USDM 1 Year Change Map
This map displays 1 Year USDM Category Change for 2019.The map compares December 31, 2019 to January 1, 2019.
2019 USDA Drought Designated Counties Map
This map displays the designated drought counties by USDA for 2019.
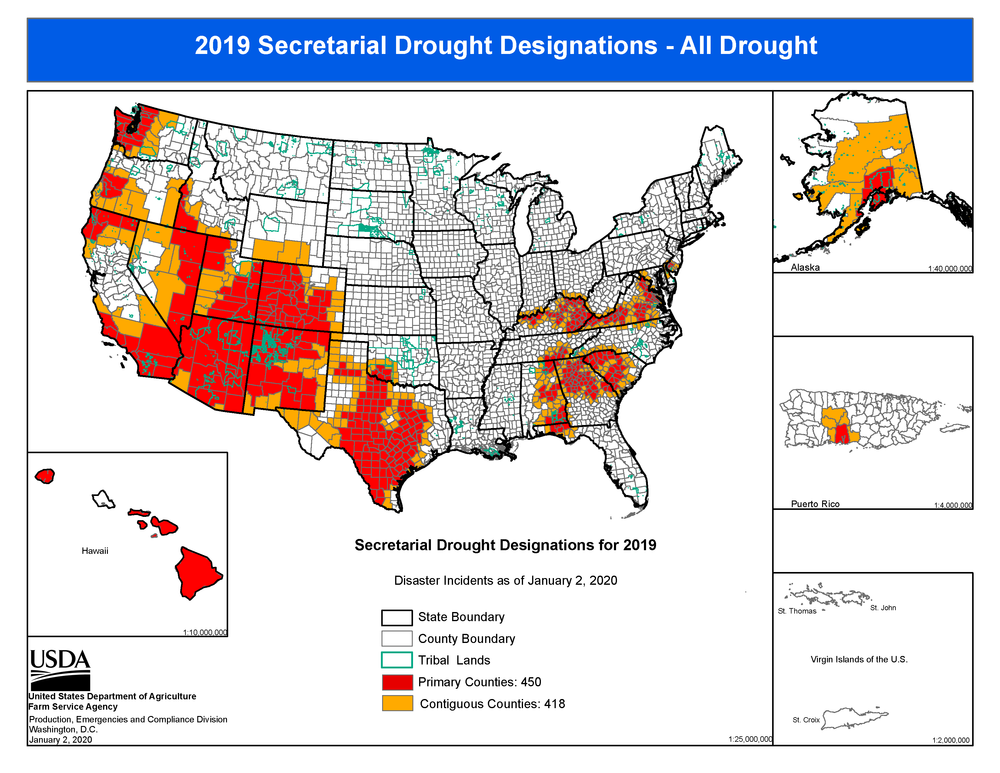
Fig 6. Map displays the USDA Drought Designated counties for 2019
12-Month SPI Map
This map displays the 12-Month Standardized Precipitation Index values from January 1, 2019 to December 31, 2019 for the contiguous United States. Map was generated at the High Plain Regional Climate Center (HPRCC).
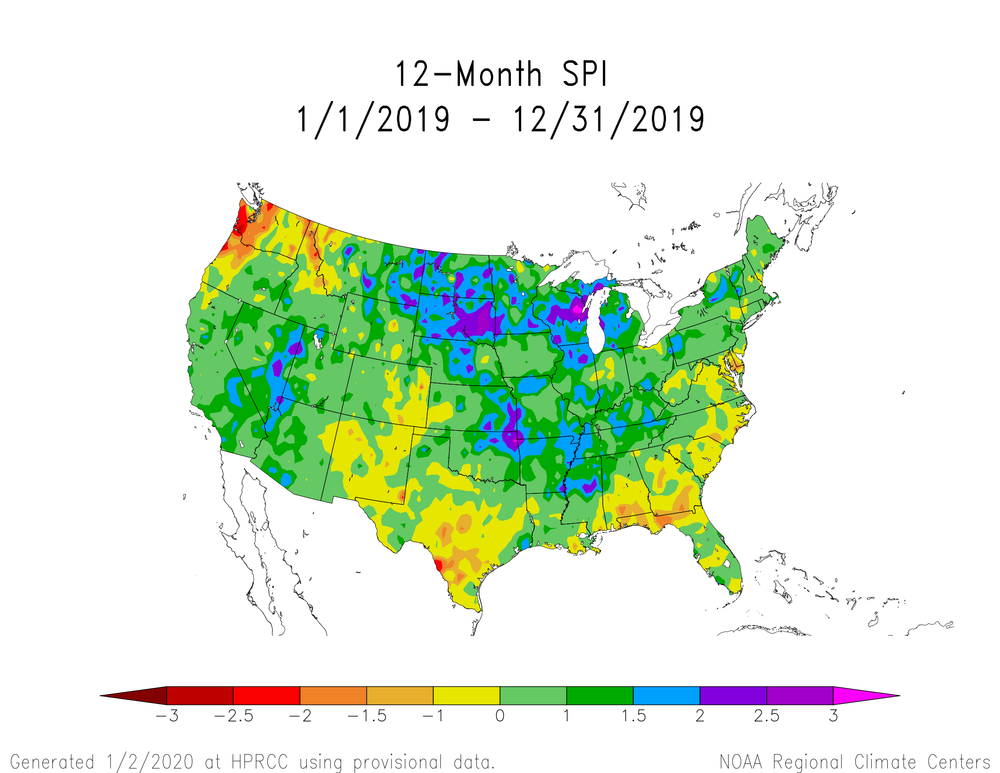
Fig 7. Map displays the 12-Month SPI values for 2019
Annual Departure from Normal Precipitation Map
This map displays the annual departure from normal precipitation for the United States. Map was generated at the National Weather Service (NWS) Advanced Hydrological Prediction Service (AHPS).
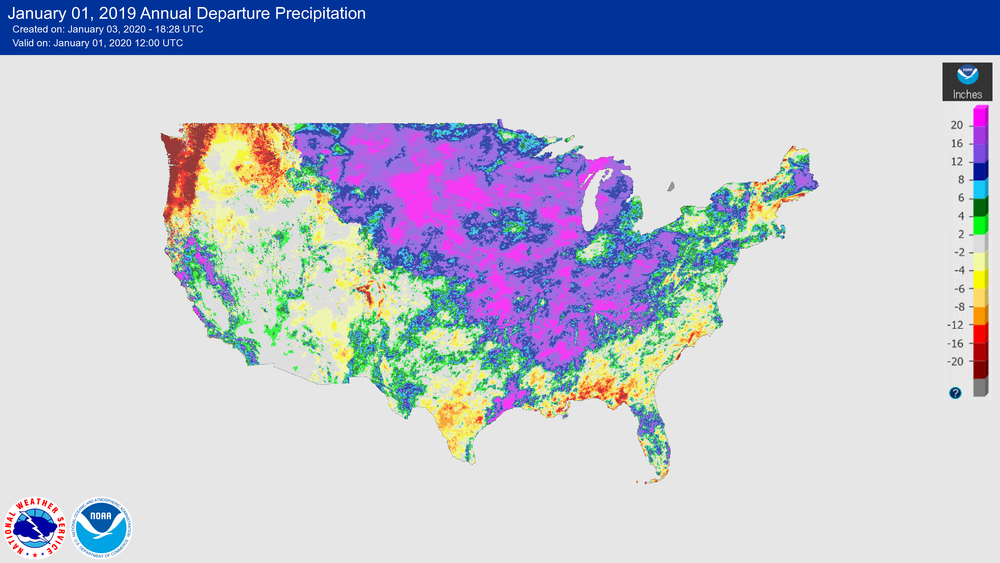
Fig 8. Map displays the annual precipitation departures for 2019
2019 Palmer Drought Severity Index, January - November 2019
This animation displays the monthly Palmer Drought Severity Index from January - November 2019, published by NOAA's National Centers for Environmental Information.
Fig 9. Map displays Palmer Drought Severity Index from January - November 2019
2019 Soil Moisture Anomaly Monthly Maps
This animation displays the monthly soil moisture anomaly published by the National Weather Service Climate Prediction Center (CPC) during 2019.
Fig 10. Map displays the annual precipitation departures for 2019