The El Niño-Southern Oscillation and Drought Outlook in the United States
The El Niño-Southern Oscillation (ENSO) is a recurring phenomenon defined by shifts in tropical Pacific Ocean sea surface temperatures, ocean currents, and overlying atmospheric winds. It manifests in three distinct phases: neutral, La Niña, and El Niño. In the contiguous United States, La Niña generally leads to below-average precipitation and above-average temperatures in the Southern U.S. and the opposite in the Northern U.S. during cool seasons. Conversely, El Niño typically causes above-average precipitation and below-average temperatures in the Southern U.S. and below-average precipitation and above-average temperatures in the Northern U.S. during these same seasons.
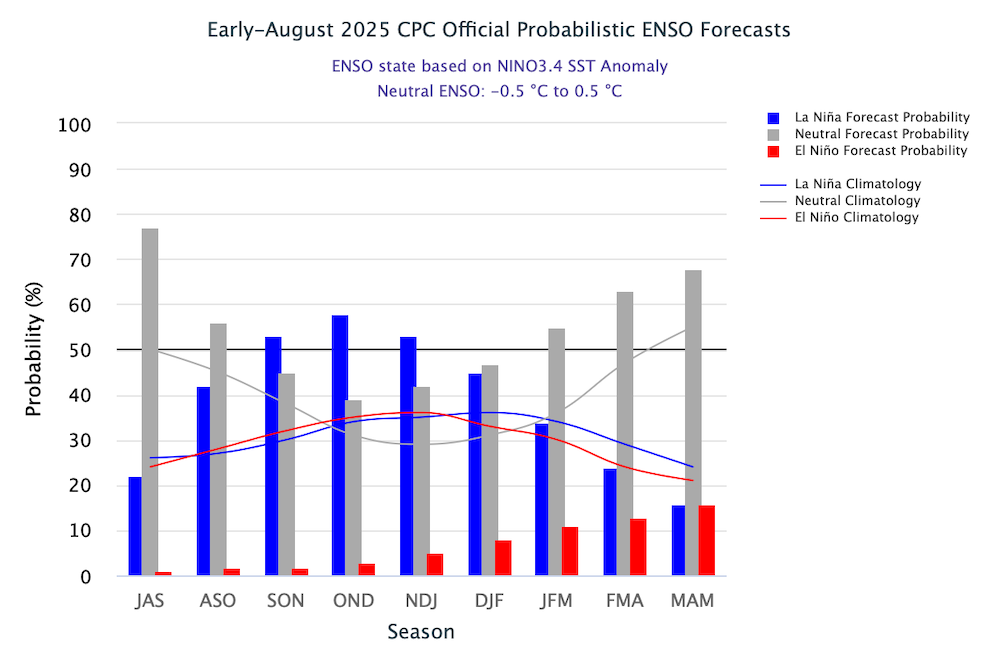
La Niña conditions are likely from September 2025 through January 2026. NOAA’s official probabilistic ENSO forecast indicates a greater than 50% chance for La Niña during this period. Precipitation and temperature related to La Niña, combined with the La Niña forecast and current drought conditions, suggest drought persistence in the Southwest United States, potential drought development in the Southeast, and drought improvement in the Pacific Northwest into Spring 2026.
How is ENSO measured, and when did La Niña and El Niño events occur?
ENSO is measured with sea surface temperatures in the tropical Pacific Ocean, atmospheric winds, and atmospheric pressure, among others.
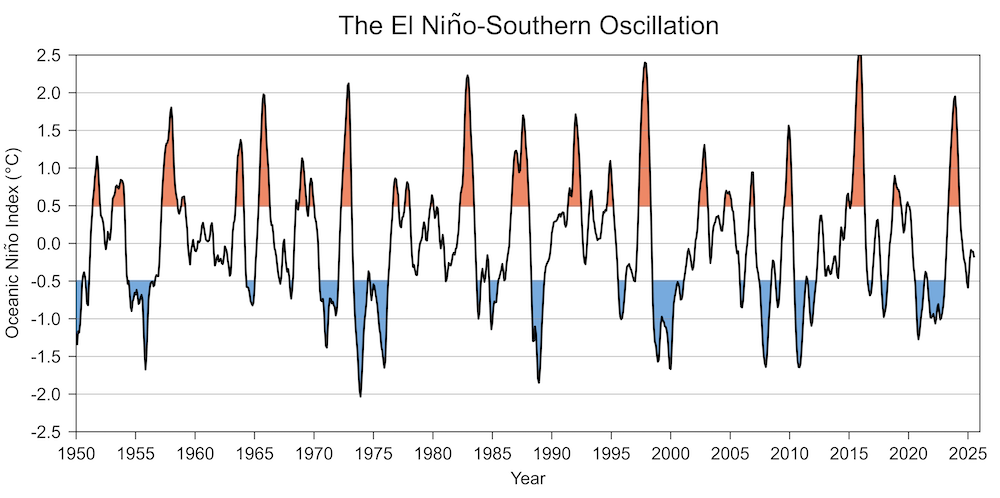
The Oceanic Niño Index (ONI) is NOAA's primary tool to monitor and forecast La Niña and El Niño. It measures three-month running averages of sea surface temperature departures from average in the Niño3.4 region (a region near the equator in the Pacific Ocean, from 5°S to 5°N latitude and 170°W to 120°W longitude). El Niño events occur when the ONI exceeds 0.5°C for five consecutive three-month periods, while La Niña events occur when values fall below -0.5°C for the same duration. The ONI indicates that El Niño and La Niña events occur periodically, with several occurring each decade between 1950 and 2025 (Figure 1).
How do La Niña and El Niño affect drought in the contiguous United States?
La Niña and El Niño alter the chances for below-average precipitation and above-average temperatures, as well as above-average precipitation and below-average temperatures, in the contiguous United States during autumn, winter, and spring, which affect drought onset, persistence, improvement, and termination.
La Niña
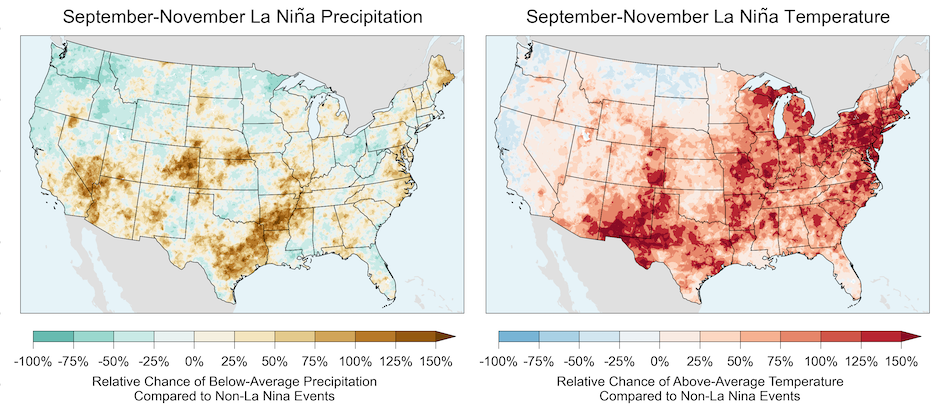
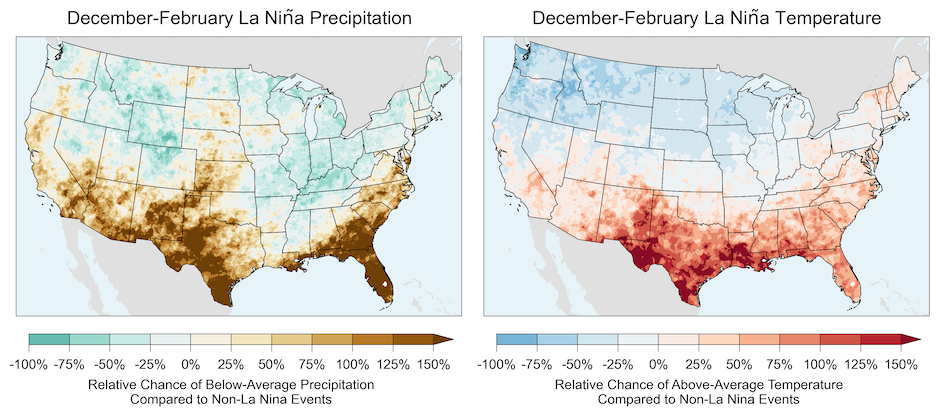
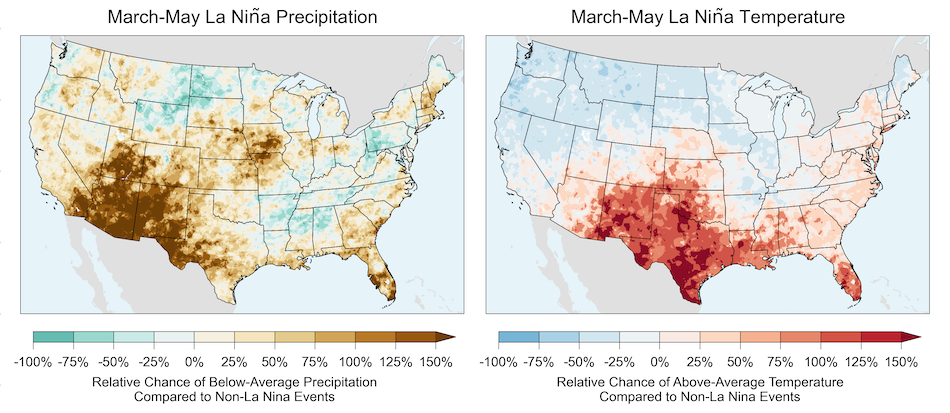
La Niña is associated with a higher likelihood of below-average precipitation and above-average temperatures in the southern contiguous United States during the cool seasons (September-November, December-February, and March-May) (Figure 2). The most consistent dry pattern is observed in the Southwest (California, Nevada, Arizona, and Utah), where La Niña increases the chances of this by over 50%. Other notable areas include the Southeast, along with Texas, New Mexico, and Oklahoma during December-February and March-May. Additionally, the Central Great Plains sees an increased chance of below-average precipitation in March-May, which typically marks the beginning of its wet season.
Conversely, La Niña is associated with a lower chance of below-average precipitation and above-average temperatures in the northern tier of the contiguous United States during these cool seasons. This includes the Pacific Northwest and Northern Great Plains in September-November, and the Intermountain West and Ohio Valley in December-February.
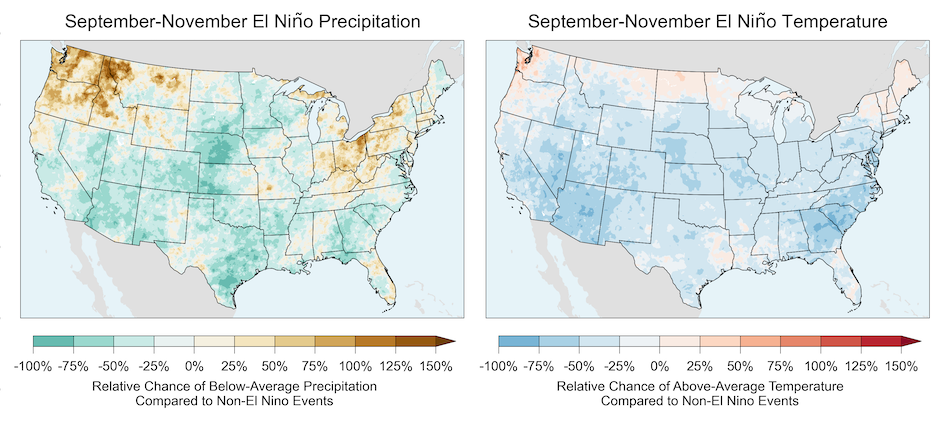
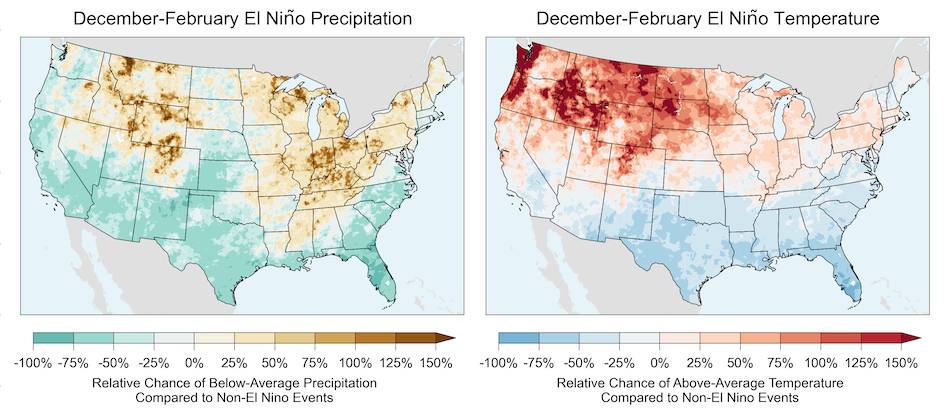
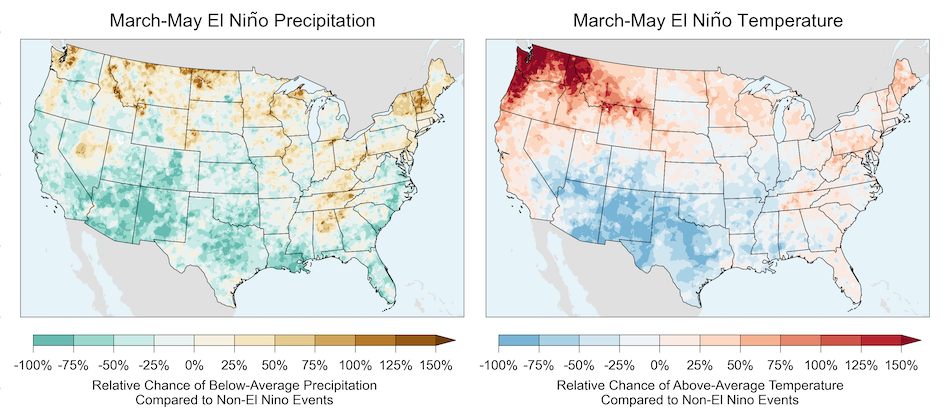
El Niño
During the cool seasons, El Niño typically has the opposite effect of La Niña on precipitation and temperature patterns across the contiguous United States (Figure 3). El Niño reduces chances of below-average precipitation and above-average temperatures in the Southern U.S. from September to May. Conversely, it increases the likelihood of these conditions in the Northern U.S. during March-May and December-February.
What does the La Niña forecast mean for drought in late 2025 and early 2026?
La Niña conditions are forecast in late 2025 and early 2026, which increases the chances for below-average precipitation and above-average temperatures in the Southwest, Southeast, Southern California, and Texas, as well as above-average precipitation and below-average temperatures in the Pacific Northwest, Intermountain West, and Ohio Valley (Figure 2). NOAA’s official probabilistic ENSO forecast shown in Figure 4 indicates a greater than 50% chance for La Niña in September-November, October-December, and November-January.
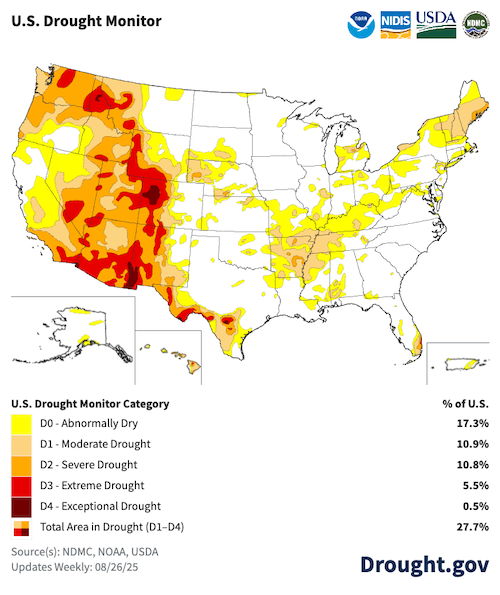
Precipitation and temperature related to La Niña (Figure 2), combined with the La Niña forecast (Figure 4) and current drought conditions (Figure 5), suggest drought persistence in the Southwest United States and drought improvement in the Pacific Northwest into Spring 2026.
While the effects of La Niña on North America are detailed above, it's important to note that the impacts can differ within and between individual La Niña and El Niño events. While La Niña conditions increase the likelihood of drought improvement in the Northwestern U.S. and deterioration in the Southwestern U.S., that’s not always the case. The 2024-2025 La Niña brought below-normal precipitation to much of the Southwestern U.S. but only above-normal precipitation to parts of the Northwestern U.S., and these areas quickly dried out during spring and summer.
NIDIS and partners will continue monitoring and sharing ENSO updates as well as other climate influences this coming water year.