NIDIS Launches Mississippi River Dashboard to Support Drought Resilience Across the Basin
The Mississippi River provides drinking water for millions of Americans, supports hundreds of fish and bird species, and is one of the world’s most important commercial waterways, with an extensive transportation network moving food and other goods across the nation and the world. When drought occurs in the Mississippi River Basin, it can have devastating impacts.
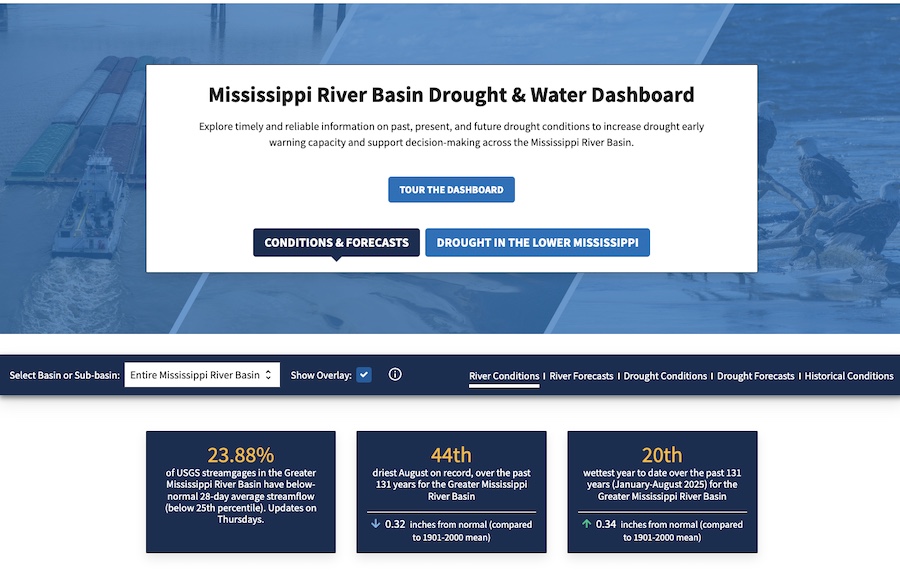
Actionable, user-friendly, and reliable information is essential for risk-informed decision-making across the Mississippi River Basin. In response to impacts of drought in the region, NOAA’s National Integrated Drought Information System (NIDIS) built a Mississippi River Basin Drought and Water Dashboard. NIDIS is an interagency program within the Climate Program Office, which is part of NOAA's Office of Oceanic and Atmospheric Research. NIDIS was honored to join mayors from across the basin at the Mississippi River Cities and Towns Initiative annual meeting in Minneapolis/St. Paul on September 17 to officially launch the new Dashboard and highlight its capabilities.
The Dashboard was developed by NIDIS and built by the U.S. Drought Portal team at NOAA’s National Centers for Environmental Information, in close collaboration with NOAA's National Weather Service, the U.S. Army Corps of Engineers, the U.S. Coast Guard, the U.S. Geological Survey, state and local government agencies, and industry organizations.
Drought in the Mississippi River Basin
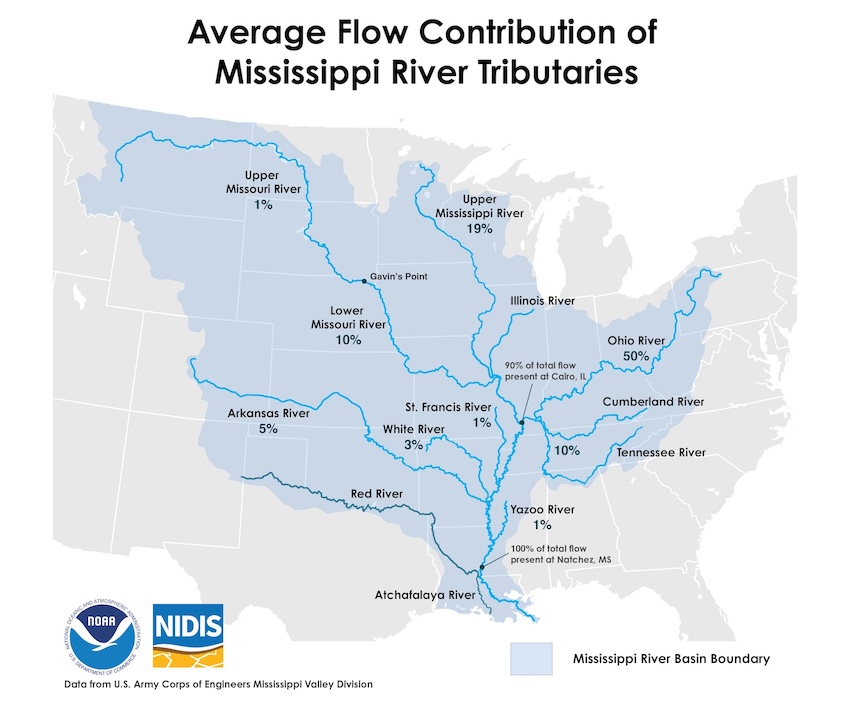
Millions of Americans depend on the Mississippi River for their lives and livelihoods. The drainage basin spans 40% of the contiguous U.S. and 31 states. More than 660 million tons of cargo move on the river each year, and barge transportation on the river accounts for around 90% of U.S. agricultural exports. On the Lower Mississippi River alone, tourism and outdoor recreation generate nearly $17 billion in annual expenditures and provide 245,000 jobs. Drought conditions throughout the basin can decrease crop production, increase wildfire risk, and impact water supply.
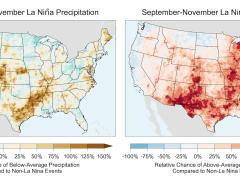
The Mississippi River corridor experienced a number of severe drought events in the last 100 years, which disrupted river commerce and communities along the river. An added challenge in recent years has been the tendency to transition from drought, to flood, and back to drought within short time spans, sometimes within a matter of months.
Most recently, in 2023, drought in the Upper Mississippi and Ohio River Basins led to historically low water levels downstream on the Lower Mississippi River. River barges had to reduce the weight of cargo they carried because the river was not deep enough for heavier loads. This increased costs to transport key agricultural commodities such as corn and soybeans. Several parishes in southern Louisiana issued drinking water advisories—and the state’s crawfish agriculture industry lost an estimated $139.8 million—as water levels dropped so low that salt water began to travel up the river.
The Mississippi River Basin Drought and Water Dashboard: From Information to Action
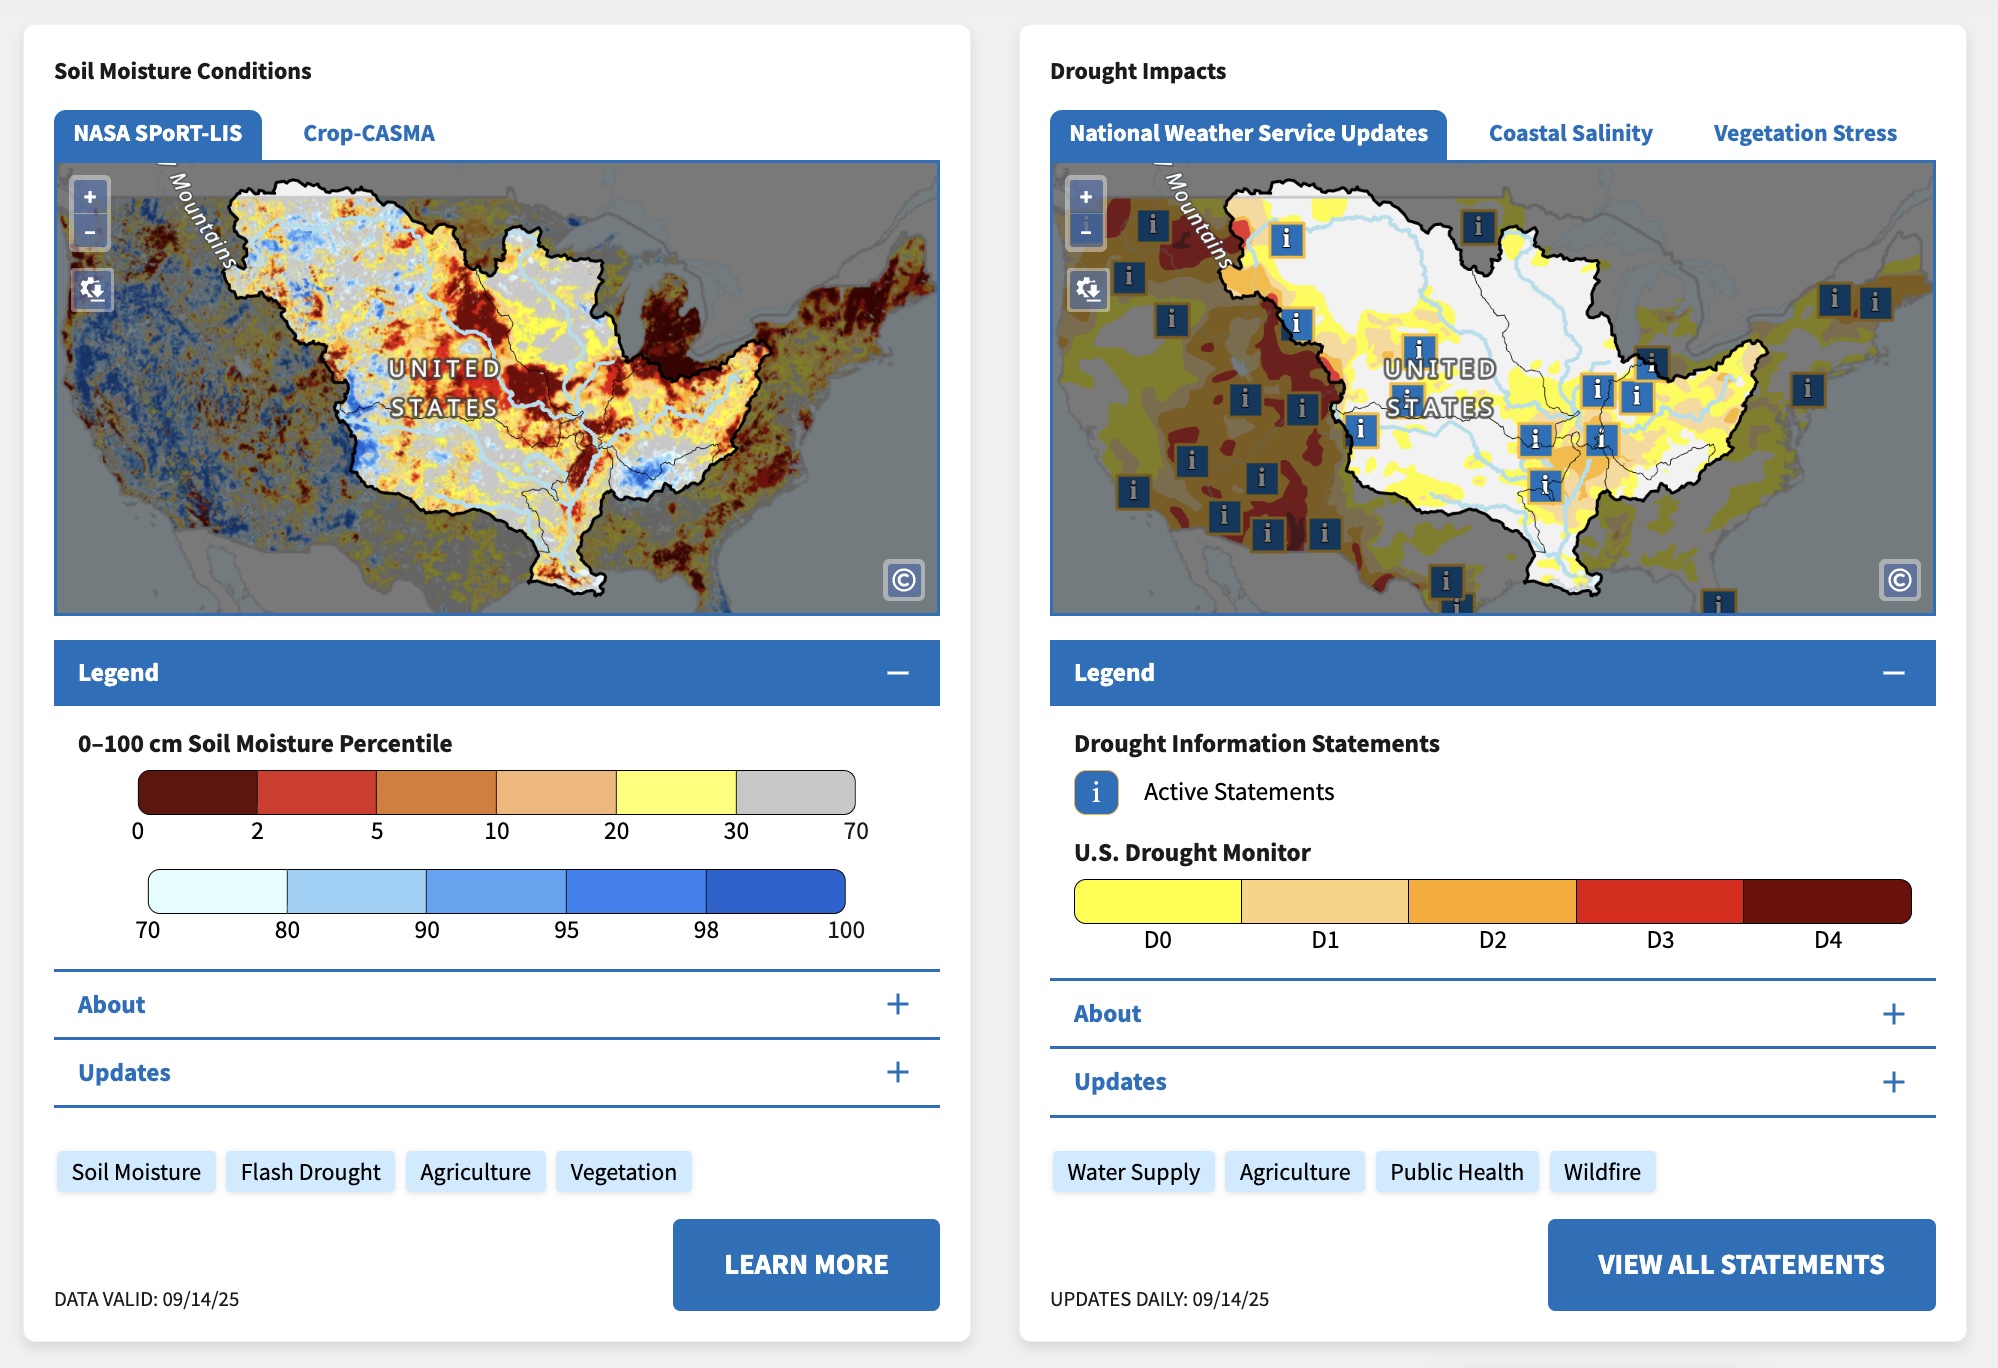
NIDIS and partners created the Mississippi River Basin Drought & Water Dashboard to curate timely and relevant information from across the government, add value through customizable maps and images, and provide key contextual information on drought impacts across the basin. The Dashboard provides an efficient communications and decision-support resource for state and local governments and the private sector, helping them proactively prepare for and mitigate the impacts of drought and low water in their communities.
“America's Watershed Initiative (AWI) and…more than 60 partners tested scenarios and provided feedback that led to the outstanding product released today,” said Kim Lutz, Executive Director of AWI. “As an organization focused on providing the best available science to decision-makers, we are excited about this tool's utility for multiple users. AWI has long emphasized the importance of inland navigation in moving millions of tons of agricultural goods to market. This easy-to-use tool will help users across sectors better understand drought impacts on these vital economic resources for our watershed and nation.”
In addition to real-time maps and data for the entire basin, the Dashboard also provides an educational overview of drought and low water in the Lower Mississippi River Basin (Arkansas, Louisiana, and Mississippi). This includes information on how water is managed on the Lower Mississippi River, the connection between low water and drought conditions, and drought’s far-reaching socioeconomic impacts.
NIDIS developed this Dashboard in response to requests from partners across the Lower Mississippi region to help streamline access to authoritative, comprehensive information on current and predicted conditions. In late 2024 and early 2025, NIDIS conducted stakeholder engagement to inform Dashboard development and ensure it is useful for state, tribal, and local governments and the private sector. This included one-on-one conversations, usability testing, and a series of listening sessions with hundreds of information providers and users across the basin.
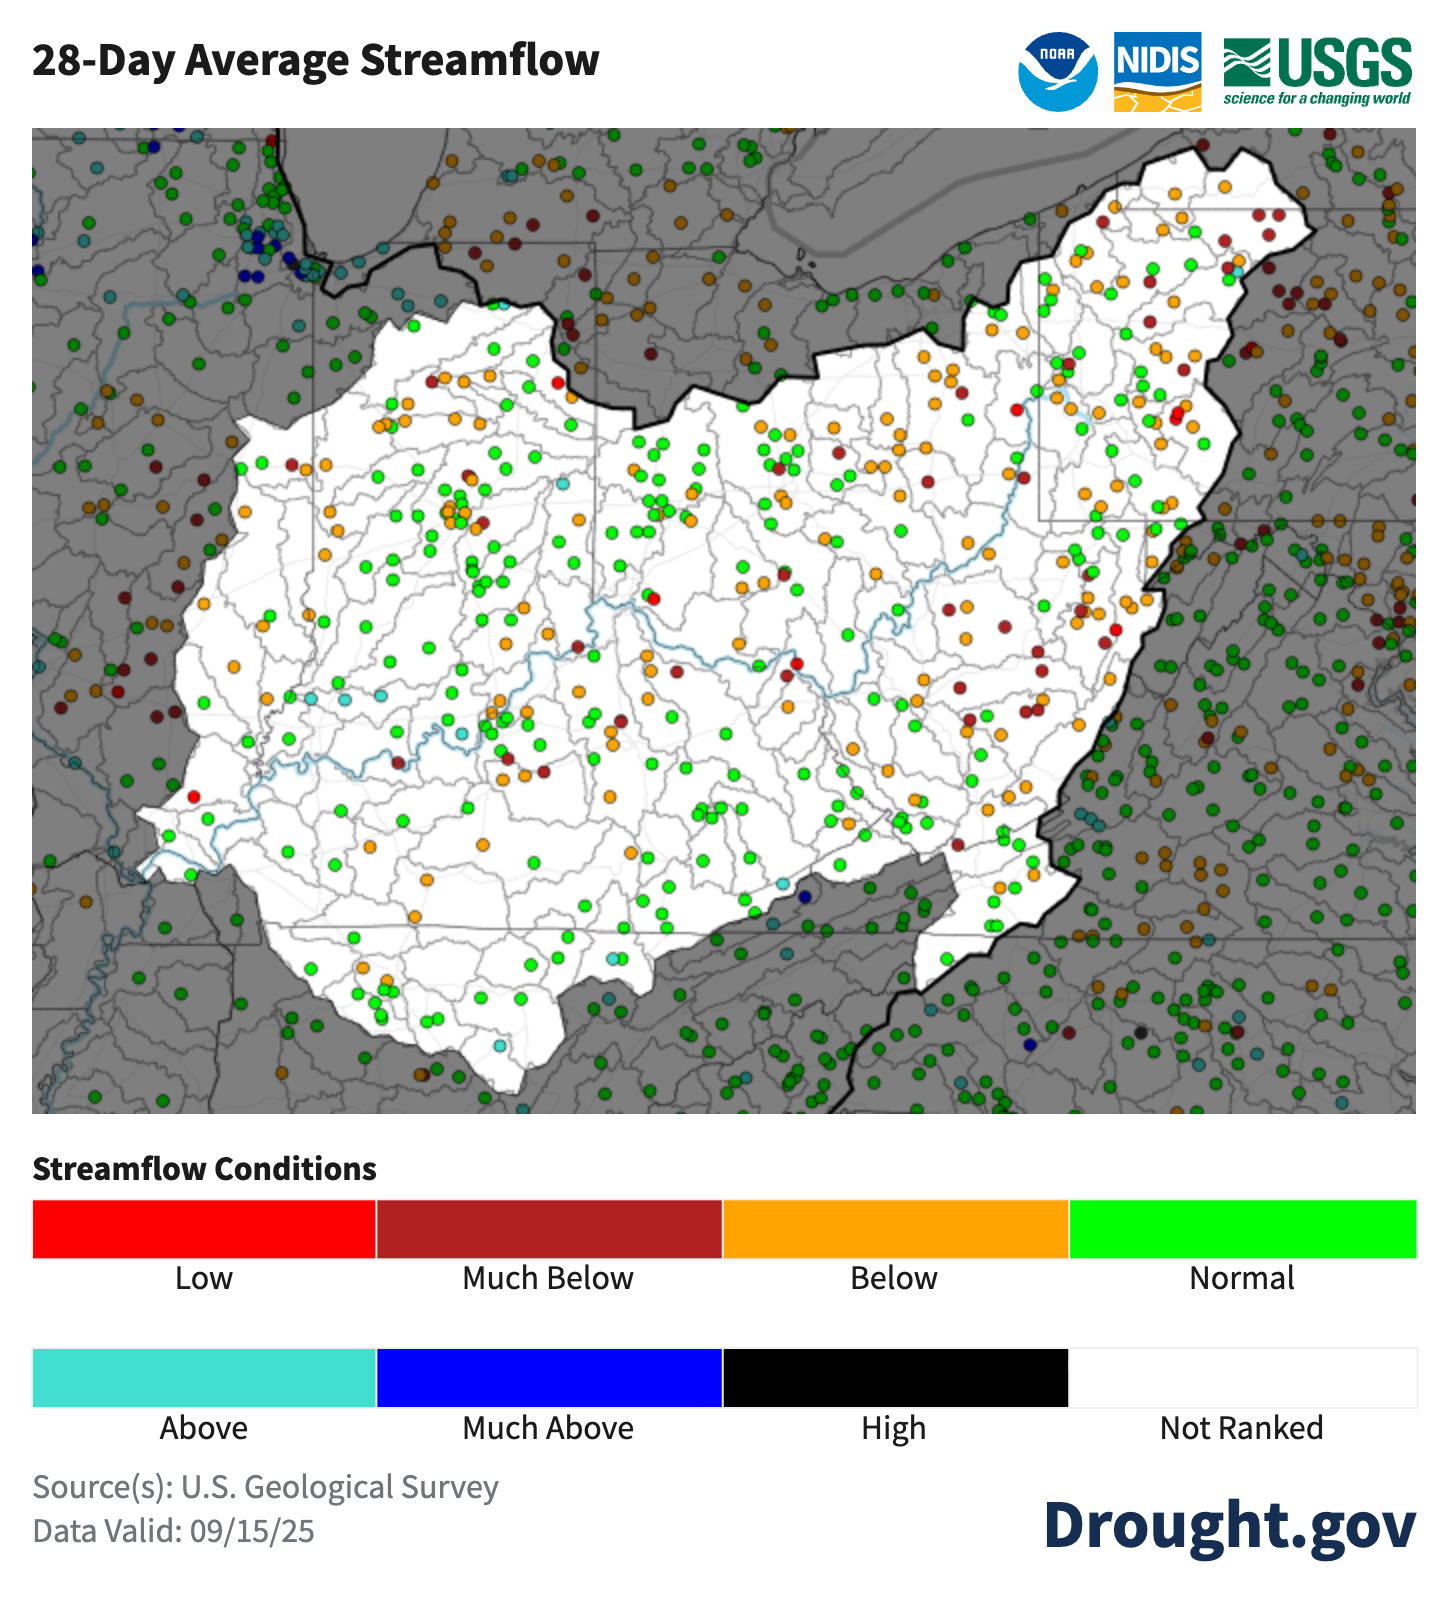
Users emphasized the need for timely information for the entire Mississippi River Basin as well as sub-basins, as drought conditions in upper basins can impact water levels downstream. They also identified the need for better communications resources to provide decision-makers, private industry, and the public with tailored and actionable drought and low water information to inform decisions and mitigate impacts. Key data and maps identified included current and forecast river levels and flow, basin-wide drought information (including measures of evaporative demand and flash drought), and maps showing drought impacts on wildfire risk, water quality, soil moisture, and vegetation stress.
To meet these needs, the Mississippi River Basin Drought & Water Dashboard features:
- Timely information on drought and river conditions, with interactive maps that automatically update with the latest information, including:
- Current and forecast river conditions, including river levels and flow
- Drought conditions and impacts across the Mississippi River Basin
- Outlooks and forecasts
- Interactive historical drought data for the entire basin
- A dropdown menu that allows users to view conditions for the entire Mississippi River Basin or a sub-basin—including the Upper Mississippi, Lower Mississippi, Missouri, Ohio, Tennessee, and Arkansas-White-Red River Basins. Users can also overlay smaller sub-basin (Hydrologic Unit Code-8 [HUC8]) boundaries on any map.
- The ability to customize and download high-quality map images for easy sharing in newsletters, situational briefings, presentations, and more. Just click the “Download & Customize Map” icon in the top left corner of any map.
- Plain language educational content on drought and low water on the Lower Mississippi River, providing context for current and forecast conditions.This includes the relationship between drought and low water, how water and navigation channels are managed on the river, and drought’s far-reaching impacts on the transportation & maritime industry, agricultural production, recreation and tourism, wildlife, and public health.
You can find the Mississippi River Basin Drought & Water Dashboard on Drought.gov in the By Location section, under Watersheds.
For more information, contact Meredith Muth (meredith.f.muth@noaa.gov) or Kelsey Satalino (kelsey.satalino@noaa.gov).