NIDIS and Partners Share Drought Tools and Research at AGU Annual Meeting
On December 15–19, the American Geophysical Union (AGU) is hosting its annual meeting in New Orleans, Louisiana. This year, the meeting will focus on the theme, “Where Science Connects Us.”
NOAA’s National Integrated Drought Information System (NIDIS) and partners are excited to present on NIDIS-supported drought research and applications at AGU. This includes a review of climate normals (reference periods) for drought indices, a demonstration of the new Mississippi River Basin Drought and Water Dashboard and its applications for the agricultural sector, and research on “weather whiplash,” abrupt transitions from abnormal dryness to extreme wetness.
In addition, NOAA will have a dedicated booth at the meeting, where NOAA staff will host informal chat sessions with the scientific community, drawing on their expertise in oceans, atmosphere, weather, and related disciplines. NIDIS is a program within the Climate Program Office, which is part of NOAA’s Office of Oceanic and Atmospheric Research.
Below, explore select AGU sessions relevant to drought. You can also view all conference sessions on the AGU website.
Presentations from NIDIS and Its Partners
A Review of Climate Normals
Session: GC24B - Applications of Climate Science in a Nonstationary Climate II Oral, Tuesday, December 16, 4:15 - 5:45 p.m. CT
Authors: Joel Lisonbee, Cooperative Institute for Research in Environmental Sciences (CIRES) at the University of Colorado Boulder, NOAA/NIDIS; John W. Nielsen-Gammon, Texas A&M University; Blair Trewin, Australian Bureau of Meteorology; Britt A. Parker, NOAA/NIDIS; and Gretel Follingstad, Environmental Defense Fund
Description: “Traditionally, drought assessments have utilized either the full historical record or a 30-year ‘normal’ period as recommended by the World Meteorological Organization. However, climate non-stationarity challenges the validity of these conventional approaches, leading to potential misinterpretations of drought severity and frequency.
Various methods have been developed to address this issue, including the adoption of shorter, frequently updated reference periods and the development of numerous non-stationary drought indices. While shorter periods may better reflect contemporary climate, they can introduce statistical instability; conversely, using the full record without accounting for trends can obscure current drought conditions. Some widely used drought indices, like the Standardized Precipitation Index (SPI), are especially sensitive to the chosen reference period.
Although at least 18 non-stationary drought indices have been proposed to incorporate long datasets while accounting for climate trends, their complexity can hinder operational implementation. Presently, there is no universal consensus on a single best approach. The ‘correct’ reference period should align with the specific purpose of the drought assessment.”
The Mississippi River Drought & Water Dashboard: Strengthening Drought Early Warning for Agriculture and Beyond
Session: B31C - Digital Tools and Earth Observations for Resilient Coastal and Inland Agroecosystems I Oral, Wednesday, December 17, 8:30 - 10:00 a.m. CT
Authors: Kelsey Satalino Eigsti, CIRES/University of Colorado Boulder, NOAA/NIDIS; Meredith Muth, NOAA/NIDIS; Molly Woloszyn, CIRES/University of Colorado Boulder, NOAA/NIDIS; Elliot Wickham, Cooperative Institute for Research to Operations in Hydrology (CIROH), NOAA/NIDIS; Steve Ansari, NOAA’s National Centers for Environmental Information (NCEI); Rocky Bilotta, NOAA/NCEI; John Frimmel, Riverside Technology Inc., NOAA/NCEI; James Baker, Riverside Technology Inc., NOAA/NCEI; Michael Shaw, ISciences, LLC, NOAA/NCEI; and Derrick Burt, ISciences, LLC, NOAA/NCEI
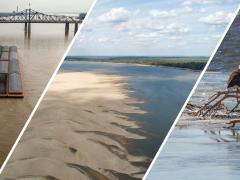
Description: “The Mississippi River is one of the world’s most important commercial waterways, and the surrounding basin is a hotspot for U.S. agricultural production. The significant impacts of drought on this region were amplified in the past few years as parts of the Lower Mississippi River hit historic low river levels. In 2023, for example, low water on the Lower Mississippi led to reduced barge loads, increasing transportation costs for corn, soybeans, and other agricultural commodities. Meanwhile, heat and loss of soil moisture dried up pastures and reduced crop production throughout the Lower Mississippi River Basin, requiring additional expenses for feeding hay to cattle. An added challenge has been the tendency to transition from drought, to flood, and back to drought, sometimes within a matter of months.
Effective drought early warning is essential for mitigating the socioeconomic impacts of drought, including agricultural impacts. To improve access and usability of drought and water information, NOAA’s National Integrated Drought Information System (NIDIS) worked with information providers and users throughout the basin to develop a Mississippi River Drought and Water Dashboard. This online platform, hosted on the U.S. Drought Portal (www.drought.gov), provides a suite of curated information and tools from across the federal government to strengthen communications and decision-making across the Mississippi River Basin. The Dashboard features real-time information with easy-to-understand, customizable, and downloadable graphics and data that span historical, current, and future conditions. This includes precipitation, soil moisture, vegetation stress, evaporative demand, and other key drought indicators. The Dashboard also includes an educational section on drought and low water on the Lower Mississippi River, providing context for interpreting current and forecast conditions.
This presentation will include a live demonstration of the Dashboard and its key features for the agricultural sector, as well as additional tools and resources for supporting drought resilience through NIDIS’ regional Drought Early Warning Systems and applied research.”
Weather Whiplash: Abrupt Transitions from Prolonged Dryness to Extreme Wetness
Session: Hydrologic Extremes: Understanding Drivers, Risks, and Uncertainty II Oral, Monday, December 16, 4:15–5:45 p.m. CT
Authors: Andrew Hoell, NOAA’s Physical Sciences Laboratory (PSL); Kelly M, Mahoney, NOAA/PSL, Mimi Abel, NOAA/PSL; William Ryan Currier, NOAA/PSL; Janice L. Bytheway, NOAA/PSL; Joel Lisonbee, CIRES/University of Colorado Boulder, NOAA/NIDIS; Towler Erin, NOAA/PSL; Jason Gerlich, CIRES/University of Colorado Boulder, NOAA/NIDIS; Roger S. Pulwarty, NOAA/PSL; and Veva Deheza, NOAA/NIDIS
Description: ‘‘Weather whiplash’ is the abrupt transition from one extreme environmental condition to another that amplifies the effects of the individual extreme events. Such transitions include hot-to-cold and dry-to-wet, and vice versa. We diagnose the characteristics and predictability of dry-to-wet whiplash events globally to gain a better situational awareness of such occurrences that we may use to predict them in the future. We examine occurrences in which low cumulative precipitation over the course of more than one year (<20th percentile) was followed by extreme monthly precipitation (>99th percentile) since 1901 using several gridded precipitation estimates and model simulations. Dry-to-wet whiplash events are infrequent, impacting on average only 1% of global land areas in any given month. However, the extent of land area affected by these events shows significant variability across months, years, and decades.
Dry-to-wet whiplash events exhibit a distinct seasonal and geographic distribution, predominantly occurring in the summer of each hemisphere. In December-February, whiplash events were most prevalent in Southern Hemisphere land areas of South America, Southern Africa, and Australia, while in June-August, whiplash events were most prevalent in Canada, the southeastern United States, the west African Sahel, Europe, and Asia. An exception to this pattern was observed in Mediterranean climates and adjacent regions, including the western United States, northern Africa, and southern Europe where dry-to-wet whiplash events were most frequent in winter. Far fewer wet-to-dry whiplash events occurred in the spring and autumn transition seasons globally, but notable areas affected by the events during these seasons include the central United States, eastern Africa, and western Asia.
Dry-to-wet whiplash events are potentially predictable in some regions and seasons based on slow-varying aspects of Earth system behavior that include the El Nino-Southern Oscillation. However, since these whiplash events involve the sequence of dry and wet extremes that occur over the course of more than one year, several other aspects of inherent Earth system variability like the Madden-Julian Oscillation also play a role, which itself and its effects are predictable only several weeks in the future.”
Explore Other Drought-Related Sessions at AGU
Hydrologic Extremes: Understanding Drivers, Risks, and Uncertainty
Dates/Times:
- Poster Session: Monday, December 15, 2025, 8:30 a.m.–12 p.m. CT
- Oral Presentation Session: Monday, December 15, 2025, 4:15–5:45 p.m. CT
Session Chairs: Aaron Alexander, University of Wisconsin Madison; Naresh Devineni, Department of Civil Engineering, The City College of the City University of New York (CUNY), and CUNY-CREST; and Arianna Borriero, Munich Re
Description: “Climate variability and rapid environmental change are altering catchment responses, making extreme rainfall, floods, and droughts increasingly unpredictable and damaging. Evolving hydrological dynamics and connectivity patterns challenge prediction tools and require deeper understanding of hydrological responses amid limited observations and uncertainties in models and data. Urbanization amplifies extreme event impacts, while inconsistent estimation/reporting hinder accurate impact of damage assessment. [This session will feature research] addressing these challenges by advancing knowledge of hydrological responses under changing conditions, extreme event drivers, and flood damage patterns to improve management.”
Advances in Drought Monitoring and Risk Management: Integrating Remote Sensing, Stochastic Hydrology, Modeling, and Surveys
Dates/Times:
- Oral Presentation Session: Tuesday, December 16, 2025, 8:30–10 a.m. CT
- Poster Session: Tuesday, December 16, 2025, 2:15–5:45 p.m. CT
Session Chairs: Sara Sadri, Princeton University; Upmanu Lall, Columbia University
Description: “Droughts are complex extreme events impacting ecosystems, agriculture, economies, and human health. With climate change increasing their frequency and severity, there is a critical need for innovative, timely, and actionable monitoring and risk management tools. This session highlights advances in drought detection, forecasting, and risk management through the integration of remote sensing, … stochastic hydrology, land surface modeling, and ground-based surveys. Topics include satellite-based soil moisture and vegetation stress monitoring, development of drought indices across diverse climates, machine learning applications for drought and/or drought impact forecasting, and integration of citizen science and socio-economic impacts into monitoring frameworks.”
Multisector Dynamics: Understanding Extreme Weather, Compound Hazards, and Their Impacts
Date/Time: Wednesday, December 17, 10:30 a.m.–12 p.m. CT
Session Chairs: Erwan Monier, University of California Davis; Nicole Jackson, Sandia National Laboratories; and Deeksha Rastogi, Oak Ridge National Laboratory
Description: “Extreme weather events and natural hazards, including droughts, wildfires, heatwaves, cyclones, and floods have significant and potentially long-lived impacts. Their effects intensify when multiple hazards coincide or occur in succession, known as compound events. With the increasing frequency and intensity of extreme weather and compound hazards, understanding their impacts across various sectors and scales becomes crucial. This session convenes interdisciplinary research to advance understanding how extreme weather and natural hazards play a major role as stressors on the complex Earth and human systems. [This session will feature research exploring] the latest advances in characterizing the atmospheric, hydrological, and land-surface processes involved in compound events and their cascading interactions, using quantitative or qualitative methods.”
Drought Risk in Changing Climate: Diagnosis, Modeling, and Management
Dates/Times:
- Oral Presentation Session I: Wednesday, December 17, 2025, 8:30–10 a.m. CT
- Oral Presentation Session II: Wednesday, December 17, 2025, 10:30 a.m.–12 p.m. CT
- Oral Presentation Session III: Wednesday, December 17, 2025, 2:15–5:45 p.m. CT
- Poster Session: Thursday, December 18, 2025, 8:30 a.m.–12 p.m. CT
Session Chairs Chandra Rupa Rajulapati, Indian Institute of Science, and Sudarshana Mukhopadhyay, University of California San Diego
Description: “Droughts pose a persistent threat to food and water security worldwide. Understanding the evolution of droughts across spatial and temporal scales, climate drivers influencing these extremes, and repercussions of droughts on food and water security are essential for effective planning and development of mitigation measures. Consequently, there is a critical need for advancements in modeling, monitoring, prediction, and risk assessment to improve resilience against droughts. In this session, we welcome research contributions encompassing, but not limited to, the following areas: (1) analyzing changes in the severity, duration, intensity, frequency, and spatial extent of droughts under changing climate; (2) exploring novel methodologies for drought characterizations and predictions, e.g., machine learning techniques; (3) understanding the climate drivers of droughts and their spatial/temporal evolution, including flash droughts; (4) characterizing drought risk, vulnerability, exposure, and adaptive capacity; (5) proposing novel methods for short- and long-term drought management strategies.”
Human Dimensions of Drought: Water, Health, and Community Vulnerability Poster Session
Date/Time: Thursday, December 18, 2025, 8:30 a.m.–12 p.m. CT
Session Chairs: Azar Abadi, University of Nebraska Medical Center; Jesse E. Bell, University of Nebraska Medical Center
Description: “Droughts are escalating in frequency and severity, exposing critical vulnerabilities in public health systems and water infrastructure. Recent events, such as the 2023 saltwater intrusion into southeast Louisiana’s municipal water supplies during low Mississippi River flow, underscore how drought can immediately threaten safe drinking water and increase health risks. This session [will feature] interdisciplinary research examining how drought contributes to health impacts—whether through water quality degradation, service disruptions, heat-health interactions, or increased disease vulnerability. We encourage work that investigates drivers of risk, including structural inequities, policy gaps, and climate-related stressors. Case studies, surveillance data, and evaluations of mitigation efforts are welcome. We aim to highlight emerging knowledge to inform more holistic drought preparedness, integrating perspectives from public health, environmental science, and water management to better protect communities in an era of compounding climate threats.”
Spatial Fingerprints of Climate Extremes: Impacts on Ecosystem Processes, Vegetation Function, and Biodiversity Poster Session
Date/Time: Thursday, December 18, 2025, 8:30 a.m.–12 p.m. CT
Session Chairs: Nicholas Parazoo, NASA Jet Propulsion Laboratory, and Nima Madani, University of California Los Angeles, Joint Institute for Regional Earth System Science and Engineering
Description: “As climate extremes intensify in frequency and severity, terrestrial ecosystems are undergoing unprecedented structural and functional transformations. These disturbances disrupt the coupled carbon–water–energy cycles and drive shifts in vegetation structure, species distributions, and biodiversity patterns. The spatial fingerprints of these changes are often most pronounced at latitudinal and altitudinal margins, where ecosystems and species are pushed beyond their physiological thresholds. This session invites observational, experimental, and modeling studies that explore ecosystem responses to extreme climate events and assess their impacts on landscape dynamics, habitat quality, biodiversity, and ecosystem services.” Several posters in this session focus on the ecological impacts of drought.
For more information, view the full AGU program schedule. Or, subscribe to NIDIS’s email newsletters to stay up to date on drought research and news.