Drought and Low Water in the Lower Mississippi River
An overview of how drought and low water levels impact the Lower Mississippi River Basin, including water management and navigation, societal and economic impacts, and monitoring and forecasting efforts.
The importance of the Mississippi River cannot be overstated. As the largest drainage basin in the United States, the river collects water from all or parts of 31 states and covers 40% of the continental United States.
Millions of people in more than 50 cities depend on the Mississippi for their drinking water. The Mississippi is one of the world’s most important commercial waterways, with an extensive transportation network moving goods and foods across the nation and the world. The river is also rich in habitat diversity with at least 260 species of fish, and is a key migration route for 40% of U.S. migratory waterfowl and 60% of North American birds.
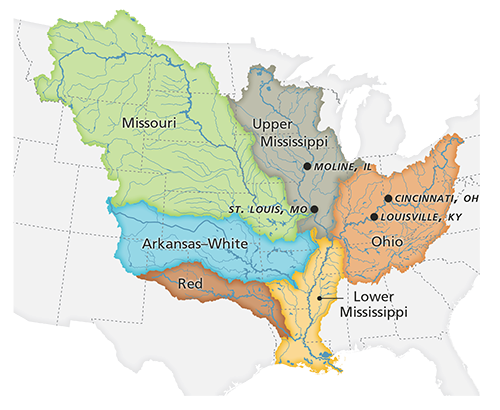
The Mississippi River itself can be divided into two sections: the Upper Mississippi, the river from its headwaters to the confluence with the Ohio River near Cairo, Illinois; and the Lower Mississippi, which flows from this confluence to the Gulf.
The full Mississippi River Basin includes not just the mainstem Mississippi River but the many tributaries flowing into the river from the Missouri, Ohio, and Arkansas-White-Red River Basins.

How Droughts and Low Water Impact the Lower Mississippi
Low water due to drought can be just as impactful as flooding on the Mississippi. Drought upstream of the Lower Mississippi—in the Midwest U.S., for example—can lead to extreme low water levels in the Lower Mississippi due to less freshwater flowing downstream.
In 2022, a rapid onset "flash" drought in the Ohio River Valley and Upper Mississippi River Valley caused river water levels (stages) to drop to levels not seen in more than a decade along key parts of the river. In 2023, the Lower Mississippi River again hit record low water levels at Cairo, Illinois and Memphis, Tennessee due to months of excessive heat and a lack of precipitation farther upstream along the Ohio and Upper Mississippi Rivers.
Low water levels can exist in the Lower Mississippi with or without drought in the region. Water levels on the Lower Mississippi typically decline in the fall and winter due to normal precipitation patterns across the middle and upper basin. In addition, drought can occur in states bordering the Lower Mississippi (Arkansas, Louisiana, and Mississippi) without impacting water levels in the river. For example, in 2011, Louisiana experienced a strong drought while the Lower Mississippi River levels were among the highest on record.
Key Takeaways
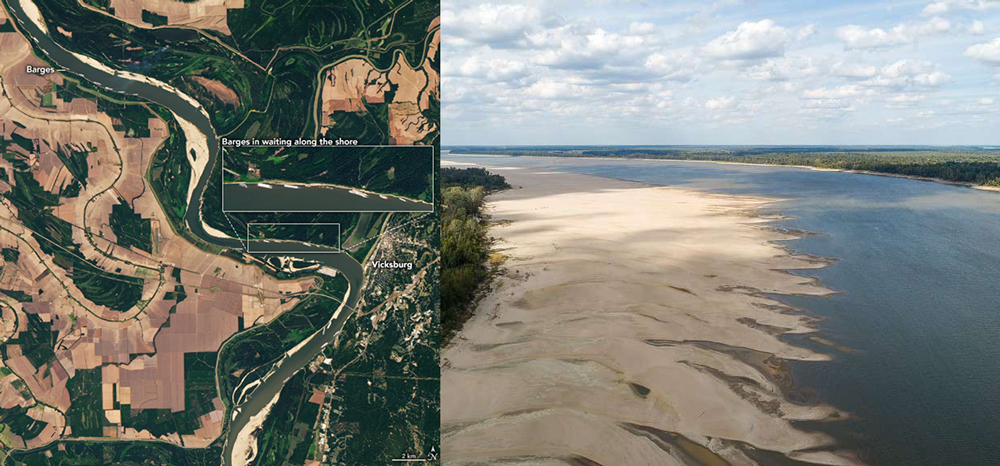
The Mississippi River corridor has experienced a number of severe drought events in the last 100 years, including droughts of the early 1930s, 1988, 2012, 2022, and 2023. Each of these events have led to disruptions in river commerce and to communities along the river. The 2012 Great Plains drought led to an estimated $30 billion in direct agricultural losses (not inflation-adjusted) for the U.S., and was responsible for closing the Mississippi River at least three times. In 2023, river barge companies had to reduce weight carried because the river was not deep enough for heavier loads, leading to increased costs to transport key agricultural commodities such as corn and soybeans.
| Forecast Location | 2023 | 2022 | 2012 | 1988 | Record Low |
|---|---|---|---|---|---|
| Cairo, Illinois | 4.5 ft | 4.8 ft | 7.2 ft | 4.9 ft | 4.5 ft (2023) |
| Memphis, Tennessee | -12.0 ft | -10.8 ft | -9.8 ft | -10.7 ft | -12.0 ft (2023) |
| Arkansas City, Arkansas | -4.5 ft | -3.5 ft | -3.2 ft | -5.0 ft | -5.1 ft (1936) |
| Greenville, Mississippi | 4.5 ft | 5.3 ft | 6.9 ft | 7.3 ft | 4.1 ft (1940) |
| Vicksburg, Mississippi | -1.5 ft | -0.4 ft | -1.1 ft | -1.6 ft | -7.0 ft (1940) |
| Red River Landing, Louisiana | 12.0 ft | 13.8 ft | 13.0 ft | 10.0 ft | 2.9 ft (1895) |
| Baton Rouge, Louisiana | 4.4 ft | 4.1 ft | 3.4 ft | 1.8 ft | -0.1 ft (1894) |
Data from the National Weather Service Lower Mississippi River Forecast Center and U.S. Army Corps of Engineers. View current and historical water levels from NOAA's National Water Prediction Service.

Water Management on the Lower Mississippi River
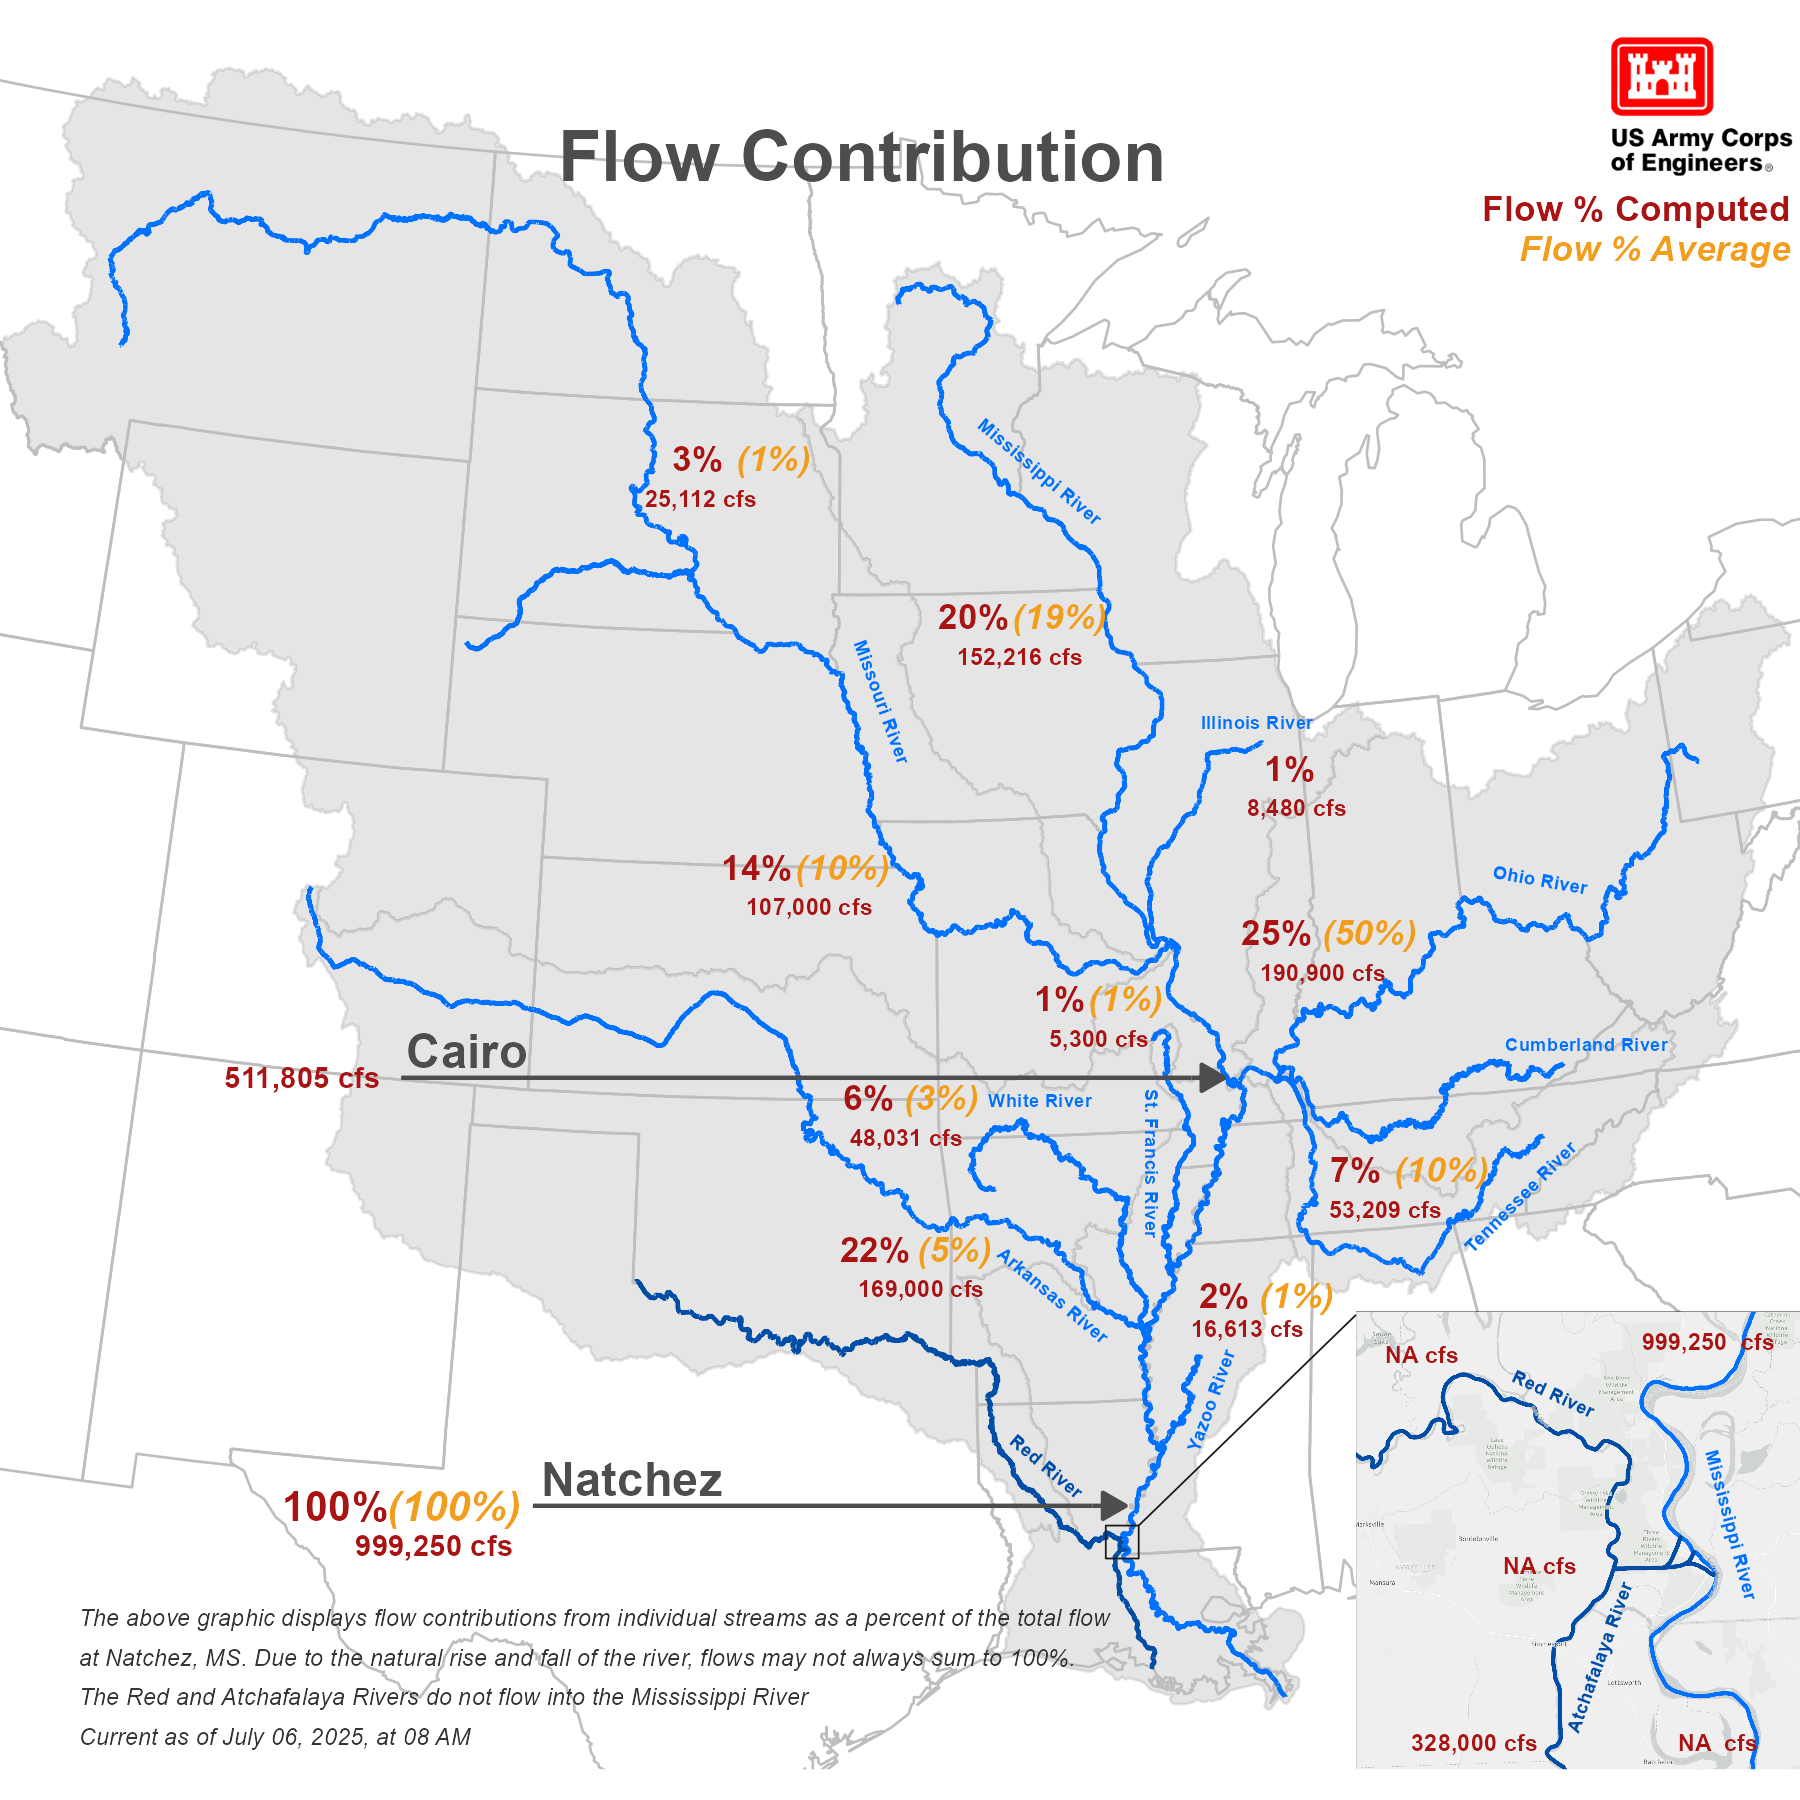
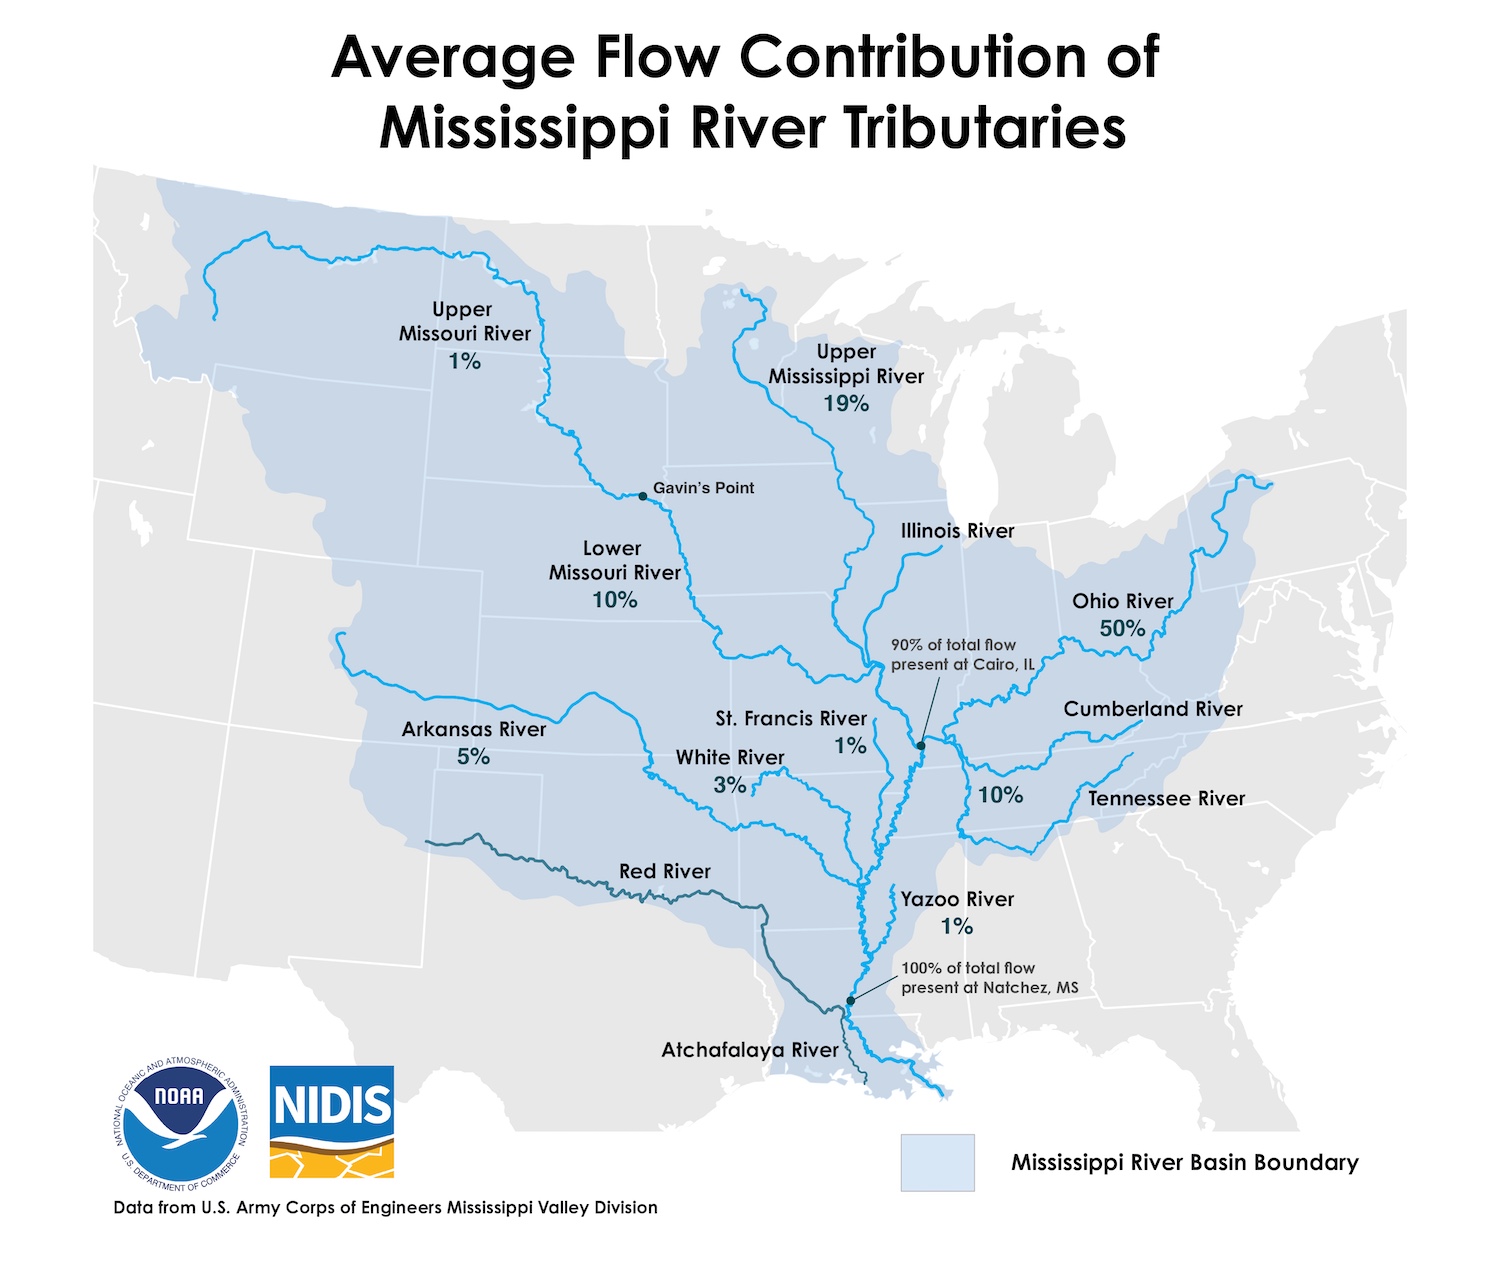
When considering low water or flooding on the Lower Mississippi, the rain that falls in Mississippi, Arkansas, or Louisiana has very little to do with it. This is because most of the water in the Lower Mississippi comes from upstream rivers. At the point where the Ohio River meets the Mississippi River (i.e., Cairo, Illinois), 90% of the water has entered the mainstem Mississippi River, which will then be discharged into the Gulf. The final 10% of river flows come from the St. Francis, White, Arkansas, and Yazoo Rivers, which enter the mainstem Mississippi below Cairo.
When the Lower Mississippi floods, it usually occurs as a result of heavy rains or snowmelt on the Ohio, Missouri, and/or Upper Mississippi Rivers. Likewise, drought conditions in these basins can lead to low flows and water levels on the Lower Mississippi because there is less water entering the river from upstream.
The Mississippi is the largest and most intensively managed floodway in the U.S. The U.S. Army Corps of Engineers (USACE) manages water levels via 29 “lock and dam” structures on the Upper Mississippi River above St. Louis, Missouri. These dams pool the water behind them to make the river deep enough for large towboats to navigate.
Below St. Louis (the point where the Missouri River comes in), the Mississippi River is naturally deep enough for vessel traffic, so there is no need for locks and dams for navigation. However, during times of drought above St. Louis, the river section below the Upper Mississippi lock and dam system receives a reduced amount of water, making the Lower Mississippi more susceptible to low water levels.
Key Takeaways
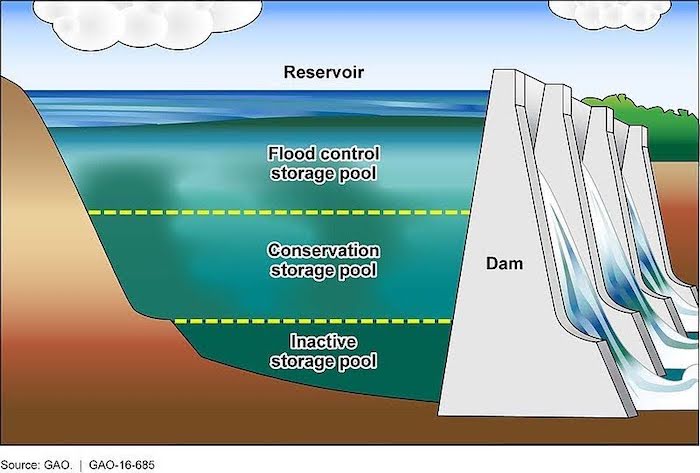
The USACE also operates reservoirs, which are man-made lakes holding water behind a large multi-purpose dam, primarily to control river flooding downstream. For example, the USACE may temporarily store water and excess runoff during rain events or in the spring and summer when more rainfall is expected. Holding back this excess water not only reduces flood risk downstream, but it also provides water for other activities, such as hydropower, recreation, fish and wildlife, and water supply.
In the late summer and fall, some reservoir projects begin drawing pools down and releasing more water, to get ready for the next wet season. While reservoirs don’t specifically operate for low water conditions, their normal operations of drawing down flood pools have a tremendous positive impact on water levels in downstream reaches during low water periods. Hydropower releases during low water are also very beneficial.

Impacts to Transportation, Maritime Industry, and Agriculture Trade
Keeping Navigation Channels Open
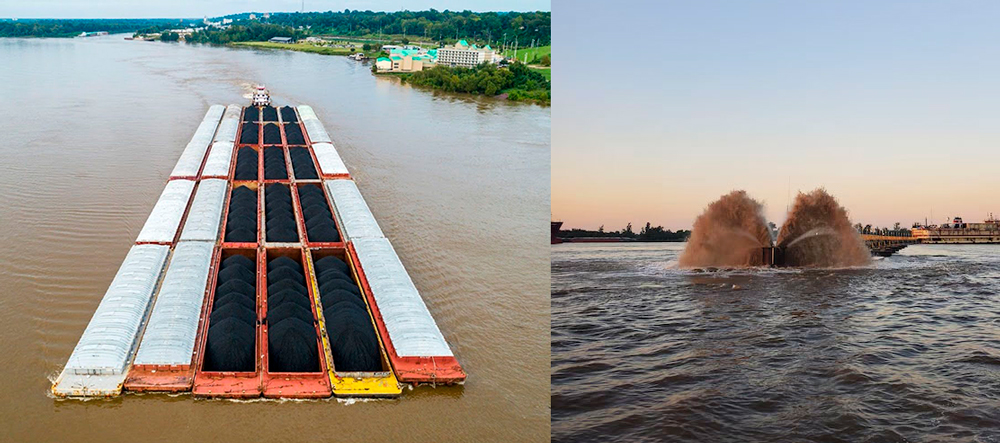
The Mississippi River inland port system is critical to national and international commerce and is designed around delivery by barge. Transportation via barges on the Mississippi River accounts for around 90% of U.S. agricultural exports; an estimated 660 million tons of freight is moved on the river each year, with an estimated value of more than $187 billion annually. Top bulk commodities transported on the Mississippi include petroleum products such as oil and gas, coal, and food and farm products, including around 60% of U.S. grain exports. Low water levels on the Lower Mississippi can impact commercial transport in a number of ways, including restrictions to ports, groundings of vessels, delays in shipments, and fewer goods carried per vessel.
The U.S. Army Corps of Engineers (USACE) maintains a 9-foot shipping channel from Baton Rouge, Louisiana to Minneapolis, Minnesota. From Baton Rouge past New Orleans to the mouth of the Mississippi River, the USACE maintains a 45- to 50-foot channel to allow ocean-going vessels access to ports. When low water levels are present, the USACE works with federal, state, local, and industry partners to maintain navigation up and down the Mississippi.
Key Takeaways
Maintaining an open navigation channel can pose a challenge during the late summer and fall season, which is typically a low water period due to normal precipitation patterns. Therefore, the USACE continuously surveys to monitor shoaling (the accumulation of sediment in a river channel) or the available water depth. The USACE periodically dredges the naturally deposited sediment on the river’s bottom to ensure open navigation for commercial shipping at all times of the year. The USACE also invests in infrastructure to lessen the amount of future dredging required. Dredging may require sections of the river to temporarily close, halt barge movements for intermittent periods, and limit how many barges can move and how much they carry. However, this practice is necessary to prevent vessel groundings, which can further delay commercial traffic and cause substantial damage to the navigation channel.
The timing of drought and low water levels is also important. A summer drought can limit agricultural inputs moving upstream, while a fall drought can more heavily impact a producer's ability to move crops downstream to markets. During the drought of 2022, low water levels coincided with the peak shipping season for U.S. corn and soybeans, the nation’s largest export crops, with a reported backup of more than 2,000 barges on the Lower Mississippi in early October.
Maintaining Safe River Navigation
To ensure the safety of the full Marine Transportation System including locks and dams, ports, and the network of barges, the U.S. Coast Guard (USCG) maintains and exercises close partnerships with industry groups, the USACE, and other government agencies to inform risk-based decisions regarding tow size, configurations, and draft restrictions. When disruptions such as groundings or channel integrity issues occur, waterway and navigation managers from the USCG, USACE, and industry partners coordinate continuous response efforts to assess, mitigate, and resolve impacts to ensure the critical flow of commerce through our nation’s heartland.
The USCG also ensures the channel is well-marked for safe navigation of this inland river system. As water levels change, the Coast Guard sets, relocates, and recovers more than 13,000 buoys on over 7,300 miles of inland river on the Mississippi and its tributaries to mark the navigable channel. Additionally, they establish and maintain nearly 3,000 fixed navigation aids (e.g., lights and day beacons) within their areas of responsibility.
The Lower Mississippi River presents a unique challenge with water levels that can fluctuate up to 60 feet throughout the year. This fleet of Coast Guard assets utilizes National Weather Service river forecasts, data from USACE and Tennessee Valley Authority lock & dams, and information from industry partners to determine where the buoys should be placed.

Impacts to Public Health from Saltwater Intrusion
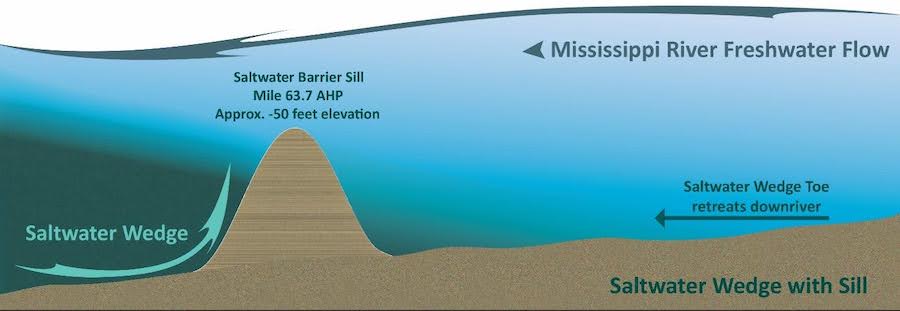
Drought and low water levels on the Lower Mississippi can impact water for communities that rely on the river for their municipal and industrial water supply. When the flow of fresh water entering the Lower Mississippi from upstream is reduced, lower-than-normal water levels can allow salt water to move upriver.
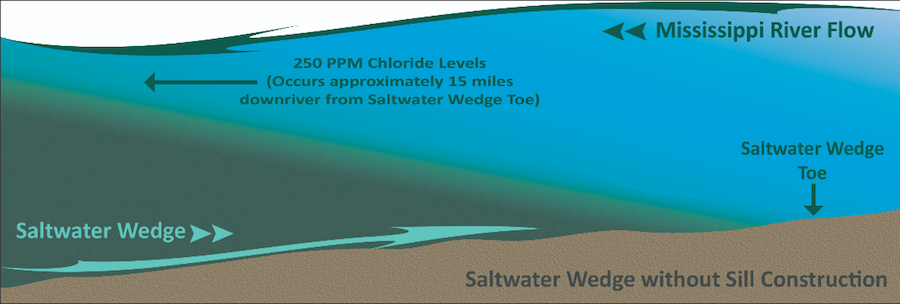
From about 15 miles downstream of Natchez, Mississippi, the river’s bottom is at a lower elevation than the water surface level in the Gulf. This lower elevation allows denser salt water to flow upstream underneath the less dense fresh river water.
If the river’s flows are extremely low, the salt water can travel even farther upstream in a phenomenon known as saltwater intrusion, which may harm local water supplies because many public drinking water systems in southeastern Louisiana rely on fresh water from the Lower Mississippi River. Regional, state, and federal partners actively monitor saltwater intrusion and conduct water quality testing to update the general public and healthcare providers about impacts to water systems and necessary precautions. The lack of fresh water flowing into the Gulf can allow salt water to make its way up the river, leading to drinking water advisories in southern Louisiana Parishes. The USACE can use barges to bring in fresh water and reverse osmosis water purification units to impacted water treatment facilities, as they did in the 2023 low water event.
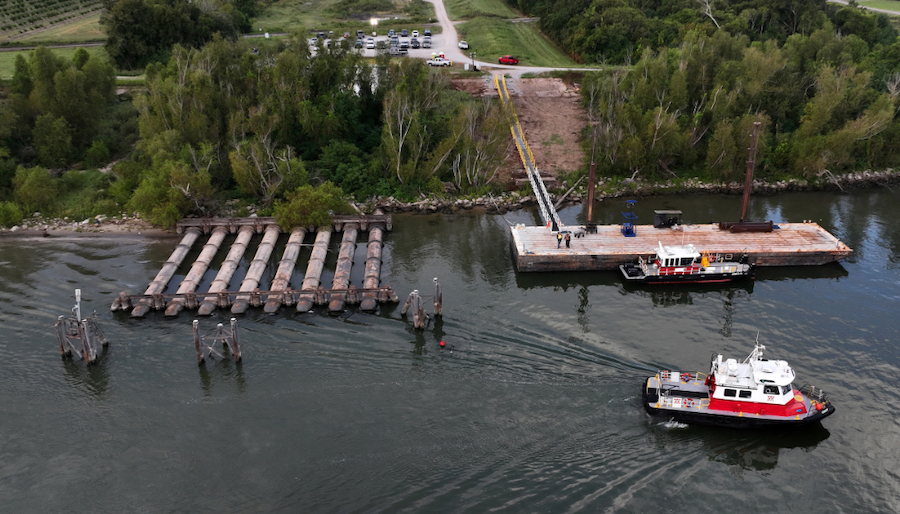
When needed, the USACE builds an underwater barrier known as a “saltwater sill” to slow the advance of salt water into the Mississippi River and protect Louisiana from saltwater intrusion. This “sill” is a temporary underwater dam to block salt water from going upstream. When freshwater flow from upstream increases, the leading edge of the saltwater wedge (also known as a "toe") retreats downriver.
Key Takeaways

Impacts to Wildlife, Recreation, and Tourism
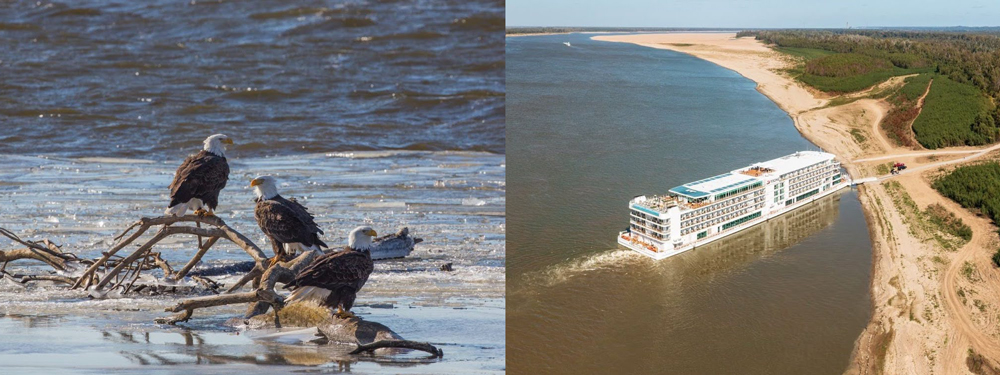
The Mississippi is a major recreational resource for boaters, hunters, anglers, and birdwatchers. Tourism and outdoor recreation, including fishing and hunting, generate nearly $17 billion in annual expenditures and provide 245,000 jobs along the Lower Mississippi River. Low water levels can have notable impacts on the river’s natural ecosystems and the economies that depend on the river. Several cruise lines that offer trips along the Lower Mississippi have been impacted by low water levels, resulting in some route changes or cancelled stops due to limited dock access.
Low river levels can also limit the amount of water available to replenish water in aquifers, such as the Mississippi River Valley Alluvial Aquifer. This can impact water available not only for agricultural purposes, but also as a water source to flood rice fields that attract migrating ducks during duck hunting season.
Low water has influenced popular bass fishing tournaments in the Lower Mississippi River, making it more challenging for anglers that must navigate shallow areas. During periods of drought, water temperatures often rise along the river due to less inflow of fresh, cool water. Some fish will find deeper pools of water to escape the warmer temperatures, where they can become trapped and further exposed to heat or predators.
Key Takeaways
For coastal wetlands and aquatic ecosystems in the Mississippi River Delta (Louisiana), drought and low flows can lead to high salinity and increased stress to plants, which can have ecological impacts. A prime example is the 2012 drought, which led to large-scale vegetation dieback and shifts in marsh plant communities in the Mississippi River Delta.
Significant attention has been given to the introduction of excess sediments and associated nutrients in the Mississippi River following rain events. Droughts, with less rainfall and runoff, result in less nutrient runoff and potentially cleaner water conditions. However, the buildup of nutrients in soils can lead to a pulse of excess nutrient runoff in following years, and potentially contribute to hypoxic (low oxygen) conditions that can lead to harmful algae blooms and fish kills in the Gulf of America.
Coastal drought can impact the salinity dynamics of creeks, rivers, and estuaries. The Coastal Salinity Index (CSI) is a long-term monitoring tool that measures relative changes in salinity for gauges along the East and Gulf Coasts.
This map shows salinity conditions over the past month compared to the historical mean. Red and orange hues indicate high saline (coastal drought, or CD) conditions, and blue hues indicate freshwater (coastal wet, or CW) conditions.
Saline Conditions
CD4: Exceptional Salinity Conditions (CSI of -2.0 or less)
Exceptional Salinity Conditions (CD4) means that this gauge has a Coastal Salinity Index (CSI) value of -2 or less. A CSI of of zero indicates historical mean salinity, and negative values indicate increasingly saline conditions. Learn more about how this index is calculated.
CD3: Extreme Salinity Conditions (CSI of -1.99 to -1.60)
Extreme Salinity Conditions (CD3) means that this gauge has a Coastal Salinity Index (CSI) value of -1.99 to -1.6. A CSI of of zero indicates historical mean salinity, and negative values indicate increasingly saline conditions. Learn more about how this index is calculated.
CD2: Severe Salinity Conditions (CSI of -1.59 to -1.30)
Severe Salinity Conditions (CD2) means that this gauge has a Coastal Salinity Index (CSI) value of -1.59 to -1.30. A CSI of of zero indicates historical mean salinity, and negative values indicate increasingly saline conditions. Learn more about how this index is calculated.
CD1: Moderate Salinity Conditions (CSI of -1.29 to -0.80)
Moderate Salinity Conditions (CD1) means that this gauge has a Coastal Salinity Index (CSI) value of -1.29 to -0.8. A CSI of of zero indicates historical mean salinity, and negative values indicate increasingly saline conditions. Learn more about how this index is calculated.
CD0: Abnormal Salinity Conditions (CSI of -0.79 to -0.50)
Abnormal Salinity Conditions (CD0) means that this gauge has a Coastal Salinity Index (CSI) value of -0.79 to -0.5. A CSI of of zero indicates historical mean salinity, and negative values indicate increasingly saline conditions. Learn more about how this index is calculated.
Normal Salinity Conditions (CSI of -0.49 to 0.50)
This gauge has a Coastal Salinity Index value between -0.49 to 0.50, which means it has near-normal saline conditions compared to the historical mean. A CSI of of zero indicates historical mean salinity, and positive values indicate increasingly freshwater conditions. Learn more about how this index is calculated.
Freshwater Conditions
CW0: Abnormal Freshwater Conditions (CSI of 0.51 to 0.80)
Abnormal Freshwater Conditions (CW0) means that this gauge has a Coastal Salinity Index (CSI) value of 0.5 to 0.8. A CSI of of zero indicates historical mean salinity, and positive values indicate increasingly freshwater conditions. Learn more about how this index is calculated.
CW1: Moderate Freshwater Conditions (CSI of 0.81 to 1.30)
Moderate Freshwater Conditions (CW1) means that this gauge has a Coastal Salinity Index (CSI) value of 0.81 to 1.3. A CSI of of zero indicates historical mean salinity, and positive values indicate increasingly freshwater conditions. Learn more about how this index is calculated.
CW2: Severe Freshwater Conditions (CSI of 1.31 to 1.60)
Severe Freshwater Conditions (CW2) means that this gauge has a Coastal Salinity Index (CSI) value of 1.31 to 1.6. A CSI of of zero indicates historical mean salinity, and positive values indicate increasingly freshwater conditions. Learn more about how this index is calculated.
CW3: Extreme Freshwater Conditions (CSI of 1.61 to 2.00)
Extreme Freshwater Conditions (CW3) means that this gauge has a Coastal Salinity Index (CSI) value of 1.61 to 2.0. A CSI of of zero indicates historical mean salinity, and positive values indicate increasingly freshwater conditions. Learn more about how this index is calculated.
CW4: Exceptional Freshwater Conditions (CSI of 2.01 or more)
Exceptional Freshwater Conditions (CW4) means that this gauge has a Coastal Salinity Index (CSI) value of more than 2.0. A CSI of of zero indicates historical mean salinity, and positive values indicate increasingly freshwater conditions. Learn more about how this index is calculated.
No Data
Coastal Salinity Index data are unavailable for this gauge.
Coastal drought can impact the salinity dynamics of creeks, rivers, and estuaries. The Coastal Salinity Index (CSI) is a long-term monitoring tool that measures relative changes in salinity for gauges along the East and Gulf Coasts.
This map shows salinity conditions over the past month compared to the historical mean. Red and orange hues indicate high saline (coastal drought, or CD) conditions, and blue hues indicate freshwater (coastal wet, or CW) conditions.
Coastal Salinity Index data are updated daily.

Monitoring and Forecasting River Levels and Flows
Numerous entities, including the U.S. Army Corps of Engineers, the U.S. Coast Guard, and the navigation industry, use real-time river monitoring and predictions of future conditions for decision-making.
Water Monitoring on the River
The U.S. Army Corps of Engineers (USACE) and the U.S. Geological Survey (USGS) maintain a network of streamgages across the entire Mississippi River Basin, which measure rivers, streams, and creeks of all sizes. This network is maintained in collaboration with a variety of federal, state, regional, and local partners. Streamgages monitor river conditions in two ways: stage (or water level) and flow. Stage measures the height of the water surface at a specific point along a stream or river. Flow (also called discharge) measures the volume of water moving down a river or stream per unit of time (often cubic feet per second). River stage is most commonly used for flood information while flow is more commonly used for drought and low water conditions. Learn more about monitoring rivers and streams.
Water Forecasting on the River
NOAA’s National Weather Service River Forecast Centers provide a suite of forecast and guidance products to communicate the probability of changes in river levels at select river locations within their forecast area. The River Forecast Centers use river level and flow data from USGS to predict possible river levels and flows in the near future. Official river forecasts are hydrographs (graphs that show how water levels change over time in a river or stream) based on precipitation forecasts (usually 24–48 hours) and current land surface and river conditions. This product provides an estimate of future river levels and flows and flood probabilities at a given location. These river level forecast products go out 5 or more days, and up to 28 days on the mainstem of the Mississippi River. All prediction and forecasting products have a level of uncertainty, which grows the further out the forecast goes.
The River Forecast Centers produce other longer-term river forecasting products, building on the North American Ensemble Forecast System (NAEFS) and the Hydrologic Ensemble Forecast System (HEFS). These products are calculated using historical and forecast river flow, temperature, precipitation to create multiple model output scenarios for future river levels and flows. NAEFS and HEFS forecasts show a range of possibilities, or “what ifs,” for the river stage forecast, grouped into confidence ranges (less likely, more likely, most likely).
Key Takeaways
This map shows current river stages (i.e., water levels above a reference elevation) from NOAA's National Water Prediction Service. Brown hues indicate a "low water" stage, green hues indicate no flooding, yellow indicates the "action" stage to prepare for flooding, and orange, red, and purple hues indicate flood conditions.
Click on a point to view more information, including interactive hydrographs and historical information from the National Water Prediction Service.
Explore river stages for key points along the Lower Mississippi River: Cairo, IL; Memphis, TN; Arkansas City, AR; Greenville, MS; Vicksburg, MS; Red River Landing, LA; Baton Rouge, LA.
This map shows 1-day average streamflow conditions for yesterday compared to historical conditions for the same day of the year. Both 1-day and historical streamflow values are calculated as mean discharge (cubic feet per second) over a 24-hour period. Only streamgages with 30 or more years of data are included in this map.
Click on a streamgage to view current data from the U.S. Geological Survey. These streamflow data are provisional and subject to revision.
Periods of drought can lead to inadequate water supply, threatening the health, safety, and welfare of communities. Streamflow, groundwater, reservoir, and snowpack data are key to monitoring and forecasting water supply.
Learn MoreExtreme weather events can interact or cascade—where one disaster event triggers or changes the probability of another event. For example, drought conditions can increase the probability of large-scale wildfires, and droughts are often accompanied by extreme heat. By including drought in multi-hazard planning, a community can consolidate its resources and develop coordinated responses before a disaster.
Learn MoreIn a drought, lower water levels or snowpack can affect the availability of recreational activities and associated tourism, and a resulting loss of revenue can severely impact supply chains and the economy. Drought—as well as negative perceptions of drought, fire bans, or wildfires—may also result in decreased visitations, cancellations in hotel stays, a reduction in booked holidays, or reduced merchandise sales.
Learn MoreDuring drought conditions that result in low water levels on rivers and other waterways, port and maritime navigation and transportation operations may be limited due to a reduction in available routes and cargo-carrying capacity, resulting in increased costs. In addition, higher temperatures that often coexist with drought can impact roads, airport runways, and rail lines.
Learn MorePeriods of drought can lead to inadequate water supply, threatening the health, safety, and welfare of communities. Streamflow, groundwater, reservoir, and snowpack data are key to monitoring and forecasting water supply.
Learn MoreDrought can alter the ecological balance of natural systems and harm fish, wildlife, and plant species, as well as the benefits that these ecosystems provide to human communities. The environmental consequences of drought include losses in plant growth; increases in fire and insect outbreaks; altered rates of carbon, nutrient, and water cycling; and local species extinctions.
Learn MoreBecause energy and water are so interdependent, the availability and predictability of water resources can directly affect energy systems. Energy professionals need information on current drought conditions and outlooks in order to make informed decisions on cooling, alternative water supplies, pricing, and infrastructure security.
Learn MoreDuring drought conditions that result in low water levels on rivers and other waterways, port and maritime navigation and transportation operations may be limited due to a reduction in available routes and cargo-carrying capacity, resulting in increased costs. In addition, higher temperatures that often coexist with drought can impact roads, airport runways, and rail lines.
Learn MoreObserved River Stages
Major Flood
According to the National Weather Service, the Major Flood stage indicates "extensive inundation of structures and roads, significant evacuations of people, and/or transfer of property to higher elevations."
Moderate Flood
According to the National Weather Service, the Moderate Flood stage indicates "some inundation of structures and roads near stream, evacuations of people, and/or transfer of property to higher elevations."
Minor Flood
According to the National Weather Service, the Minor Flood stage indicates flooding with "minimal or no property damage, but possible some public threat (e.g., inundation of roads)."
Action Stage
When a location on the river hits the Action Stage, water levels have reached a height where "action is taken in preparation for possible significant hydrological activity," according to the National Weather Service.
No Flood
According to the National Weather Service, no flooding is indicated.
Low Water Stage
According to the National Weather Service, the Low Water Threshold is the stage at which "low water levels begin to have significant negative impacts on a water-related industry or user community."
Streamflow Conditions
Record Mean Daily Low
Estimated streamflow is the lowest mean daily value recorded at this gauge on this day of the year. Learn more.
Much Below Normal (<10th Percentile)
Estimated streamflow is in the 0–10th percentile of historical streamflow values recorded at this gauge on this day of the year. Learn more.
Below Normal (10th–25th Percentile)
Estimated streamflow is in the 10th–25th percentile of historical streamflow values recorded at this gauge on this day of the year. Learn more.
Normal (25th–75th Percentile)
Estimated streamflow is in the 25th–75th percentile of historical streamflow values recorded at this gauge on this day of the year. Learn more.
Above Normal (75th–90th Percentile)
Estimated streamflow is in the 75th–90th percentile of historical streamflow values recorded at this gauge on this day of the year. Learn more.
Much Above Normal (>90th Percentile)
Estimated streamflow is in the 90th–100th percentile of historical streamflow values recorded at this gauge on this day of the year. Learn more.
Record Mean Daily High
Estimated streamflow is the highest mean daily value ever measured at this gauge on this day of the year. Learn more.
Not Ranked
A flow category has not been computed for this gauge, for example due to insufficient historical data or no current streamflow estimates.
This map shows current river stages (i.e., water levels above a reference elevation) from NOAA's National Water Prediction Service. Brown hues indicate a "low water" stage, green hues indicate no flooding, yellow indicates the "action" stage to prepare for flooding, and orange, red, and purple hues indicate flood conditions.
Click on a point to view more information, including interactive hydrographs and historical information from the National Water Prediction Service.
Explore river stages for key points along the Lower Mississippi River: Cairo, IL; Memphis, TN; Arkansas City, AR; Greenville, MS; Vicksburg, MS; Red River Landing, LA; Baton Rouge, LA.
This map shows 1-day average streamflow conditions for yesterday compared to historical conditions for the same day of the year. Both 1-day and historical streamflow values are calculated as mean discharge (cubic feet per second) over a 24-hour period. Only streamgages with 30 or more years of data are included in this map.
Click on a streamgage to view current data from the U.S. Geological Survey. These streamflow data are provisional and subject to revision.
River stage observations from the National Water Prediction Service are updated daily.
This map updates daily on Drought.gov, showing mean daily streamflow values from the previous day. View the most recent real-time streamflow data from USGS.
Periods of drought can lead to inadequate water supply, threatening the health, safety, and welfare of communities. Streamflow, groundwater, reservoir, and snowpack data are key to monitoring and forecasting water supply.
Learn MoreExtreme weather events can interact or cascade—where one disaster event triggers or changes the probability of another event. For example, drought conditions can increase the probability of large-scale wildfires, and droughts are often accompanied by extreme heat. By including drought in multi-hazard planning, a community can consolidate its resources and develop coordinated responses before a disaster.
Learn MoreIn a drought, lower water levels or snowpack can affect the availability of recreational activities and associated tourism, and a resulting loss of revenue can severely impact supply chains and the economy. Drought—as well as negative perceptions of drought, fire bans, or wildfires—may also result in decreased visitations, cancellations in hotel stays, a reduction in booked holidays, or reduced merchandise sales.
Learn MoreDuring drought conditions that result in low water levels on rivers and other waterways, port and maritime navigation and transportation operations may be limited due to a reduction in available routes and cargo-carrying capacity, resulting in increased costs. In addition, higher temperatures that often coexist with drought can impact roads, airport runways, and rail lines.
Learn MorePeriods of drought can lead to inadequate water supply, threatening the health, safety, and welfare of communities. Streamflow, groundwater, reservoir, and snowpack data are key to monitoring and forecasting water supply.
Learn MoreDrought can alter the ecological balance of natural systems and harm fish, wildlife, and plant species, as well as the benefits that these ecosystems provide to human communities. The environmental consequences of drought include losses in plant growth; increases in fire and insect outbreaks; altered rates of carbon, nutrient, and water cycling; and local species extinctions.
Learn MoreBecause energy and water are so interdependent, the availability and predictability of water resources can directly affect energy systems. Energy professionals need information on current drought conditions and outlooks in order to make informed decisions on cooling, alternative water supplies, pricing, and infrastructure security.
Learn MoreDuring drought conditions that result in low water levels on rivers and other waterways, port and maritime navigation and transportation operations may be limited due to a reduction in available routes and cargo-carrying capacity, resulting in increased costs. In addition, higher temperatures that often coexist with drought can impact roads, airport runways, and rail lines.
Learn More
Drought Monitoring and Impacts Across the Lower Mississippi Basin
Arkansas, Louisiana, and Mississippi are consistently ranked as some of the wettest states in the nation. Despite this perceived surplus of precipitation, drought can and does occur with far-reaching impacts across the three-state region beyond just water levels on the Mississippi River.
In 2023, Louisiana experienced its largest wildfire on record, driven by a combination of drought, record high temperatures, and excess fuels from trees knocked down during hurricanes in 2020 and 2021. Timber is the top crop in Louisiana, and the timber industry suffered major economic losses. All three states saw dried-up pastures and significant reductions to crop production due to the heat and loss of soil moisture in 2023, requiring additional expenses for feeding hay to cattle. The U.S. Department of Agriculture (USDA) declared emergencies and disaster designations in many counties across the region.
Monitoring Drought in the Lower Mississippi
Although some drought events can emerge relatively quickly, droughts are typically creeping, slowly emerging disasters that can be monitored over time as they develop. Monitoring drought involves observing changes in precipitation, temperature, soil moisture, streamflow, surface and groundwater supplies, snowpack, and other indicators of drought. Drought and its impacts can vary widely based on a location’s climate, hydrology, and socioeconomic factors. Identifying the types of impacts to which a region is vulnerable is important in selecting drought indicators for a particular drought monitoring and early warning process.
For example, the U.S. Drought Monitor (USDM) is a weekly map that shows the location and intensity of drought across the country using five categories. These drought categories incorporate a range of indicators and show experts’ assessments of conditions related to dryness and drought, including observations of how much water is available in streams, lakes, and soils compared to usual for the same time of year. The USDA uses the U.S. Drought Monitor map to identify drought-affected areas and trigger drought relief programs, such as eligibility for the Livestock Forage Program.
Predicting Drought in the Lower Mississippi
NOAA’s National Weather Service Climate Prediction Center (CPC) issues monthly and seasonal (3-month) outlooks relevant to drought for the U.S., which predict changes for areas currently experiencing drought and indicate areas where droughts may develop. The forecasters who develop the outlooks consider many factors, including short- and long-range forecasts, regional drought history, localized conditions, and climate patterns that can influence conditions over large areas.
Although drought typically takes months to develop, a drought can rapidly intensify (flash drought) during shorter periods of dryness and extreme heat. For example, if extreme heat is present, it may further intensify drought and its impacts through increased evaporation and transpiration, the process by which water is transferred from the land to the atmosphere. For the Lower Mississippi region, the location of and rainfall from tropical storms can also impact the severity or removal of drought during hurricane season.
Long-term drought forecasts, such as 1- or 3-month outlooks, may be impacted by unexpected individual weather systems that can only be predicted up to ten days ahead. Therefore, the confidence ( or “skill”) of a forecast decreases the further out it is predicting. The CPC provides discussions on factors that informed their forecast, and confidence levels for each U.S. region, for both the monthly and seasonal drought outlook.
Key Takeaways
The U.S. Drought Monitor depicts the location and intensity of drought across the country. The map uses 5 classifications: Abnormally Dry (D0), showing areas that may be going into or are coming out of drought, and four levels of drought (D1–D4).
This map is used by the U.S. Department of Agriculture to trigger some disaster declarations and loan eligibility. Individual states and water supply planning may use additional information to inform their declarations and actions. Learn more about the Drought Monitor.
The Standardized Precipitation Index, or SPI, measures how observed precipitation deviates from average historical conditions for a given time range. SPI is used to estimate meteorological drought conditions. This map shows the SPI for the past 3 months (90 days), based on NOAA precipitation data. Red, orange, and yellow hues indicate drier conditions, while green and blue hues indicate wetter conditions.
An accurate depiction of soil moisture conditions can provide valuable insights for agricultural monitoring, weather prediction, and drought and flood early warning.
This map shows the moisture content of the top 1 meter of soil compared to historical conditions from 1981–2013, based on NASA's Short-term Prediction and Transition Center – Land Information System (SPoRT-LIS).
Red and orange hues indicate drier soils, while greens and blues indicate greater soil moisture.
A drought index combines multiple drought indicators (e.g., precipitation, temperature, soil moisture) to depict drought conditions. For some products, like the U.S. Drought Monitor, authors combine their analysis of drought indicators with input from local observers. Other drought indices, like the Standardized Precipitation Index (SPI), use an objective calculation to describe the severity, location, timing, and/or duration of drought.
Learn MorePeriods of drought can lead to inadequate water supply, threatening the health, safety, and welfare of communities. Streamflow, groundwater, reservoir, and snowpack data are key to monitoring and forecasting water supply.
Learn MoreDrought can reduce the water availability and water quality necessary for productive farms, ranches, and grazing lands, resulting in significant negative direct and indirect economic impacts to the agricultural sector. Monitoring agricultural drought typically focuses on examining levels of precipitation, evaporative demand, soil moisture, and surface/groundwater quantity and quality.
Learn MoreA drought index combines multiple drought indicators (e.g., precipitation, temperature, soil moisture) to depict drought conditions. For some products, like the U.S. Drought Monitor, authors combine their analysis of drought indicators with input from local observers. Other drought indices, like the Standardized Precipitation Index (SPI), use an objective calculation to describe the severity, location, timing, and/or duration of drought.
Learn MoreDrought is defined as the lack of precipitation over an extended period of time, usually for a season or more, that results in a water shortage. Changes in precipitation can substantially disrupt crops and livestock, influence the frequency and intensity of severe weather events, and affect the quality and quantity of water available for municipal and industrial use.
Learn MoreSoil moisture plays an important role in drought and flood forecasting, agricultural monitoring, forest fire prediction, water supply management, and other natural resource activities. Soil moisture observations can forewarn of impending drought or flood conditions before other more standard indicators are triggered.
Learn MoreFlash drought is the rapid onset or intensification of drought. Unlike slow-evolving drought, which is caused by a decline in precipitation, flash drought occurs when low precipitation is accompanied by abnormally high temperatures, high winds, and/or changes in radiation. These sometimes-rapid changes can quickly raise evapotranspiration rates and remove available water from the landscape.
Learn MoreDrought can reduce the water availability and water quality necessary for productive farms, ranches, and grazing lands, resulting in significant negative direct and indirect economic impacts to the agricultural sector. Monitoring agricultural drought typically focuses on examining levels of precipitation, evaporative demand, soil moisture, and surface/groundwater quantity and quality.
Learn MoreDrought can result in reduced growth rates, increased stress on vegetation, and alterations or transformations to the plant community and/or the entire ecosystem. During periods of drought, plants increase their demand for water through increased evapotranspiration and longer growing seasons.
Learn MoreU.S. Drought Monitor
D0 - Abnormally Dry
Abnormally Dry (D0) indicates a region that is going into or coming out of drought, according to the U.S. Drought Monitor. View typical impacts by state.
D1 – Moderate Drought
Moderate Drought (D1) is the first of four drought categories (D1–D4), according to the U.S. Drought Monitor. View typical impacts by state.
D2 – Severe Drought
Severe Drought (D2) is the second of four drought categories (D1–D4), according to the U.S. Drought Monitor. View typical impacts by state.
D3 – Extreme Drought
Extreme Drought (D3) is the third of four drought categories (D1–D4), according to the U.S. Drought Monitor. View typical impacts by state.
D4 – Exceptional Drought
Exceptional Drought (D4) is the most intense drought category, according to the U.S. Drought Monitor. View typical impacts by state.
Dry Conditions
D4 - Exceptional Drought (SPI of -2.0 or less)
The Standardized Precipitation Index (SPI) value for this location is -2.0 or less. SPI values can be interpreted as the number of standard deviations by which the precipitation anomaly deviates from the long-term mean. An SPI of -2.0 or less indicates Exceptional Drought (D4) conditions.
D3 - Extreme Drought (SPI of -1.9 to -1.6)
The Standardized Precipitation Index (SPI) value for this location is between -1.9 to -1.6. SPI values can be interpreted as the number of standard deviations by which the precipitation anomaly deviates from the long-term mean. An SPI of -1.9 to -1.6 indicates Extreme Drought (D3) conditions.
D2 - Severe Drought (SPI of -1.5 to -1.3)
The Standardized Precipitation Index (SPI) value for this location is between -1.5 to -1.3. SPI values can be interpreted as the number of standard deviations by which the precipitation anomaly deviates from the long-term mean. An SPI of -1.5 to -1.3 indicates Severe Drought (D2) conditions.
D1 - Moderate Drought (-1.2 to -0.8)
The Standardized Precipitation Index (SPI) value for this location is between -1.2 to -0.8. SPI values can be interpreted as the number of standard deviations by which the precipitation anomaly deviates from the long-term mean. An SPI of -1.2 to -0.8 indicates Moderate Drought (D1) conditions.
D0 - Abnormally Dry (SPI of -0.7 to -0.5)
The Standardized Precipitation Index (SPI) value for this location is between -0.7 to -0.5. SPI values can be interpreted as the number of standard deviations by which the precipitation anomaly deviates from the long-term mean. An SPI of -0.7 to -0.5 indicates Abnormally Dry (D0) conditions.
Wet Conditions
W0 (0.5 to 0.7)
The Standardized Precipitation Index (SPI) value for this location is between 0.5 to 0.7, indicating abnormally wet (W0) conditions.
W1 (0.8 to 1.2)
The Standardized Precipitation Index (SPI) value for this location is between 0.8 to 1.2, indicating moderate wet (W1) conditions.
W2 (1.3 to 1.5)
The Standardized Precipitation Index (SPI) value for this location is between 1.3 to 1.5, indicating severe wet (W2) conditions.
W3 (1.6 to 1.9)
The Standardized Precipitation Index (SPI) value for this location is between 1.6 to 1.9, indicating extreme wet (W3) conditions.
W4 (2.0 or more)
The Standardized Precipitation Index (SPI) value for this location is 2.0 or greater, indicating exceptional wet (W4) conditions.
0–100 cm Soil Moisture Percentile
0–2nd Percentile
Soil moisture at 0–100cm depth is in the bottom 2% (0–2nd percentile) of historical measurements for this day of the year. Learn more.
2nd–5th Percentile
Soil moisture at 0–100cm depth falls between the 2nd to 5th percentile of historical measurements for this day of the year. Learn more.
5th–10th Percentile
Soil moisture at 0–100cm depth falls between the 5th to 10th percentile of historical measurements for this day of the year. Learn more.
10th–20th Percentile
Soil moisture at 0–100cm depth falls between the 10th to 20th percentile of historical measurements for this day of the year. Learn more.
20th–30th Percentile
Soil moisture at 0–100cm depth falls between the 20th to 30th percentile of historical measurements for this day of the year. Learn more.
30th–70th Percentile
Soil moisture at 0–100cm depth falls between the 30th to 70th percentile of historical measurements for this day of the year. Learn more.
70th–80th Percentile
Soil moisture at 0–100cm depth falls between the 70th to 80th percentile of historical measurements for this day of the year. Learn more.
80th–90th Percentile
Soil moisture at 0–100cm depth falls between the 80th to 90th percentile of historical measurements for this day of the year. Learn more.
90th–95th Percentile
Soil moisture at 0–100cm depth falls between the 90th to 95th percentile of historical measurements for this day of the year. Learn more.
95th–98th Percentile
Soil moisture at 0–100cm depth falls between the 95th to 98th percentile of historical measurements for this day of the year. Learn more.
98th–100th Percentile
Soil moisture at 0–100cm depth is in the top 2% (98th to 100th percentile) of historical measurements for this day of the year. Learn more.
The U.S. Drought Monitor depicts the location and intensity of drought across the country. The map uses 5 classifications: Abnormally Dry (D0), showing areas that may be going into or are coming out of drought, and four levels of drought (D1–D4).
This map is used by the U.S. Department of Agriculture to trigger some disaster declarations and loan eligibility. Individual states and water supply planning may use additional information to inform their declarations and actions. Learn more about the Drought Monitor.
The Standardized Precipitation Index, or SPI, measures how observed precipitation deviates from average historical conditions for a given time range. SPI is used to estimate meteorological drought conditions. This map shows the SPI for the past 3 months (90 days), based on NOAA precipitation data. Red, orange, and yellow hues indicate drier conditions, while green and blue hues indicate wetter conditions.
An accurate depiction of soil moisture conditions can provide valuable insights for agricultural monitoring, weather prediction, and drought and flood early warning.
This map shows the moisture content of the top 1 meter of soil compared to historical conditions from 1981–2013, based on NASA's Short-term Prediction and Transition Center – Land Information System (SPoRT-LIS).
Red and orange hues indicate drier soils, while greens and blues indicate greater soil moisture.
This map is released every Thursday morning, with data valid through Tuesday at 7am Eastern.
SPI data are updated daily, with a delay of 3–4 days.
This map updates daily with data from NASA's Short-term Prediction and Transition Center – Land Information System (SPoRT-LIS).
A drought index combines multiple drought indicators (e.g., precipitation, temperature, soil moisture) to depict drought conditions. For some products, like the U.S. Drought Monitor, authors combine their analysis of drought indicators with input from local observers. Other drought indices, like the Standardized Precipitation Index (SPI), use an objective calculation to describe the severity, location, timing, and/or duration of drought.
Learn MorePeriods of drought can lead to inadequate water supply, threatening the health, safety, and welfare of communities. Streamflow, groundwater, reservoir, and snowpack data are key to monitoring and forecasting water supply.
Learn MoreDrought can reduce the water availability and water quality necessary for productive farms, ranches, and grazing lands, resulting in significant negative direct and indirect economic impacts to the agricultural sector. Monitoring agricultural drought typically focuses on examining levels of precipitation, evaporative demand, soil moisture, and surface/groundwater quantity and quality.
Learn MoreA drought index combines multiple drought indicators (e.g., precipitation, temperature, soil moisture) to depict drought conditions. For some products, like the U.S. Drought Monitor, authors combine their analysis of drought indicators with input from local observers. Other drought indices, like the Standardized Precipitation Index (SPI), use an objective calculation to describe the severity, location, timing, and/or duration of drought.
Learn MoreDrought is defined as the lack of precipitation over an extended period of time, usually for a season or more, that results in a water shortage. Changes in precipitation can substantially disrupt crops and livestock, influence the frequency and intensity of severe weather events, and affect the quality and quantity of water available for municipal and industrial use.
Learn MoreSoil moisture plays an important role in drought and flood forecasting, agricultural monitoring, forest fire prediction, water supply management, and other natural resource activities. Soil moisture observations can forewarn of impending drought or flood conditions before other more standard indicators are triggered.
Learn MoreFlash drought is the rapid onset or intensification of drought. Unlike slow-evolving drought, which is caused by a decline in precipitation, flash drought occurs when low precipitation is accompanied by abnormally high temperatures, high winds, and/or changes in radiation. These sometimes-rapid changes can quickly raise evapotranspiration rates and remove available water from the landscape.
Learn MoreDrought can reduce the water availability and water quality necessary for productive farms, ranches, and grazing lands, resulting in significant negative direct and indirect economic impacts to the agricultural sector. Monitoring agricultural drought typically focuses on examining levels of precipitation, evaporative demand, soil moisture, and surface/groundwater quantity and quality.
Learn MoreDrought can result in reduced growth rates, increased stress on vegetation, and alterations or transformations to the plant community and/or the entire ecosystem. During periods of drought, plants increase their demand for water through increased evapotranspiration and longer growing seasons.
Learn More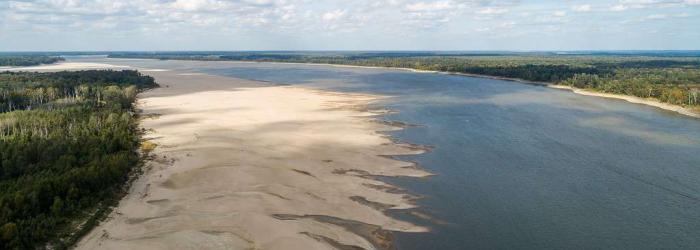
The Mississippi River Basin Drought & Water Dashboard provides a suite of curated and customized drought information, tools, and data to support communications and decision-making across the Mississippi River Basin. This federal resource was created to assist state, tribal, and local governments; the private sector; and the public to proactively prepare for and mitigate the impacts of drought and low water in their communities.
The Dashboard is the result of cross-agency collaboration between NOAA's National Integrated Drought Information System (NIDIS), National Centers for Environmental Information, and National Weather Service; the U.S. Army Corps of Engineers; the U.S. Coast Guard; the U.S. Geological Survey; and state and local partners. NIDIS is an interagency program within the Climate Program Office, which is part of NOAA's Office of Oceanic and Atmospheric Research. NIDIS launched the Dashboard in 2025 following extensive outreach to gather feedback from the Mississippi River Basin region, and may modify the Dashboard as new information and tools are available.