U.S. flag

An official website of the United States government

Site Section
Data & Maps

USGS WaterWatch Streamflow Data

Associated Agencies

United States Geological Survey (USGS)

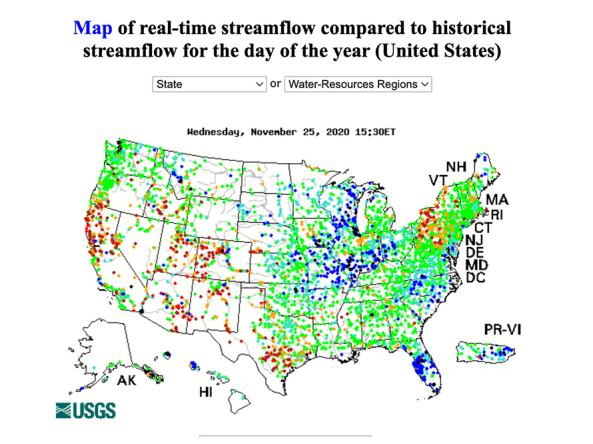
WaterWatch is a U.S. Geological Survey (USGS) website that displays real-time, recent, and past streamflow conditions for the United States. The real-time information generally is updated on an hourly basis. WaterWatch provides streamgage-based maps that show the location of more than 3,000 long-term (30 years or more) USGS streamgages; use colors to represent streamflow conditions compared to historical streamflow; feature a point-and-click interface allowing users to retrieve graphs of stream stage (water elevation) and flow; and highlight locations where extreme hydrologic events, such as floods and droughts, are occurring.

WaterWatch also provides hydrologic unit code (HUC) maps. HUC-based maps are derived from the streamgage-based maps and illustrate streamflow conditions in hydrologic regions. These maps show average streamflow conditions for 1-, 7-, 14-, and 28-day periods, and for monthly average streamflow; highlight regions of low flow or hydrologic drought; and provide historical runoff and streamflow conditions beginning in 1901.

Interactive Map: Streamflow Conditions

Streamflow Conditions
Value Map Hex Color Description
Low #ff0000 Record Low Estimated streamflow is the lowest value recorded at this gauge on this day of the year. Learn more.
Much Below #b12121 Much Below Normal ( Estimated streamflow is in the 0–10th percentile of historical streamflow values recorded at this gauge on this day of the year. Learn more.
Below #ffa400 Below Normal (10th–25th Percentile) Estimated streamflow is in the 10th–25th percentile of historical streamflow values recorded at this gauge on this day of the year. Learn more.
Normal #00ff00 Normal (25th–75th Percentile) Estimated streamflow is in the 25th–75th percentile of historical streamflow values recorded at this gauge on this day of the year. Learn more.
Value Map Hex Color Description
Above #40dfd0 Above Normal (75th–90th Percentile) Estimated streamflow is in the 75th–90th percentile of historical streamflow values recorded at this gauge on this day of the year. Learn more.
Much Above #0000ff Much Above Normal (>90th Percentile) Estimated streamflow is in the 90th–100th percentile of historical streamflow values recorded at this gauge on this day of the year. Learn more.
High #000000 Record High Estimated streamflow is the highest value ever measured at this gauge on this day of the year. Learn more.
Not Ranked #ffffff Not Ranked A flow category has not been computed for this gauge, for example due to insufficient historical data or no current streamflow estimates.

How to

How to use this site:

  • Use the dropdown menus to view streamflow conditions for the entire U.S. or by state or water resource region. You can view maps, tables, and time series graphs.
  • Streamflow data are available in real-time or daily data, or as a 7-day, 14-day, 28-day, or monthly average.
  • Streamflow conditions are displayed based on percentile classes—a value on a scale of one hundred that indicates the percent of a distribution that is equal to or below it. In general:
    • A streamflow which is greater than the 75th percentile is considered above normal.
    • A streamflow which is between 25th and 75th percentiles is considered normal.
    • A streamflow which is less than the 25 percentile is considered below normal.