Mississippi River Basin Drought & Water Dashboard
Explore timely and reliable information on past, present, and future drought conditions to increase drought early warning capacity and support decision-making across the Mississippi River Basin.
wettest June on record, over the past 132 years for the Greater Mississippi River Basin
driest year to date over the past 132 years (January-May 2026) for the Greater Mississippi River Basin
Current River Conditions for the Greater Mississippi River Basin
The Mississippi River is one of the world’s largest commercial waterways, provides drinking water for 18 million people, and is home to hundreds of animal species. Low water levels in the Upper Mississippi and tributaries can have a profound impact on water levels in the Lower Mississippi—impacting the transportation and maritime industry, public health, and ecosystems. Below, explore current river stages (i.e., water levels) and flow for the Mississippi River and its major tributaries. Learn how specific tributaries contribute to the overall water flow in the Mississippi River.
This map shows current river stages (i.e., water levels above a reference elevation) from NOAA's National Water Prediction Service. Brown hues indicate a "low water" stage, green hues indicate no flooding, yellow indicates the "action" stage to prepare for flooding, and orange, red, and purple hues indicate flood conditions.
Click on a point to view more information, including interactive hydrographs and historical information from the National Water Prediction Service.
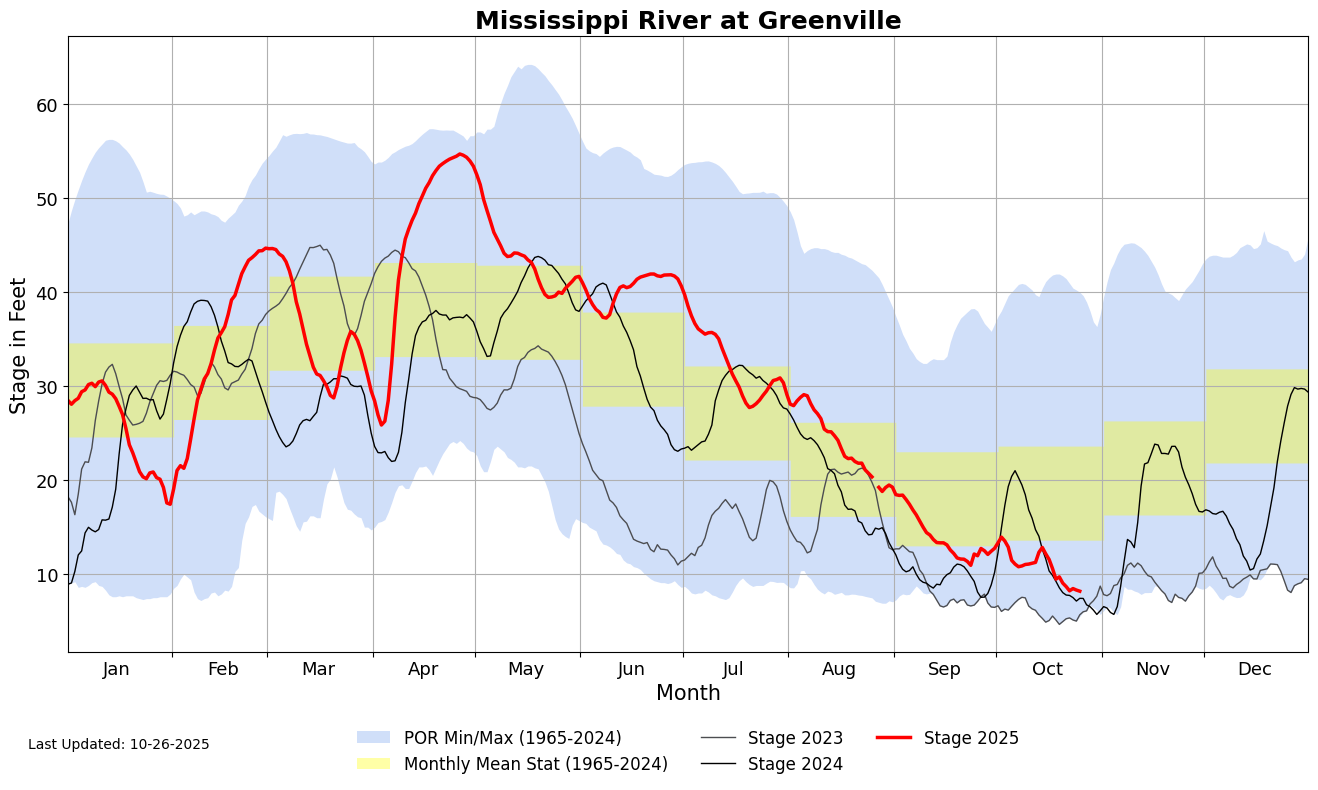
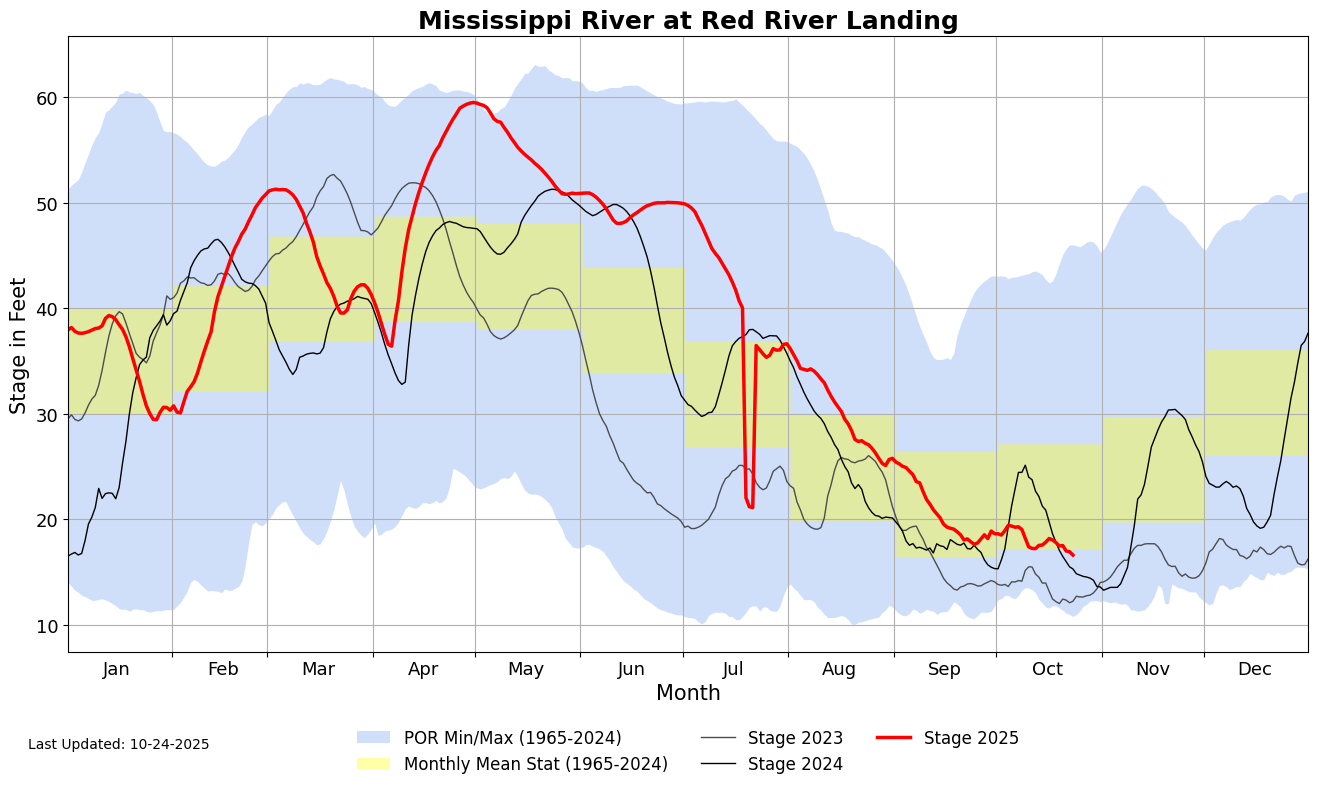
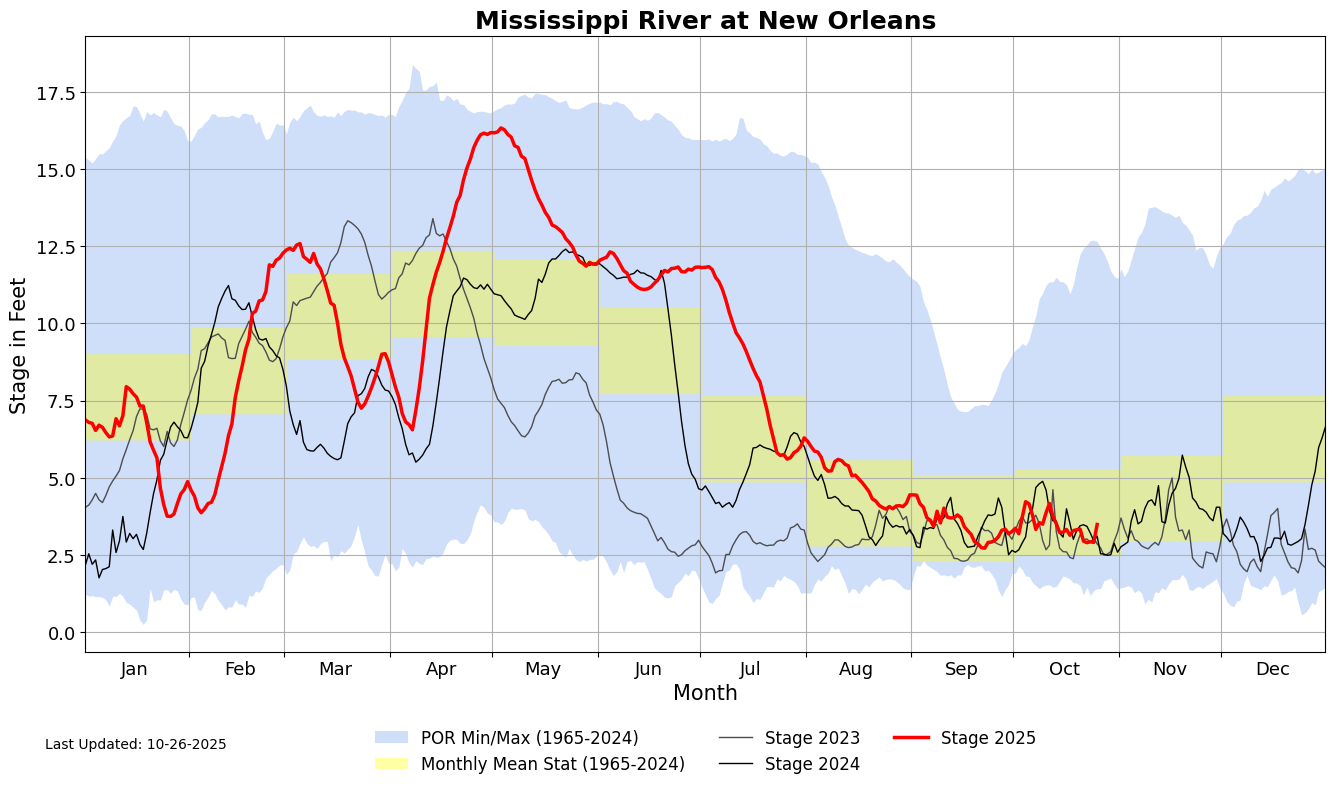
Explore river stages for key points along the Lower Mississippi River: Cairo, IL; Memphis, TN; Arkansas City, AR; Greenville, MS; Vicksburg, MS; Red River Landing, LA; Baton Rouge, LA.
This map show U.S. Army Corps monitoring stations along the Mississippi River. Click on a point to view an updated hydrograph (a graph that show how water levels change over time) for that location.
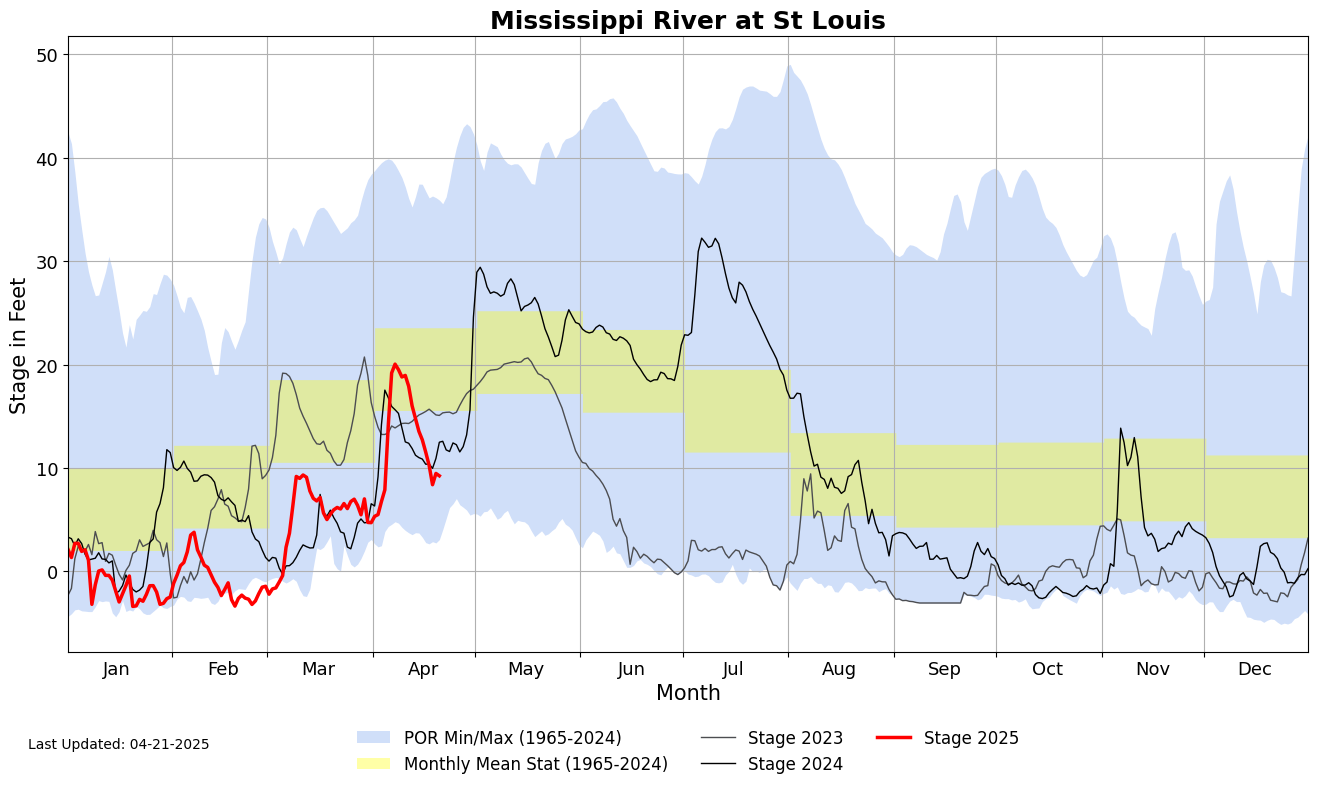
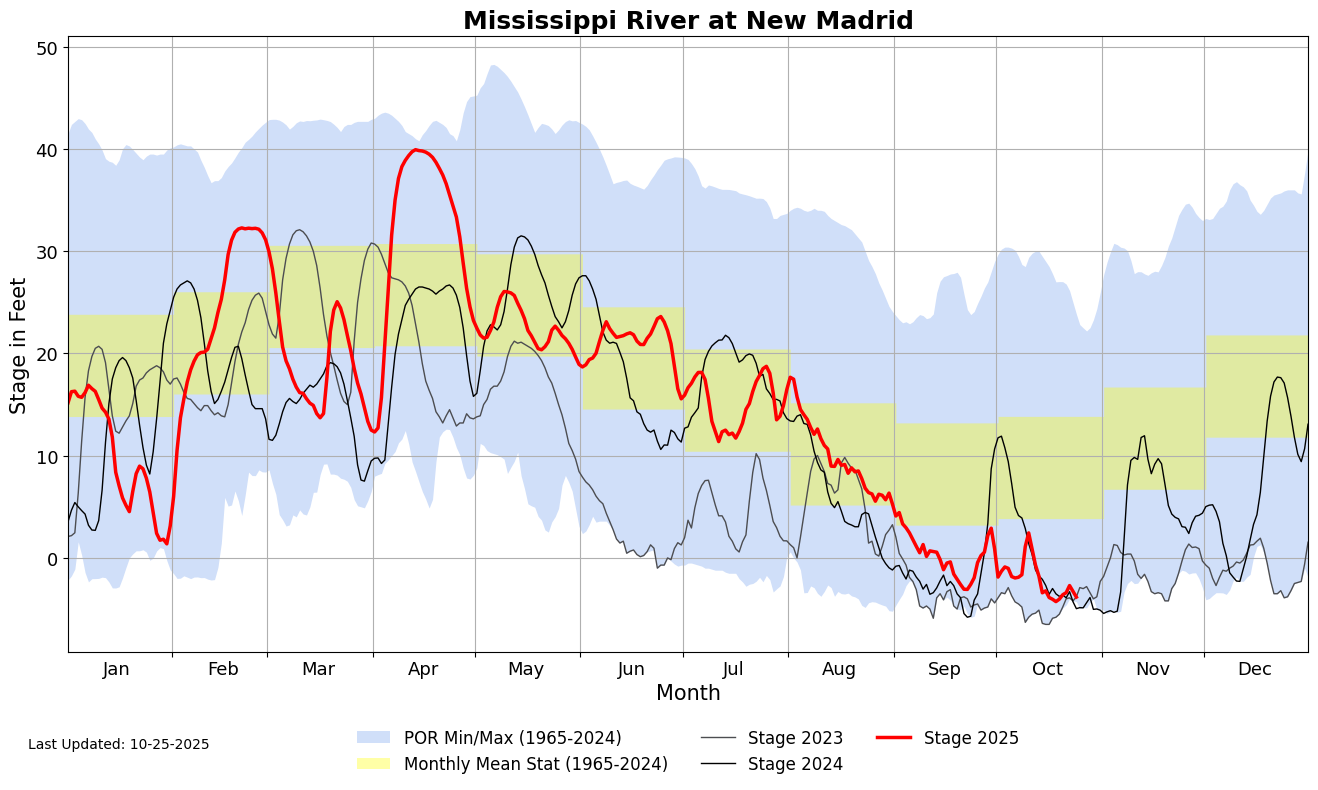
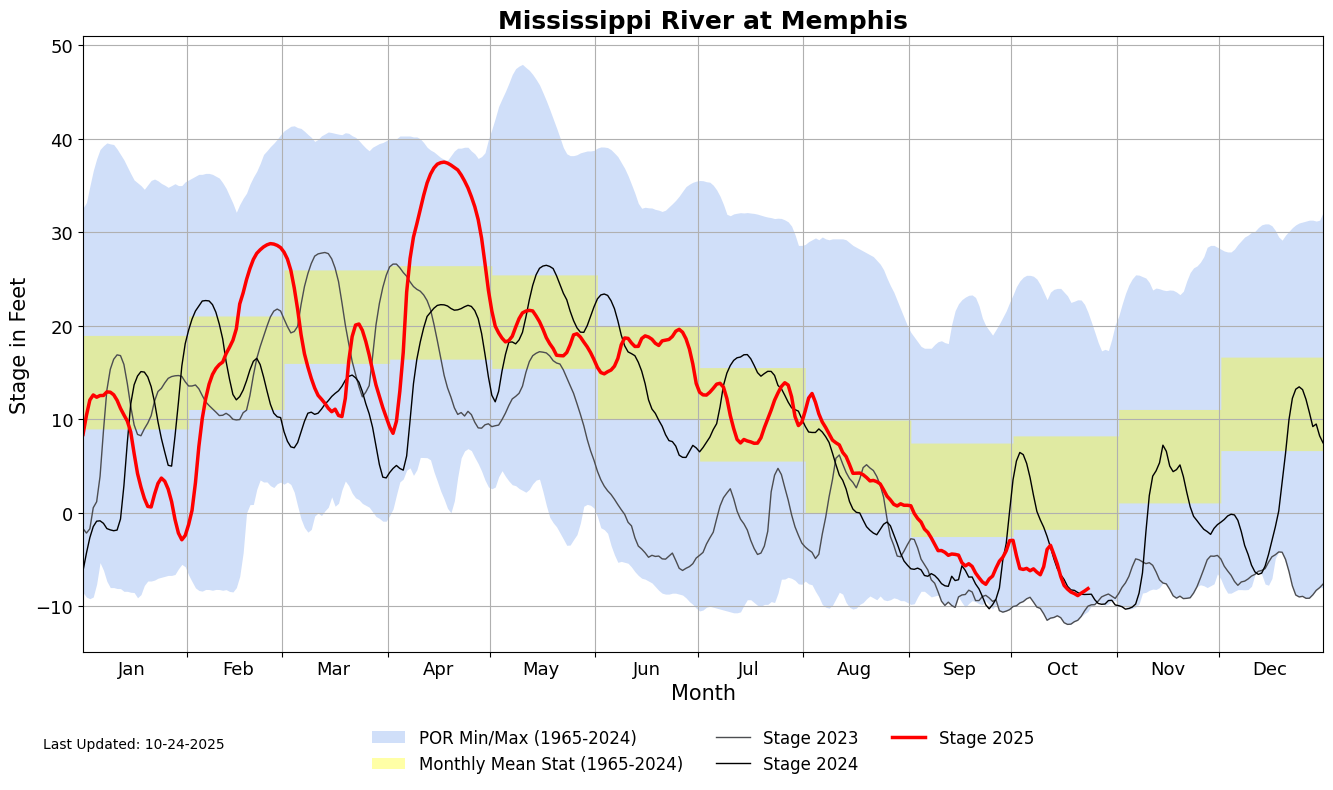
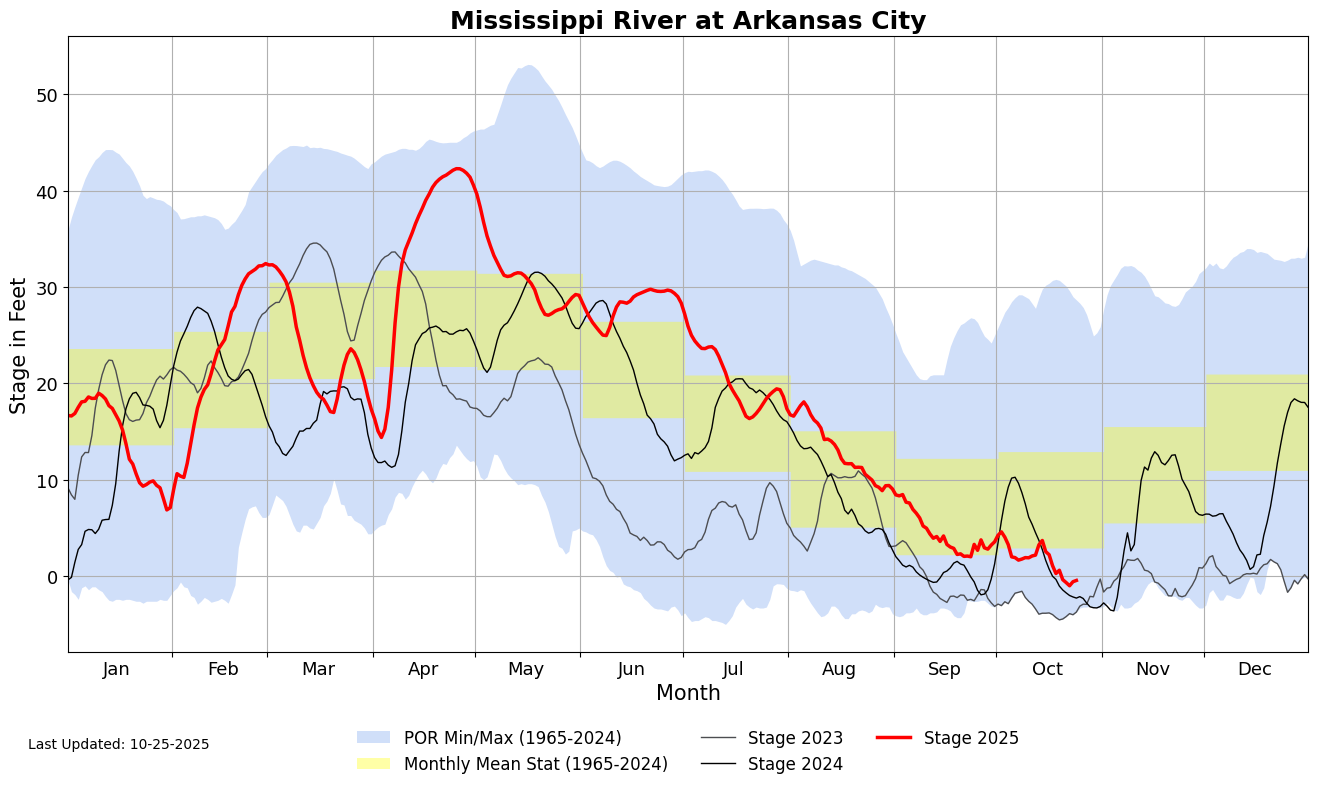
Each hydrograph shows river stages (in feet) for this year to date compared to recent past years and record minimum/maximum levels for that location (since 1965).
View all comparative hydrographs from the U.S. Army Corps of Engineers: St. Paul, MN; Rock Island, IL; Hermann, MO; St. Louis, MO; Cape Girardeau, MO; Cairo, IL; New Madrid, MO; Memphis, TN; Arkansas City, AR; Greenville, MS; Vicksburg, MS; Natchez, MS; Red River Landing, LA; Baton Rouge, LA; New Orleans, LA.
This map shows 1-day average streamflow conditions for yesterday compared to historical conditions for the same day of the year. Both 1-day and historical streamflow values are calculated as mean discharge (cubic feet per second) over a 24-hour period. Only streamgages with 30 or more years of data are included in this map.
Click on a streamgage to view current data from the U.S. Geological Survey. These streamflow data are provisional and subject to revision.
Periods of drought can lead to inadequate water supply, threatening the health, safety, and welfare of communities. Streamflow, groundwater, reservoir, and snowpack data are key to monitoring and forecasting water supply.
Learn MoreExtreme weather events can interact or cascade—where one disaster event triggers or changes the probability of another event. For example, drought conditions can increase the probability of large-scale wildfires, and droughts are often accompanied by extreme heat. By including drought in multi-hazard planning, a community can consolidate its resources and develop coordinated responses before a disaster.
Learn MoreIn a drought, lower water levels or snowpack can affect the availability of recreational activities and associated tourism, and a resulting loss of revenue can severely impact supply chains and the economy. Drought—as well as negative perceptions of drought, fire bans, or wildfires—may also result in decreased visitations, cancellations in hotel stays, a reduction in booked holidays, or reduced merchandise sales.
Learn MoreDuring drought conditions that result in low water levels on rivers and other waterways, port and maritime navigation and transportation operations may be limited due to a reduction in available routes and cargo-carrying capacity, resulting in increased costs. In addition, higher temperatures that often coexist with drought can impact roads, airport runways, and rail lines.
Learn MorePeriods of drought can lead to inadequate water supply, threatening the health, safety, and welfare of communities. Streamflow, groundwater, reservoir, and snowpack data are key to monitoring and forecasting water supply.
Learn MoreDrought can alter the ecological balance of natural systems and harm fish, wildlife, and plant species, as well as the benefits that these ecosystems provide to human communities. The environmental consequences of drought include losses in plant growth; increases in fire and insect outbreaks; altered rates of carbon, nutrient, and water cycling; and local species extinctions.
Learn MoreBecause energy and water are so interdependent, the availability and predictability of water resources can directly affect energy systems. Energy professionals need information on current drought conditions and outlooks in order to make informed decisions on cooling, alternative water supplies, pricing, and infrastructure security.
Learn MoreDuring drought conditions that result in low water levels on rivers and other waterways, port and maritime navigation and transportation operations may be limited due to a reduction in available routes and cargo-carrying capacity, resulting in increased costs. In addition, higher temperatures that often coexist with drought can impact roads, airport runways, and rail lines.
Learn MoreObserved River Stages
Major Flood
According to the National Weather Service, the Major Flood stage indicates "extensive inundation of structures and roads, significant evacuations of people, and/or transfer of property to higher elevations."
Moderate Flood
According to the National Weather Service, the Moderate Flood stage indicates "some inundation of structures and roads near stream, evacuations of people, and/or transfer of property to higher elevations."
Minor Flood
According to the National Weather Service, the Minor Flood stage indicates flooding with "minimal or no property damage, but possible some public threat (e.g., inundation of roads)."
Action Stage
When a location on the river hits the Action Stage, water levels have reached a height where "action is taken in preparation for possible significant hydrological activity," according to the National Weather Service.
No Flood
According to the National Weather Service, no flooding is indicated.
Low Water Stage
According to the National Weather Service, the Low Water Threshold is the stage at which "low water levels begin to have significant negative impacts on a water-related industry or user community."
River Gauge
Streamflow Conditions
Record Mean Daily Low
Estimated streamflow is the lowest mean daily value recorded at this gauge on this day of the year. Learn more.
Much Below Normal (<10th Percentile)
Estimated streamflow is in the 0–10th percentile of historical streamflow values recorded at this gauge on this day of the year. Learn more.
Below Normal (10th–25th Percentile)
Estimated streamflow is in the 10th–25th percentile of historical streamflow values recorded at this gauge on this day of the year. Learn more.
Normal (25th–75th Percentile)
Estimated streamflow is in the 25th–75th percentile of historical streamflow values recorded at this gauge on this day of the year. Learn more.
Above Normal (75th–90th Percentile)
Estimated streamflow is in the 75th–90th percentile of historical streamflow values recorded at this gauge on this day of the year. Learn more.
Much Above Normal (>90th Percentile)
Estimated streamflow is in the 90th–100th percentile of historical streamflow values recorded at this gauge on this day of the year. Learn more.
Record Mean Daily High
Estimated streamflow is the highest mean daily value ever measured at this gauge on this day of the year. Learn more.
Not Ranked
A flow category has not been computed for this gauge, for example due to insufficient historical data or no current streamflow estimates.
This map shows current river stages (i.e., water levels above a reference elevation) from NOAA's National Water Prediction Service. Brown hues indicate a "low water" stage, green hues indicate no flooding, yellow indicates the "action" stage to prepare for flooding, and orange, red, and purple hues indicate flood conditions.
Click on a point to view more information, including interactive hydrographs and historical information from the National Water Prediction Service.
Explore river stages for key points along the Lower Mississippi River: Cairo, IL; Memphis, TN; Arkansas City, AR; Greenville, MS; Vicksburg, MS; Red River Landing, LA; Baton Rouge, LA.
This map show U.S. Army Corps monitoring stations along the Mississippi River. Click on a point to view an updated hydrograph (a graph that show how water levels change over time) for that location.
Each hydrograph shows river stages (in feet) for this year to date compared to recent past years and record minimum/maximum levels for that location (since 1965).
View all comparative hydrographs from the U.S. Army Corps of Engineers: St. Paul, MN; Rock Island, IL; Hermann, MO; St. Louis, MO; Cape Girardeau, MO; Cairo, IL; New Madrid, MO; Memphis, TN; Arkansas City, AR; Greenville, MS; Vicksburg, MS; Natchez, MS; Red River Landing, LA; Baton Rouge, LA; New Orleans, LA.
This map shows 1-day average streamflow conditions for yesterday compared to historical conditions for the same day of the year. Both 1-day and historical streamflow values are calculated as mean discharge (cubic feet per second) over a 24-hour period. Only streamgages with 30 or more years of data are included in this map.
Click on a streamgage to view current data from the U.S. Geological Survey. These streamflow data are provisional and subject to revision.
River stage observations from the National Water Prediction Service are updated daily.
The U.S. Army Corps of Engineers updates these comparative hydrographs daily.
This map updates daily on Drought.gov, showing mean daily streamflow values from the previous day. View the most recent real-time streamflow data from USGS.
Periods of drought can lead to inadequate water supply, threatening the health, safety, and welfare of communities. Streamflow, groundwater, reservoir, and snowpack data are key to monitoring and forecasting water supply.
Learn MoreExtreme weather events can interact or cascade—where one disaster event triggers or changes the probability of another event. For example, drought conditions can increase the probability of large-scale wildfires, and droughts are often accompanied by extreme heat. By including drought in multi-hazard planning, a community can consolidate its resources and develop coordinated responses before a disaster.
Learn MoreIn a drought, lower water levels or snowpack can affect the availability of recreational activities and associated tourism, and a resulting loss of revenue can severely impact supply chains and the economy. Drought—as well as negative perceptions of drought, fire bans, or wildfires—may also result in decreased visitations, cancellations in hotel stays, a reduction in booked holidays, or reduced merchandise sales.
Learn MoreDuring drought conditions that result in low water levels on rivers and other waterways, port and maritime navigation and transportation operations may be limited due to a reduction in available routes and cargo-carrying capacity, resulting in increased costs. In addition, higher temperatures that often coexist with drought can impact roads, airport runways, and rail lines.
Learn MorePeriods of drought can lead to inadequate water supply, threatening the health, safety, and welfare of communities. Streamflow, groundwater, reservoir, and snowpack data are key to monitoring and forecasting water supply.
Learn MoreDrought can alter the ecological balance of natural systems and harm fish, wildlife, and plant species, as well as the benefits that these ecosystems provide to human communities. The environmental consequences of drought include losses in plant growth; increases in fire and insect outbreaks; altered rates of carbon, nutrient, and water cycling; and local species extinctions.
Learn MoreBecause energy and water are so interdependent, the availability and predictability of water resources can directly affect energy systems. Energy professionals need information on current drought conditions and outlooks in order to make informed decisions on cooling, alternative water supplies, pricing, and infrastructure security.
Learn MoreDuring drought conditions that result in low water levels on rivers and other waterways, port and maritime navigation and transportation operations may be limited due to a reduction in available routes and cargo-carrying capacity, resulting in increased costs. In addition, higher temperatures that often coexist with drought can impact roads, airport runways, and rail lines.
Learn MoreFuture River Conditions for the Greater Mississippi River Basin
Within NOAA's National Weather Service, River Forecast Centers produce the official river forecasts based on current land surface and river conditions and incorporate 24–48-hour forecast precipitation. The river stages are generally forecast out for 5 days and up to 28 days on the mainstem of the Mississippi River. A given water level might be “normal” at one location but exceptionally low at another, and forecast river levels are categorized into “stages” to provide context. Learn more about river forecasts.
This map shows forecast river stages (i.e., water levels above a reference elevation) from NOAA's National Water Prediction Service. The colored points show when NOAA's official river forecasts predict a "low water" conditions (brown hues), no flooding (green hues), river levels in the "action" stage to prepare for flooding (yellow hues), and flood conditions (orange, red, and purple hues).
Click on a point to view more information, including interactive hydrographs and additional forecasts, from the National Water Prediction Service.
Periods of drought can lead to inadequate water supply, threatening the health, safety, and welfare of communities. Streamflow, groundwater, reservoir, and snowpack data are key to monitoring and forecasting water supply.
Learn MoreExtreme weather events can interact or cascade—where one disaster event triggers or changes the probability of another event. For example, drought conditions can increase the probability of large-scale wildfires, and droughts are often accompanied by extreme heat. By including drought in multi-hazard planning, a community can consolidate its resources and develop coordinated responses before a disaster.
Learn MoreIn a drought, lower water levels or snowpack can affect the availability of recreational activities and associated tourism, and a resulting loss of revenue can severely impact supply chains and the economy. Drought—as well as negative perceptions of drought, fire bans, or wildfires—may also result in decreased visitations, cancellations in hotel stays, a reduction in booked holidays, or reduced merchandise sales.
Learn MoreDuring drought conditions that result in low water levels on rivers and other waterways, port and maritime navigation and transportation operations may be limited due to a reduction in available routes and cargo-carrying capacity, resulting in increased costs. In addition, higher temperatures that often coexist with drought can impact roads, airport runways, and rail lines.
Learn MoreMaximum Forecast River Stage
Major Flood
According to the National Weather Service, the Major Flood stage indicates "extensive inundation of structures and roads, significant evacuations of people, and/or transfer of property to higher elevations."
Moderate Flood
According to the National Weather Service, the Moderate Flood stage indicates "some inundation of structures and roads near stream, evacuations of people, and/or transfer of property to higher elevations."
Minor Flood
According to the National Weather Service, the Minor Flood stage indicates flooding with "minimal or no property damage, but possible some public threat (e.g., inundation of roads)."
Action Stage
When a location on the river hits the Action Stage, water levels have reached a height where "action is taken in preparation for possible significant hydrological activity," according to the National Weather Service.
No Flood
According to the National Weather Service, no flooding is indicated.
Low Water
According to the National Weather Service, the Low Water Threshold is the stage at which "low water levels begin to have significant negative impacts on a water-related industry or user community."
This map shows forecast river stages (i.e., water levels above a reference elevation) from NOAA's National Water Prediction Service. The colored points show when NOAA's official river forecasts predict a "low water" conditions (brown hues), no flooding (green hues), river levels in the "action" stage to prepare for flooding (yellow hues), and flood conditions (orange, red, and purple hues).
Click on a point to view more information, including interactive hydrographs and additional forecasts, from the National Water Prediction Service.
River gauge forecasts from the National Weather Service are updated daily.
Periods of drought can lead to inadequate water supply, threatening the health, safety, and welfare of communities. Streamflow, groundwater, reservoir, and snowpack data are key to monitoring and forecasting water supply.
Learn MoreExtreme weather events can interact or cascade—where one disaster event triggers or changes the probability of another event. For example, drought conditions can increase the probability of large-scale wildfires, and droughts are often accompanied by extreme heat. By including drought in multi-hazard planning, a community can consolidate its resources and develop coordinated responses before a disaster.
Learn MoreIn a drought, lower water levels or snowpack can affect the availability of recreational activities and associated tourism, and a resulting loss of revenue can severely impact supply chains and the economy. Drought—as well as negative perceptions of drought, fire bans, or wildfires—may also result in decreased visitations, cancellations in hotel stays, a reduction in booked holidays, or reduced merchandise sales.
Learn MoreDuring drought conditions that result in low water levels on rivers and other waterways, port and maritime navigation and transportation operations may be limited due to a reduction in available routes and cargo-carrying capacity, resulting in increased costs. In addition, higher temperatures that often coexist with drought can impact roads, airport runways, and rail lines.
Learn MoreCurrent Drought & Climate Conditions for the Greater Mississippi River Basin
Drought’s impacts extend far beyond low water levels, such as increased wildfire risk and lower soil moisture, as well as widespread agricultural impacts, including reduced crop production and dried out pastures for livestock. Monitoring drought involves observing changes in precipitation, temperature, soil moisture, streamflow, surface and groundwater supplies, snowpack, and other indicators of drought. Learn more about monitoring and predicting drought.
The U.S. Drought Monitor depicts the location and intensity of drought across the country. The map uses 5 classifications: Abnormally Dry (D0), showing areas that may be going into or are coming out of drought, and four levels of drought (D1–D4).
This map is used by the U.S. Department of Agriculture to trigger some disaster declarations and loan eligibility. Individual states and water supply planning may use additional information to inform their declarations and actions. Learn more about the Drought Monitor.
The U.S. Drought Monitor 4-week change map shows where drought has improved, remained the same, or worsened since the previous month's U.S. Drought Monitor.
The U.S. Drought Monitor depicts the location and intensity of drought across the country, using 5 classifications (D0–D4). Green hues show where conditions improved, yellow/orange hues show where conditions worsened, and gray areas show where drought remained the same.
The Standardized Precipitation Index, or SPI, measures how observed precipitation deviates from average historical conditions for a given time range. SPI is used to estimate meteorological drought conditions. This map shows the SPI for the past 3 months (90 days), based on NOAA precipitation data. Red, orange, and yellow hues indicate drier conditions, while green and blue hues indicate wetter conditions.
The Evaporative Demand Drought Index (EDDI) is a drought monitoring tool that shows the anomaly in daily evaporative demand over a given period of time. Evaporative demand is the atmospheric influence on the drying of the landscape, or "the thirst of the atmosphere." Unusually high evaporative demand can lead to moisture stress on the land surface, and ultimately to drought—even when precipitation has been near-normal.
EDDI can serve as an indicator of both rapidly evolving "flash" droughts and sustained droughts and can offer early warning of agricultural drought, hydrologic drought, and fire-weather risk.
A drought index combines multiple drought indicators (e.g., precipitation, temperature, soil moisture) to depict drought conditions. For some products, like the U.S. Drought Monitor, authors combine their analysis of drought indicators with input from local observers. Other drought indices, like the Standardized Precipitation Index (SPI), use an objective calculation to describe the severity, location, timing, and/or duration of drought.
Learn MorePeriods of drought can lead to inadequate water supply, threatening the health, safety, and welfare of communities. Streamflow, groundwater, reservoir, and snowpack data are key to monitoring and forecasting water supply.
Learn MoreDrought can reduce the water availability and water quality necessary for productive farms, ranches, and grazing lands, resulting in significant negative direct and indirect economic impacts to the agricultural sector. Monitoring agricultural drought typically focuses on examining levels of precipitation, evaporative demand, soil moisture, and surface/groundwater quantity and quality.
Learn MoreA drought index combines multiple drought indicators (e.g., precipitation, temperature, soil moisture) to depict drought conditions. For some products, like the U.S. Drought Monitor, authors combine their analysis of drought indicators with input from local observers. Other drought indices, like the Standardized Precipitation Index (SPI), use an objective calculation to describe the severity, location, timing, and/or duration of drought.
Learn MoreDrought is defined as the lack of precipitation over an extended period of time, usually for a season or more, that results in a water shortage. Changes in precipitation can substantially disrupt crops and livestock, influence the frequency and intensity of severe weather events, and affect the quality and quantity of water available for municipal and industrial use.
Learn MoreA drought index combines multiple drought indicators (e.g., precipitation, temperature, soil moisture) to depict drought conditions. For some products, like the U.S. Drought Monitor, authors combine their analysis of drought indicators with input from local observers. Other drought indices, like the Standardized Precipitation Index (SPI), use an objective calculation to describe the severity, location, timing, and/or duration of drought.
Learn MoreFlash drought is the rapid onset or intensification of drought. Unlike slow-evolving drought, which is caused by a decline in precipitation, flash drought occurs when low precipitation is accompanied by abnormally high temperatures, high winds, and/or changes in radiation. These sometimes-rapid changes can quickly raise evapotranspiration rates and remove available water from the landscape.
Learn MoreDrought can result in reduced growth rates, increased stress on vegetation, and alterations or transformations to the plant community and/or the entire ecosystem. During periods of drought, plants increase their demand for water through increased evapotranspiration and longer growing seasons.
Learn MoreDuring drought conditions, fuels for wildfire, such as grasses and trees, can dry out and become more flammable. Drought can also increase the probability of ignition and the rate at which fire spreads. Temperature, soil moisture, humidity, wind speed, and fuel availability (vegetation) are all factors that interact to influence the frequency of large wildfires.
Learn MoreU.S. Drought Monitor
D0 - Abnormally Dry
Abnormally Dry (D0) indicates a region that is going into or coming out of drought, according to the U.S. Drought Monitor. View typical impacts by state.
D1 – Moderate Drought
Moderate Drought (D1) is the first of four drought categories (D1–D4), according to the U.S. Drought Monitor. View typical impacts by state.
D2 – Severe Drought
Severe Drought (D2) is the second of four drought categories (D1–D4), according to the U.S. Drought Monitor. View typical impacts by state.
D3 – Extreme Drought
Extreme Drought (D3) is the third of four drought categories (D1–D4), according to the U.S. Drought Monitor. View typical impacts by state.
D4 – Exceptional Drought
Exceptional Drought (D4) is the most intense drought category, according to the U.S. Drought Monitor. View typical impacts by state.
Drought Degradation
5-Category Degradation
Drought/dryness has worsened by 5 categories, according to the U.S. Drought Monitor.
4-Category Degradation
Drought/dryness has worsened by 4 categories, according to the U.S. Drought Monitor.
3-Category Degradation
Drought/dryness has worsened by 3 categories, according to the U.S. Drought Monitor.
2-Category Degradation
Drought/dryness has worsened by 2 categories, according to the U.S. Drought Monitor.
1-Category Degradation
Drought/dryness has worsened by 1 category, according to the U.S. Drought Monitor.
Drought Improvement
1-Category Improvement
Drought/dryness has improved by 1 category, according to the U.S. Drought Monitor.
2-Category Improvement
Drought/dryness has improved by 2 categories, according to the U.S. Drought Monitor.
3-Category Improvement
Drought/dryness has improved by 3 categories, according to the U.S. Drought Monitor.
4-Category Improvement
Drought/dryness has improved by 4 categories, according to the U.S. Drought Monitor.
5-Category Improvement
Drought/dryness has improved by 5 categories, according to the U.S. Drought Monitor.
Dry Conditions
D4 - Exceptional Drought (SPI of -2.0 or less)
The Standardized Precipitation Index (SPI) value for this location is -2.0 or less. SPI values can be interpreted as the number of standard deviations by which the precipitation anomaly deviates from the long-term mean. An SPI of -2.0 or less indicates Exceptional Drought (D4) conditions.
D3 - Extreme Drought (SPI of -1.9 to -1.6)
The Standardized Precipitation Index (SPI) value for this location is between -1.9 to -1.6. SPI values can be interpreted as the number of standard deviations by which the precipitation anomaly deviates from the long-term mean. An SPI of -1.9 to -1.6 indicates Extreme Drought (D3) conditions.
D2 - Severe Drought (SPI of -1.5 to -1.3)
The Standardized Precipitation Index (SPI) value for this location is between -1.5 to -1.3. SPI values can be interpreted as the number of standard deviations by which the precipitation anomaly deviates from the long-term mean. An SPI of -1.5 to -1.3 indicates Severe Drought (D2) conditions.
D1 - Moderate Drought (-1.2 to -0.8)
The Standardized Precipitation Index (SPI) value for this location is between -1.2 to -0.8. SPI values can be interpreted as the number of standard deviations by which the precipitation anomaly deviates from the long-term mean. An SPI of -1.2 to -0.8 indicates Moderate Drought (D1) conditions.
D0 - Abnormally Dry (SPI of -0.7 to -0.5)
The Standardized Precipitation Index (SPI) value for this location is between -0.7 to -0.5. SPI values can be interpreted as the number of standard deviations by which the precipitation anomaly deviates from the long-term mean. An SPI of -0.7 to -0.5 indicates Abnormally Dry (D0) conditions.
Wet Conditions
W0 (0.5 to 0.7)
The Standardized Precipitation Index (SPI) value for this location is between 0.5 to 0.7, indicating abnormally wet (W0) conditions.
W1 (0.8 to 1.2)
The Standardized Precipitation Index (SPI) value for this location is between 0.8 to 1.2, indicating moderate wet (W1) conditions.
W2 (1.3 to 1.5)
The Standardized Precipitation Index (SPI) value for this location is between 1.3 to 1.5, indicating severe wet (W2) conditions.
W3 (1.6 to 1.9)
The Standardized Precipitation Index (SPI) value for this location is between 1.6 to 1.9, indicating extreme wet (W3) conditions.
W4 (2.0 or more)
The Standardized Precipitation Index (SPI) value for this location is 2.0 or greater, indicating exceptional wet (W4) conditions.
Drought Conditions
ED4: Exceptional Drought
Compared to "normal" conditions, evaporative demand is greater than 98% to 100% of historical values. Learn more about these categories.
ED3: Extreme Drought
Compared to "normal" conditions, evaporative demand is greater than 95% to 98% of historical values. Learn more about these categories.
ED2: Severe Drought
Compared to "normal" conditions, evaporative demand is greater than 90% to 95% of historical values. Learn more about these categories.
ED1: Moderate Drought
Compared to "normal" conditions, evaporative demand is greater than 80% to 90% of previous values. Learn more about these categories.
ED0: Abnormally Dry
Compared to "normal" conditions, evaporative demand is greater than 70% to 80% of historical values. Learn more about these categories.
Wet Conditions
EW0: Abnormally Wet
Compared to "normal" conditions, current evaporative demand is in the bottom 20% to 30% of historical values (i.e., only 20%–30% of previous values had lower evaporative demand). Learn more about these categories.
EW1: Moderate Wet
Compared to "normal" conditions, current evaporative demand is in the bottom 10% to 20% of historical values (i.e., only 10%–20% of previous values had lower evaporative demand). Learn more about these categories.
EW2: Severe Wet
Compared to "normal" conditions, current evaporative demand is in the bottom 5% to 10% of historical values (i.e., only 5%–10% of previous values had lower evaporative demand). Learn more about these categories.
EW3: Extreme Wet
Compared to "normal" conditions, current evaporative demand is in the bottom 2% to 5% of historical values (i.e., only 2%–5% of previous values had lower evaporative demand). Learn more about these categories.
EW4: Exceptional Wet
Compared to "normal" conditions, current evaporative demand is in the bottom 0% to 2% of historical values (i.e., less than 2% of previous values had lower evaporative demand). Learn more about these categories.
The U.S. Drought Monitor depicts the location and intensity of drought across the country. The map uses 5 classifications: Abnormally Dry (D0), showing areas that may be going into or are coming out of drought, and four levels of drought (D1–D4).
This map is used by the U.S. Department of Agriculture to trigger some disaster declarations and loan eligibility. Individual states and water supply planning may use additional information to inform their declarations and actions. Learn more about the Drought Monitor.
The U.S. Drought Monitor 4-week change map shows where drought has improved, remained the same, or worsened since the previous month's U.S. Drought Monitor.
The U.S. Drought Monitor depicts the location and intensity of drought across the country, using 5 classifications (D0–D4). Green hues show where conditions improved, yellow/orange hues show where conditions worsened, and gray areas show where drought remained the same.
The Standardized Precipitation Index, or SPI, measures how observed precipitation deviates from average historical conditions for a given time range. SPI is used to estimate meteorological drought conditions. This map shows the SPI for the past 3 months (90 days), based on NOAA precipitation data. Red, orange, and yellow hues indicate drier conditions, while green and blue hues indicate wetter conditions.
The Evaporative Demand Drought Index (EDDI) is a drought monitoring tool that shows the anomaly in daily evaporative demand over a given period of time. Evaporative demand is the atmospheric influence on the drying of the landscape, or "the thirst of the atmosphere." Unusually high evaporative demand can lead to moisture stress on the land surface, and ultimately to drought—even when precipitation has been near-normal.
EDDI can serve as an indicator of both rapidly evolving "flash" droughts and sustained droughts and can offer early warning of agricultural drought, hydrologic drought, and fire-weather risk.
This map is released every Thursday morning, with data valid through Tuesday at 7am Eastern.
U.S. Drought Monitor change maps are released every Thursday morning, with data valid through Tuesday at 7 a.m. EST.
SPI data are updated daily, with a delay of 3–4 days.
The Evaporative Demand Drought Index (EDDI) is updated daily, with a 5-day delay. This delay results from the procedures to quality control the meteorological data used to estimate evaporative demand.
A drought index combines multiple drought indicators (e.g., precipitation, temperature, soil moisture) to depict drought conditions. For some products, like the U.S. Drought Monitor, authors combine their analysis of drought indicators with input from local observers. Other drought indices, like the Standardized Precipitation Index (SPI), use an objective calculation to describe the severity, location, timing, and/or duration of drought.
Learn MorePeriods of drought can lead to inadequate water supply, threatening the health, safety, and welfare of communities. Streamflow, groundwater, reservoir, and snowpack data are key to monitoring and forecasting water supply.
Learn MoreDrought can reduce the water availability and water quality necessary for productive farms, ranches, and grazing lands, resulting in significant negative direct and indirect economic impacts to the agricultural sector. Monitoring agricultural drought typically focuses on examining levels of precipitation, evaporative demand, soil moisture, and surface/groundwater quantity and quality.
Learn MoreA drought index combines multiple drought indicators (e.g., precipitation, temperature, soil moisture) to depict drought conditions. For some products, like the U.S. Drought Monitor, authors combine their analysis of drought indicators with input from local observers. Other drought indices, like the Standardized Precipitation Index (SPI), use an objective calculation to describe the severity, location, timing, and/or duration of drought.
Learn MorePeriods of drought can lead to inadequate water supply, threatening the health, safety, and welfare of communities. Streamflow, groundwater, reservoir, and snowpack data are key to monitoring and forecasting water supply.
Learn MoreDrought can reduce the water availability and water quality necessary for productive farms, ranches, and grazing lands, resulting in significant negative direct and indirect economic impacts to the agricultural sector. Monitoring agricultural drought typically focuses on examining levels of precipitation, evaporative demand, soil moisture, and surface/groundwater quantity and quality.
Learn MoreA drought index combines multiple drought indicators (e.g., precipitation, temperature, soil moisture) to depict drought conditions. For some products, like the U.S. Drought Monitor, authors combine their analysis of drought indicators with input from local observers. Other drought indices, like the Standardized Precipitation Index (SPI), use an objective calculation to describe the severity, location, timing, and/or duration of drought.
Learn MoreDrought is defined as the lack of precipitation over an extended period of time, usually for a season or more, that results in a water shortage. Changes in precipitation can substantially disrupt crops and livestock, influence the frequency and intensity of severe weather events, and affect the quality and quantity of water available for municipal and industrial use.
Learn MoreA drought index combines multiple drought indicators (e.g., precipitation, temperature, soil moisture) to depict drought conditions. For some products, like the U.S. Drought Monitor, authors combine their analysis of drought indicators with input from local observers. Other drought indices, like the Standardized Precipitation Index (SPI), use an objective calculation to describe the severity, location, timing, and/or duration of drought.
Learn MoreFlash drought is the rapid onset or intensification of drought. Unlike slow-evolving drought, which is caused by a decline in precipitation, flash drought occurs when low precipitation is accompanied by abnormally high temperatures, high winds, and/or changes in radiation. These sometimes-rapid changes can quickly raise evapotranspiration rates and remove available water from the landscape.
Learn MoreDrought can result in reduced growth rates, increased stress on vegetation, and alterations or transformations to the plant community and/or the entire ecosystem. During periods of drought, plants increase their demand for water through increased evapotranspiration and longer growing seasons.
Learn MoreDuring drought conditions, fuels for wildfire, such as grasses and trees, can dry out and become more flammable. Drought can also increase the probability of ignition and the rate at which fire spreads. Temperature, soil moisture, humidity, wind speed, and fuel availability (vegetation) are all factors that interact to influence the frequency of large wildfires.
Learn MoreRecent Precipitation Conditions
Inches of Precipitation
This location received less than 0.01 inch of precipitation during this 7-day period.
This location received 0.01–0.5 inch of precipitation during this 7-day period.
This location received 0.5–1 inch of precipitation during this 7-day period.
This location received 1–2 inches of precipitation during this 7-day period.
This location received 2–4 inches of precipitation during this 7-day period.
This location received 4–6 inches of precipitation during this 7-day period.
This location received 6–8 inches of precipitation during this 7-day period.
This location received more than 8 inches of precipitation during this 7-day period.
Precipitation Shown as a Percentage of Normal Conditions
<25% of Normal
Precipitation was only 0% to 25% of the historical average for this location, compared to the same date range from 1991–2020.
25%–50% of Normal
Precipitation was 25% to 50% of the historical average for this location, compared to the same date range from 1991–2020.
50%–75% of Normal
Precipitation was 50% to 75% of the historical average for this location, compared to the same date range from 1991–2020.
75%–100% of Normal
Precipitation was 75% to 100% of the historical average for this location, compared to the same date range from 1991–2020.
100%–150% of Normal
Precipitation was 100% to 150% of the historical average for this location, compared to the same date range from 1991–2020.
150%–200% of Normal
Precipitation was 150% to 200% of the historical average for this location, compared to the same date range from 1991–2020.
200%–300% of Normal
Precipitation was 200% to 300% of the historical average for this location, compared to the same date range from 1991–2020.
>300% of Normal
Precipitation was greater than 300% of the historical average for this location, compared to the same date range from 1991–2020.
This map shows total precipitation (in inches) for the past 7 days. Dark blue shades indicate the highest precipitation amounts.
This map shows precipitation for the past 30 days as a percentage of the historical average (1991–2020) for the same time period. Green/blue shades indicate above-normal precipitation, while brown shades indicate below-normal precipitation.
This map shows precipitation for the past 60 days as a percentage of the historical average (1991–2020) for the same time period. Green/blue shades indicate above-normal precipitation, while brown shades indicate below-normal precipitation.
Precipitation data are updated daily, with a delay of 3 to 4 days to allow for data collection and quality control.
Precipitation data are updated daily, with a delay of 3 to 4 days to allow for data collection and quality control.
Precipitation data are updated daily, with a delay of 3 to 4 days to allow for data collection and quality control.
Drought is defined as the lack of precipitation over an extended period of time, usually for a season or more, that results in a water shortage. Changes in precipitation can substantially disrupt crops and livestock, influence the frequency and intensity of severe weather events, and affect the quality and quantity of water available for municipal and industrial use.
Learn MorePeriods of drought can lead to inadequate water supply, threatening the health, safety, and welfare of communities. Streamflow, groundwater, reservoir, and snowpack data are key to monitoring and forecasting water supply.
Learn MoreDrought can reduce the water availability and water quality necessary for productive farms, ranches, and grazing lands, resulting in significant negative direct and indirect economic impacts to the agricultural sector. Monitoring agricultural drought typically focuses on examining levels of precipitation, evaporative demand, soil moisture, and surface/groundwater quantity and quality.
Learn MoreDrought is defined as the lack of precipitation over an extended period of time, usually for a season or more, that results in a water shortage. Changes in precipitation can substantially disrupt crops and livestock, influence the frequency and intensity of severe weather events, and affect the quality and quantity of water available for municipal and industrial use.
Learn MorePeriods of drought can lead to inadequate water supply, threatening the health, safety, and welfare of communities. Streamflow, groundwater, reservoir, and snowpack data are key to monitoring and forecasting water supply.
Learn MoreDrought can reduce the water availability and water quality necessary for productive farms, ranches, and grazing lands, resulting in significant negative direct and indirect economic impacts to the agricultural sector. Monitoring agricultural drought typically focuses on examining levels of precipitation, evaporative demand, soil moisture, and surface/groundwater quantity and quality.
Learn MoreRecent Maximum Temperature
Maximum Temperature (°F)
<0°F
The 7-day average daily maximum temperature is below 0°F.
0–10°F
The 7-day average daily maximum temperature is between 0–10°F.
10–20°F
The 7-day average daily maximum temperature is between 10–20°F.
20–30°F
The 7-day average daily maximum temperature is between 20–30°F.
30–40°F
The 7-day average daily maximum temperature is between 30–40°F.
40–60°F
The 7-day average daily maximum temperature is between 40–60°F.
60–70°F
The 7-day average daily maximum temperature is between 60–70°F.
70–80°F
The 7-day average daily maximum temperature is between 70–80°F.
80–90°F
The 7-day average daily maximum temperature is between 80–90°F.
90–100°F
The 7-day average daily maximum temperature is between 90–100°F.
>100°F
The 7-day average daily maximum temperature is between greater than 100°F.
Departure from Normal Max Temperature (°F)
>8°F Below Normal
The average maximum temperature was more than 8°F colder than normal for this location.
6–8°F Below Normal
The average maximum temperature was 6–8°F colder than normal for this location.
4–6°F Below Normal
The average maximum temperature was 4–6°F colder than normal for this location.
3–4°F Below Normal
The average maximum temperature was 3–4°F colder than normal for this location.
1–3°F Below Normal
The average maximum temperature was 1–3°F colder than normal for this location.
0–1°F Below Normal
The average maximum temperature was 0–1°F colder than normal for this location.
0–1°F Above Normal
The average maximum temperature was 0–1°F warmer than normal for this location.
1–3°F Above Normal
The average maximum temperature was 1–3°F warmer than normal for this location.
3–4°F Above Normal
The average maximum temperature was 3–4°F warmer than normal for this location.
4–6°F Above Normal
The average maximum temperature was 4–6°F warmer than normal for this location.
6–8°F Above Normal
The average maximum temperature was 6–8°F warmer than normal for this location.
>8°F Above Normal
The average maximum temperature was more than 8°F warmer than normal for this location.
This map shows the average maximum daily temperature (°F) for the last 7 days. Blue hues indicate cooler temperatures, while red hues indicate warmer temperatures.
This map shows the average maximum daily temperature for the past 7 days compared to the historical average (1991–2020) for the same 7 days. Negative values (blue hues) indicate colder than normal temperatures, and positive values (red hues) indicate warmer than normal temperatures.
This map shows the average maximum daily temperature for the past 30 days compared to the historical average (1991–2020) for the same 30 days. Negative values (blue hues) indicate colder than normal temperatures, and positive values (red hues) indicate warmer than normal temperatures.
Temperature data are updated daily, with a delay of 3 to 4 days to allow for data collection and quality control.
Temperature data are updated daily, with a delay of 3 to 4 days to allow for data collection and quality control.
Temperature data are updated daily, with a delay of 3 to 4 days to allow for data collection and quality control.
Air temperature can have wide-ranging effects on natural processes. Warmer air temperatures increase evapotranspiration—which is the combination of evaporation from the soil and bodies of water and transpiration from plants—and lower soil moisture.
Learn MoreDrought can reduce the water availability and water quality necessary for productive farms, ranches, and grazing lands, resulting in significant negative direct and indirect economic impacts to the agricultural sector. Monitoring agricultural drought typically focuses on examining levels of precipitation, evaporative demand, soil moisture, and surface/groundwater quantity and quality.
Learn MoreAir temperature can have wide-ranging effects on natural processes. Warmer air temperatures increase evapotranspiration—which is the combination of evaporation from the soil and bodies of water and transpiration from plants—and lower soil moisture.
Learn MoreDrought can reduce the water availability and water quality necessary for productive farms, ranches, and grazing lands, resulting in significant negative direct and indirect economic impacts to the agricultural sector. Monitoring agricultural drought typically focuses on examining levels of precipitation, evaporative demand, soil moisture, and surface/groundwater quantity and quality.
Learn MoreSoil Moisture Conditions
0–100 cm Soil Moisture Percentile
0–2nd Percentile
Soil moisture at 0–100cm depth is in the bottom 2% (0–2nd percentile) of historical measurements for this day of the year. Learn more.
2nd–5th Percentile
Soil moisture at 0–100cm depth falls between the 2nd to 5th percentile of historical measurements for this day of the year. Learn more.
5th–10th Percentile
Soil moisture at 0–100cm depth falls between the 5th to 10th percentile of historical measurements for this day of the year. Learn more.
10th–20th Percentile
Soil moisture at 0–100cm depth falls between the 10th to 20th percentile of historical measurements for this day of the year. Learn more.
20th–30th Percentile
Soil moisture at 0–100cm depth falls between the 20th to 30th percentile of historical measurements for this day of the year. Learn more.
30th–70th Percentile
Soil moisture at 0–100cm depth falls between the 30th to 70th percentile of historical measurements for this day of the year. Learn more.
70th–80th Percentile
Soil moisture at 0–100cm depth falls between the 70th to 80th percentile of historical measurements for this day of the year. Learn more.
80th–90th Percentile
Soil moisture at 0–100cm depth falls between the 80th to 90th percentile of historical measurements for this day of the year. Learn more.
90th–95th Percentile
Soil moisture at 0–100cm depth falls between the 90th to 95th percentile of historical measurements for this day of the year. Learn more.
95th–98th Percentile
Soil moisture at 0–100cm depth falls between the 95th to 98th percentile of historical measurements for this day of the year. Learn more.
98th–100th Percentile
Soil moisture at 0–100cm depth is in the top 2% (98th to 100th percentile) of historical measurements for this day of the year. Learn more.
Soil Moisture Anomaly
An accurate depiction of soil moisture conditions can provide valuable insights for agricultural monitoring, weather prediction, and drought and flood early warning.
This map shows the moisture content of the top 1 meter of soil compared to historical conditions from 1981–2013, based on NASA's Short-term Prediction and Transition Center – Land Information System (SPoRT-LIS).
Red and orange hues indicate drier soils, while greens and blues indicate greater soil moisture.
An accurate depiction of soil moisture conditions can provide valuable insights for agricultural monitoring, weather prediction, and drought and flood early warning.
This map shows the moisture content of the top 1 meter of soil, according to NASA's Crop Condition and Soil Moisture Analytics tool (Crop-CASMA). It relies on remotely sensed soil moisture data derived from NASA missions.
Soil moisture is shown as a deviation from average soil moisture conditions from 2015–present. Brown hues indicate below-average soil moisture, and blue hues indicate above-average soil moisture.
This map updates daily with data from NASA's Short-term Prediction and Transition Center – Land Information System (SPoRT-LIS).
Data are updated daily, with a 3-day delay.
Soil moisture plays an important role in drought and flood forecasting, agricultural monitoring, forest fire prediction, water supply management, and other natural resource activities. Soil moisture observations can forewarn of impending drought or flood conditions before other more standard indicators are triggered.
Learn MoreFlash drought is the rapid onset or intensification of drought. Unlike slow-evolving drought, which is caused by a decline in precipitation, flash drought occurs when low precipitation is accompanied by abnormally high temperatures, high winds, and/or changes in radiation. These sometimes-rapid changes can quickly raise evapotranspiration rates and remove available water from the landscape.
Learn MoreDrought can reduce the water availability and water quality necessary for productive farms, ranches, and grazing lands, resulting in significant negative direct and indirect economic impacts to the agricultural sector. Monitoring agricultural drought typically focuses on examining levels of precipitation, evaporative demand, soil moisture, and surface/groundwater quantity and quality.
Learn MoreDrought can result in reduced growth rates, increased stress on vegetation, and alterations or transformations to the plant community and/or the entire ecosystem. During periods of drought, plants increase their demand for water through increased evapotranspiration and longer growing seasons.
Learn MoreSoil moisture plays an important role in drought and flood forecasting, agricultural monitoring, forest fire prediction, water supply management, and other natural resource activities. Soil moisture observations can forewarn of impending drought or flood conditions before other more standard indicators are triggered.
Learn MoreDrought Impacts
Drought Information Statements
U.S. Drought Monitor
D0 - Abnormally Dry
Abnormally Dry (D0) indicates a region that is going into or coming out of drought, according to the U.S. Drought Monitor. View typical impacts by state.
D1 – Moderate Drought
Moderate Drought (D1) is the first of four drought categories (D1–D4), according to the U.S. Drought Monitor. View typical impacts by state.
D2 – Severe Drought
Severe Drought (D2) is the second of four drought categories (D1–D4), according to the U.S. Drought Monitor. View typical impacts by state.
D3 – Extreme Drought
Extreme Drought (D3) is the third of four drought categories (D1–D4), according to the U.S. Drought Monitor. View typical impacts by state.
D4 – Exceptional Drought
Exceptional Drought (D4) is the most intense drought category, according to the U.S. Drought Monitor. View typical impacts by state.
Saline Conditions
CD4: Exceptional Salinity Conditions (CSI of -2.0 or less)
Exceptional Salinity Conditions (CD4) means that this gauge has a Coastal Salinity Index (CSI) value of -2 or less. A CSI of of zero indicates historical mean salinity, and negative values indicate increasingly saline conditions. Learn more about how this index is calculated.
CD3: Extreme Salinity Conditions (CSI of -1.99 to -1.60)
Extreme Salinity Conditions (CD3) means that this gauge has a Coastal Salinity Index (CSI) value of -1.99 to -1.6. A CSI of of zero indicates historical mean salinity, and negative values indicate increasingly saline conditions. Learn more about how this index is calculated.
CD2: Severe Salinity Conditions (CSI of -1.59 to -1.30)
Severe Salinity Conditions (CD2) means that this gauge has a Coastal Salinity Index (CSI) value of -1.59 to -1.30. A CSI of of zero indicates historical mean salinity, and negative values indicate increasingly saline conditions. Learn more about how this index is calculated.
CD1: Moderate Salinity Conditions (CSI of -1.29 to -0.80)
Moderate Salinity Conditions (CD1) means that this gauge has a Coastal Salinity Index (CSI) value of -1.29 to -0.8. A CSI of of zero indicates historical mean salinity, and negative values indicate increasingly saline conditions. Learn more about how this index is calculated.
CD0: Abnormal Salinity Conditions (CSI of -0.79 to -0.50)
Abnormal Salinity Conditions (CD0) means that this gauge has a Coastal Salinity Index (CSI) value of -0.79 to -0.5. A CSI of of zero indicates historical mean salinity, and negative values indicate increasingly saline conditions. Learn more about how this index is calculated.
Normal Salinity Conditions (CSI of -0.49 to 0.50)
This gauge has a Coastal Salinity Index value between -0.49 to 0.50, which means it has near-normal saline conditions compared to the historical mean. A CSI of of zero indicates historical mean salinity, and positive values indicate increasingly freshwater conditions. Learn more about how this index is calculated.
Freshwater Conditions
CW0: Abnormal Freshwater Conditions (CSI of 0.51 to 0.80)
Abnormal Freshwater Conditions (CW0) means that this gauge has a Coastal Salinity Index (CSI) value of 0.5 to 0.8. A CSI of of zero indicates historical mean salinity, and positive values indicate increasingly freshwater conditions. Learn more about how this index is calculated.
CW1: Moderate Freshwater Conditions (CSI of 0.81 to 1.30)
Moderate Freshwater Conditions (CW1) means that this gauge has a Coastal Salinity Index (CSI) value of 0.81 to 1.3. A CSI of of zero indicates historical mean salinity, and positive values indicate increasingly freshwater conditions. Learn more about how this index is calculated.
CW2: Severe Freshwater Conditions (CSI of 1.31 to 1.60)
Severe Freshwater Conditions (CW2) means that this gauge has a Coastal Salinity Index (CSI) value of 1.31 to 1.6. A CSI of of zero indicates historical mean salinity, and positive values indicate increasingly freshwater conditions. Learn more about how this index is calculated.
CW3: Extreme Freshwater Conditions (CSI of 1.61 to 2.00)
Extreme Freshwater Conditions (CW3) means that this gauge has a Coastal Salinity Index (CSI) value of 1.61 to 2.0. A CSI of of zero indicates historical mean salinity, and positive values indicate increasingly freshwater conditions. Learn more about how this index is calculated.
CW4: Exceptional Freshwater Conditions (CSI of 2.01 or more)
Exceptional Freshwater Conditions (CW4) means that this gauge has a Coastal Salinity Index (CSI) value of more than 2.0. A CSI of of zero indicates historical mean salinity, and positive values indicate increasingly freshwater conditions. Learn more about how this index is calculated.
No Data
Coastal Salinity Index data are unavailable for this gauge.
Vegetation Conditions
National Weather Service drought information statements provide up-to-date reports on the current drought situation for a Weather Forecast Office’s county warning and forecast area. These statements summarize recent weather and hydrologic conditions, discuss local drought impacts, and provide a local drought outlook.
This map shows all active drought information statements published within the last 35 days.
Coastal drought can impact the salinity dynamics of creeks, rivers, and estuaries. The Coastal Salinity Index (CSI) is a long-term monitoring tool that measures relative changes in salinity for gauges along the East and Gulf Coasts.
This map shows salinity conditions over the past month compared to the historical mean. Red and orange hues indicate high saline (coastal drought, or CD) conditions, and blue hues indicate freshwater (coastal wet, or CW) conditions.
The Vegetation Drought Response Index (VegDRI) is a weekly depiction of drought's effects on vegetation stress across the contiguous United States. Yellow/red hues indicate drought conditions, while green hues indicate moist conditions.
The map incorporates satellite observations of vegetation conditions, climate data, and environmental characteristics (e.g., land cover, land use, soil type).
Weather Forecast Offices issue drought information statements as needed based on local conditions. This map is updated daily.
Coastal Salinity Index data are updated daily.
VegDRI data are updated weekly.
Periods of drought can lead to inadequate water supply, threatening the health, safety, and welfare of communities. Streamflow, groundwater, reservoir, and snowpack data are key to monitoring and forecasting water supply.
Learn MoreDrought can reduce the water availability and water quality necessary for productive farms, ranches, and grazing lands, resulting in significant negative direct and indirect economic impacts to the agricultural sector. Monitoring agricultural drought typically focuses on examining levels of precipitation, evaporative demand, soil moisture, and surface/groundwater quantity and quality.
Learn MoreDrought can cause significant human health outcomes that can challenge public health departments, emergency managers, and healthcare providers. Drought can lead to decreased water quantity and quality, increased incidence of illness or disease, increased mortality rates, and adverse mental health outcomes as livelihoods are challenged.
Learn MoreDuring drought conditions, fuels for wildfire, such as grasses and trees, can dry out and become more flammable. Drought can also increase the probability of ignition and the rate at which fire spreads. Temperature, soil moisture, humidity, wind speed, and fuel availability (vegetation) are all factors that interact to influence the frequency of large wildfires.
Learn MoreA drought index combines multiple drought indicators (e.g., precipitation, temperature, soil moisture) to depict drought conditions. For some products, like the U.S. Drought Monitor, authors combine their analysis of drought indicators with input from local observers. Other drought indices, like the Standardized Precipitation Index (SPI), use an objective calculation to describe the severity, location, timing, and/or duration of drought.
Learn MoreFlash drought is the rapid onset or intensification of drought. Unlike slow-evolving drought, which is caused by a decline in precipitation, flash drought occurs when low precipitation is accompanied by abnormally high temperatures, high winds, and/or changes in radiation. These sometimes-rapid changes can quickly raise evapotranspiration rates and remove available water from the landscape.
Learn MoreDrought can alter the ecological balance of natural systems and harm fish, wildlife, and plant species, as well as the benefits that these ecosystems provide to human communities. The environmental consequences of drought include losses in plant growth; increases in fire and insect outbreaks; altered rates of carbon, nutrient, and water cycling; and local species extinctions.
Learn MoreDrought can result in reduced growth rates, increased stress on vegetation, and alterations or transformations to the plant community and/or the entire ecosystem. During periods of drought, plants increase their demand for water through increased evapotranspiration and longer growing seasons.
Learn MoreFuture Drought & Climate Conditions for the Greater Mississippi River Basin
Predicting drought can pose unique challenges. Global weather patterns, which affect the location and intensity of precipitation, are constantly changing and are difficult to predict on longer timescales. Below, explore official forecasts from NOAA’s National Weather Service, and learn more about predicting drought.
Official NOAA Precipitation Forecast
Predicted Inches of Precipitation
Less than 0.01 inch
0.01 to 0.1 inch
0.1 to 0.25 inch
0.25 to 0.5 inch
0.5 to 0.75 inch
0.75 to 1 inch
1 to 1.25 inches
1.25 to 1.5 inches
1.5 to 1.75 inches
1.75 to 2 inches
1.5 to 2 inches
2 to 2.5 inches
2.5 to 3 inches
3 to 4 inches
4 to 5 inches
5 to 7 inches
7 to 10 inches
10 to 15 inches
15 to 20 inches
More than 20 inches
This map shows the amount of liquid precipitation (in inches) expected to fall over the next 1 day, according to the National Weather Service.
This map shows the amount of liquid precipitation (in inches) expected to fall over the next 7 days, according to the National Weather Service.
The Quantitative Precipitation Forecast maps on Drought.gov are updated once a day and are valid from 7 a.m. Eastern that day.
The Quantitative Precipitation Forecast maps on Drought.gov are updated once a day and are valid from 7 a.m. Eastern that day.
Drought is defined as the lack of precipitation over an extended period of time, usually for a season or more, that results in a water shortage. Changes in precipitation can substantially disrupt crops and livestock, influence the frequency and intensity of severe weather events, and affect the quality and quantity of water available for municipal and industrial use.
Learn MoreFlash drought is the rapid onset or intensification of drought. Unlike slow-evolving drought, which is caused by a decline in precipitation, flash drought occurs when low precipitation is accompanied by abnormally high temperatures, high winds, and/or changes in radiation. These sometimes-rapid changes can quickly raise evapotranspiration rates and remove available water from the landscape.
Learn MoreDrought can reduce the water availability and water quality necessary for productive farms, ranches, and grazing lands, resulting in significant negative direct and indirect economic impacts to the agricultural sector. Monitoring agricultural drought typically focuses on examining levels of precipitation, evaporative demand, soil moisture, and surface/groundwater quantity and quality.
Learn MoreDrought is defined as the lack of precipitation over an extended period of time, usually for a season or more, that results in a water shortage. Changes in precipitation can substantially disrupt crops and livestock, influence the frequency and intensity of severe weather events, and affect the quality and quantity of water available for municipal and industrial use.
Learn MoreFlash drought is the rapid onset or intensification of drought. Unlike slow-evolving drought, which is caused by a decline in precipitation, flash drought occurs when low precipitation is accompanied by abnormally high temperatures, high winds, and/or changes in radiation. These sometimes-rapid changes can quickly raise evapotranspiration rates and remove available water from the landscape.
Learn MoreDrought can reduce the water availability and water quality necessary for productive farms, ranches, and grazing lands, resulting in significant negative direct and indirect economic impacts to the agricultural sector. Monitoring agricultural drought typically focuses on examining levels of precipitation, evaporative demand, soil moisture, and surface/groundwater quantity and quality.
Learn MoreOfficial NOAA Precipitation Outlooks
Probability of Below-Normal Precipitation
33%–40% Chance of Below Normal
There is an 33%–40% chance of below-normal precipitation during this period.
40%–50% Chance of Below Normal
There is an 40%–50% chance of below-normal precipitation during this period.
50%–60% Chance of Below Normal
There is an 50%–60% chance of below-normal precipitation during this period.
60%–70% Chance of Below Normal
There is an 60%–70% chance of below-normal precipitation during this period.
70%–80% Chance of Below Normal
There is an 70%–80% chance of below-normal precipitation during this period.
80%–90% Chance of Below Normal
There is an 80%–90% chance of below-normal precipitation during this period.
>90% Chance of Below Normal
There is a >90% chance of below-normal precipitation during this period.
Probability of Above-Normal Precipitation
33%–40% Chance of Above Normal
There is an 33%–40% chance of above-normal precipitation during this period.
40%–50% Chance of Above Normal
There is an 40%–50% chance of above-normal precipitation during this period.
50%–60% Chance of Above Normal
There is an 50%–60% chance of above-normal precipitation during this period.
60%–70% Chance of Above Normal
There is an 60%–70% chance of above-normal precipitation during this period.
70%–80% Chance of Above Normal
There is an 70%–80% chance of above-normal precipitation during this period.
80%–90% Chance of Above Normal
There is an 80%–90% chance of above-normal precipitation during this period.
>90% Chance of Above Normal
There is a >90% chance of above-normal precipitation during this period.
Near-Normal
Odds favor near-normal precipitation during this period.
Probability of Below-Normal Precipitation
33%–40% Chance of Below Normal
There is an 33%–40% chance of below-normal precipitation during this period.
40%–50% Chance of Below Normal
There is an 40%–50% chance of below-normal precipitation during this period.
50%–60% Chance of Below Normal
There is an 50%–60% chance of below-normal precipitation during this period.
60%–70% Chance of Below Normal
There is an 60%–70% chance of below-normal precipitation during this period.
70%–80% Chance of Below Normal
There is an 70%–80% chance of below-normal precipitation during this period.
80%–90% Chance of Below Normal
There is an 80%–90% chance of below-normal precipitation during this period.
>90% Chance of Below Normal
There is a >90% chance of below-normal precipitation during this period.
Probability of Above-Normal Precipitation
33%–40% Chance of Above Normal
There is an 33%–40% chance of above-normal precipitation during this period.
40%–50% Chance of Above Normal
There is an 40%–50% chance of above-normal precipitation during this period.
50%–60% Chance of Above Normal
There is an 50%–60% chance of above-normal precipitation during this period.
60%–70% Chance of Above Normal
There is an 60%–70% chance of above-normal precipitation during this period.
70%–80% Chance of Above Normal
There is an 70%–80% chance of above-normal precipitation during this period.
80%–90% Chance of Above Normal
There is an 80%–90% chance of above-normal precipitation during this period.
>90% Chance of Above Normal
There is a >90% chance of above-normal precipitation during this period.
Probability of Near-Normal Precipitation
33%–40% of Near Normal
There is an 33%–40% chance of near-normal precipitation during this period.
40%–50% of Near Normal
There is an 40%–50% chance of near-normal precipitation during this period.
This map shows the probability (percent chance) of above-normal, near-normal, or below-normal precipitation 6 to 10 days in the future.
This map shows the probability (percent chance) of above-normal, near-normal, or below-normal precipitation 8 to 14 days in the future.
This map shows the probability (percent chance) of above-normal (green hues) or below-normal (brown hues) precipitation over the next calendar month. White areas indicates equal chances of above- or below-normal precipitation.
This map shows the probability (percent chance) of above-normal (green hues) or below-normal (brown hues) precipitation over the next three months. White areas indicates equal chances of above- or below-normal precipitation.
The Climate Prediction Center updates their 6–10 day precipitation outlook daily.
The Climate Prediction Center updates their 8–14 day outlooks daily.
The Climate Prediction Center updates their monthly precipitation outlook on the third Thursday of each calendar month and again on the last day of each calendar month.
The Climate Prediction Center updates their seasonal precipitation outlook on the third Thursday of each calendar month.
Drought is defined as the lack of precipitation over an extended period of time, usually for a season or more, that results in a water shortage. Changes in precipitation can substantially disrupt crops and livestock, influence the frequency and intensity of severe weather events, and affect the quality and quantity of water available for municipal and industrial use.
Learn MoreFlash drought is the rapid onset or intensification of drought. Unlike slow-evolving drought, which is caused by a decline in precipitation, flash drought occurs when low precipitation is accompanied by abnormally high temperatures, high winds, and/or changes in radiation. These sometimes-rapid changes can quickly raise evapotranspiration rates and remove available water from the landscape.
Learn MorePeriods of drought can lead to inadequate water supply, threatening the health, safety, and welfare of communities. Streamflow, groundwater, reservoir, and snowpack data are key to monitoring and forecasting water supply.
Learn MoreDrought can reduce the water availability and water quality necessary for productive farms, ranches, and grazing lands, resulting in significant negative direct and indirect economic impacts to the agricultural sector. Monitoring agricultural drought typically focuses on examining levels of precipitation, evaporative demand, soil moisture, and surface/groundwater quantity and quality.
Learn MoreDrought is defined as the lack of precipitation over an extended period of time, usually for a season or more, that results in a water shortage. Changes in precipitation can substantially disrupt crops and livestock, influence the frequency and intensity of severe weather events, and affect the quality and quantity of water available for municipal and industrial use.
Learn MoreFlash drought is the rapid onset or intensification of drought. Unlike slow-evolving drought, which is caused by a decline in precipitation, flash drought occurs when low precipitation is accompanied by abnormally high temperatures, high winds, and/or changes in radiation. These sometimes-rapid changes can quickly raise evapotranspiration rates and remove available water from the landscape.
Learn MorePeriods of drought can lead to inadequate water supply, threatening the health, safety, and welfare of communities. Streamflow, groundwater, reservoir, and snowpack data are key to monitoring and forecasting water supply.
Learn MoreDrought can reduce the water availability and water quality necessary for productive farms, ranches, and grazing lands, resulting in significant negative direct and indirect economic impacts to the agricultural sector. Monitoring agricultural drought typically focuses on examining levels of precipitation, evaporative demand, soil moisture, and surface/groundwater quantity and quality.
Learn MoreDrought is defined as the lack of precipitation over an extended period of time, usually for a season or more, that results in a water shortage. Changes in precipitation can substantially disrupt crops and livestock, influence the frequency and intensity of severe weather events, and affect the quality and quantity of water available for municipal and industrial use.
Learn MoreSnow drought is a period of abnormally low snowpack for the time of year. Snowpack typically acts as a natural reservoir, providing water throughout the drier summer months. Lack of snowpack storage, or a shift in timing of snowmelt, can be a challenge for drought planning.
Learn MorePeriods of drought can lead to inadequate water supply, threatening the health, safety, and welfare of communities. Streamflow, groundwater, reservoir, and snowpack data are key to monitoring and forecasting water supply.
Learn MoreDrought can reduce the water availability and water quality necessary for productive farms, ranches, and grazing lands, resulting in significant negative direct and indirect economic impacts to the agricultural sector. Monitoring agricultural drought typically focuses on examining levels of precipitation, evaporative demand, soil moisture, and surface/groundwater quantity and quality.
Learn MoreDuring drought conditions, fuels for wildfire, such as grasses and trees, can dry out and become more flammable. Drought can also increase the probability of ignition and the rate at which fire spreads. Temperature, soil moisture, humidity, wind speed, and fuel availability (vegetation) are all factors that interact to influence the frequency of large wildfires.
Learn MoreOfficial NOAA Temperature Outlooks
Probability of Below-Normal Temperatures
33%–40% Chance of Below Normal
There is an 33%–40% chance of below-normal temperatures during this period.
40%–50% Chance of Below Normal
There is an 40%–50% chance of below-normal temperatures during this period.
50%–60% Chance of Below Normal
There is an 50%–60% chance of below-normal temperatures during this period.
60%–70% Chance of Below Normal
There is an 60%–70% chance of below-normal temperatures during this period.
70%–80% Chance of Below Normal
There is an 70%–80% chance of below-normal temperatures during this period.
80%–90% Chance of Below Normal
There is an 80%–90% chance of below-normal temperatures during this period.
>90% Chance of Below Normal
There is a >90% chance of below-normal temperatures during this period.
Probability of Above-Normal Temperatures
33%–40% Chance of Above Normal
There is an 33%–40% chance of above-normal temperatures during this period.
40%–50% Chance of Above Normal
There is an 40%–50% chance of above-normal temperatures during this period.
50%–60% Chance of Above Normal
There is an 50%–60% chance of above-normal temperatures during this period.
60%–70% Chance of Above Normal
There is an 60%–70% chance of above-normal temperatures during this period.
70%–80% Chance of Above Normal
There is an 70%–80% chance of above-normal temperatures during this period.
80%–90% Chance of Above Normal
There is an 80%–90% chance of above-normal temperatures during this period.
>90% Chance of Above Normal
There is a >90% chance of above-normal temperatures during this period.
Near-Normal
Odds favor near-normal temperatures during this period.
Probability of Below-Normal Temperatures
33%–40% Chance of Below Normal
There is an 33%–40% chance of below-normal temperatures during this period.
40%–50% Chance of Below Normal
There is an 40%–50% chance of below-normal temperatures during this period.
50%–60% Chance of Below Normal
There is an 50%–60% chance of below-normal temperatures during this period.
60%–70% Chance of Below Normal
There is an 60%–70% chance of below-normal temperatures during this period.
70%–80% Chance of Below Normal
There is an 70%–80% chance of below-normal temperatures during this period.
80%–90% Chance of Below Normal
There is an 80%–90% chance of below-normal temperatures during this period.
>90% Chance of Below Normal
There is a >90% chance of below-normal temperatures during this period.
Probability of Above-Normal Temperatures
33%–40% Chance of Above Normal
There is an 33%–40% chance of above-normal temperatures during this period.
40%–50% Chance of Above Normal
There is an 40%–50% chance of above-normal temperatures during this period.
50%–60% Chance of Above Normal
There is an 50%–60% chance of above-normal temperatures during this period.
60%–70% Chance of Above Normal
There is an 60%–70% chance of above-normal temperatures during this period.
70%–80% Chance of Above Normal
There is an 70%–80% chance of above-normal temperatures during this period.
80%–90% Chance of Above Normal
There is an 80%–90% chance of above-normal temperatures during this period.
>90% Chance of Above Normal
There is a >90% chance of above-normal temperatures during this period.
Probability of Near-Normal Temperatures
33%–40% of Near Normal
There is an 33%–40% chance of near-normal temperatures during this period.
40%–50% of Near Normal
There is an 40%–50% chance of near-normal temperatures during this period.
This map shows the probability (percent chance) of above-normal, near-normal, or below-normal temperatures 6 to 10 days in the future.
This map shows the probability (percent chance) of above-normal, near-normal, or below-normal temperature 8 to 14 days in the future.
This map shows the probability (percent chance) of above-normal (red hues) or below-normal (blue hues) temperatures over the next calendar month. White areas indicates equal chances of above- or below-normal temperatures.
This map shows the probability (percent chance) of above-normal (red hues) or below-normal (blue hues) temperatures over the next three months. White areas indicates equal chances of above- or below-normal temperatures.
The Climate Prediction Center updates their 6–10 day outlooks daily.
The Climate Prediction Center updates their 8–14 day outlooks daily.
The Climate Prediction Center updates their monthly temperature outlook on the third Thursday of each calendar month and again on the last day of each calendar month.
The Climate Prediction Center updates their seasonal temperature outlook on the third Thursday of each calendar month.
Air temperature can have wide-ranging effects on natural processes. Warmer air temperatures increase evapotranspiration—which is the combination of evaporation from the soil and bodies of water and transpiration from plants—and lower soil moisture.
Learn MoreFlash drought is the rapid onset or intensification of drought. Unlike slow-evolving drought, which is caused by a decline in precipitation, flash drought occurs when low precipitation is accompanied by abnormally high temperatures, high winds, and/or changes in radiation. These sometimes-rapid changes can quickly raise evapotranspiration rates and remove available water from the landscape.
Learn MoreAir temperature can have wide-ranging effects on natural processes. Warmer air temperatures increase evapotranspiration—which is the combination of evaporation from the soil and bodies of water and transpiration from plants—and lower soil moisture.
Learn MoreSnow drought is a period of abnormally low snowpack for the time of year. Snowpack typically acts as a natural reservoir, providing water throughout the drier summer months. Lack of snowpack storage, or a shift in timing of snowmelt, can be a challenge for drought planning.
Learn MoreDrought can reduce the water availability and water quality necessary for productive farms, ranches, and grazing lands, resulting in significant negative direct and indirect economic impacts to the agricultural sector. Monitoring agricultural drought typically focuses on examining levels of precipitation, evaporative demand, soil moisture, and surface/groundwater quantity and quality.
Learn MoreOfficial NOAA Drought Outlooks
Drought Is Predicted To...
Drought Persists
During this time period, NOAA's Climate Prediction Center predicts that drought conditions will persist.
Drought Improves
During this time period, NOAA's Climate Prediction Center predicts that existing drought conditions will improve (but not be removed).
Drought Is Removed
During this time period, NOAA's Climate Prediction Center predicts that drought will be removed.
Drought Develops
During this time period, NOAA's Climate Prediction Center predicts that drought will develop.
No Drought Present
According to NOAA's Climate Prediction Center, there is no drought, and is drought development is not predicted.
2-4 Week Hazard Outlook
Risk of Rapid Onset Drought
National Weather Service forecasters predict that rapid drought development (also known as "flash drought") may occur in the coming 2–4 weeks.
The Monthly Drought Outlook predicts whether drought will develop, remain, improve, or be removed in the next calendar month.
The Seasonal Drought Outlook predicts whether drought will develop, remain, improve, or be removed in the next 3 months or so.
This National Weather Service hazard outlook map shows the risk of rapid onset drought (flash drought) development during the next 2–4 weeks.
Forecasters use initial conditions, like existing dryness (e.g., soil moisture), temperature, and precipitation outlooks, to assess the risk of rapid drought development. Rapid onset drought risk areas (yellow) can give users, such as farmers making decisions about planting and supplemental irrigation, an early warning of the potential for hot and dry conditions.
The Climate Prediction Center issues its Monthly Drought Outlooks on the last day of the calendar month.
The Climate Prediction Center issues its Seasonal Drought Outlooks on the third Thursday of each calendar month. Sometimes, the map is adjusted on the last day of the month to maintain consistency with the Monthly Drought Outlook.
National Weather Service (NWS) forecasters issue rapid onset drought (ROD) risk areas on Thursdays, with the potential for updates on the following Mondays, from April 1–October 31.
The NWS Climate Prediction Center hazards outlook is issued between 2–5 p.m. ET, and this Drought.gov map updates at 7 p.m. ET.
Snow drought is a period of abnormally low snowpack for the time of year. Snowpack typically acts as a natural reservoir, providing water throughout the drier summer months. Lack of snowpack storage, or a shift in timing of snowmelt, can be a challenge for drought planning.
Learn MorePeriods of drought can lead to inadequate water supply, threatening the health, safety, and welfare of communities. Streamflow, groundwater, reservoir, and snowpack data are key to monitoring and forecasting water supply.
Learn MoreDrought can reduce the water availability and water quality necessary for productive farms, ranches, and grazing lands, resulting in significant negative direct and indirect economic impacts to the agricultural sector. Monitoring agricultural drought typically focuses on examining levels of precipitation, evaporative demand, soil moisture, and surface/groundwater quantity and quality.
Learn MoreDuring drought conditions, fuels for wildfire, such as grasses and trees, can dry out and become more flammable. Drought can also increase the probability of ignition and the rate at which fire spreads. Temperature, soil moisture, humidity, wind speed, and fuel availability (vegetation) are all factors that interact to influence the frequency of large wildfires.
Learn MoreSnow drought is a period of abnormally low snowpack for the time of year. Snowpack typically acts as a natural reservoir, providing water throughout the drier summer months. Lack of snowpack storage, or a shift in timing of snowmelt, can be a challenge for drought planning.
Learn MorePeriods of drought can lead to inadequate water supply, threatening the health, safety, and welfare of communities. Streamflow, groundwater, reservoir, and snowpack data are key to monitoring and forecasting water supply.
Learn MoreDrought can reduce the water availability and water quality necessary for productive farms, ranches, and grazing lands, resulting in significant negative direct and indirect economic impacts to the agricultural sector. Monitoring agricultural drought typically focuses on examining levels of precipitation, evaporative demand, soil moisture, and surface/groundwater quantity and quality.
Learn MoreDuring drought conditions, fuels for wildfire, such as grasses and trees, can dry out and become more flammable. Drought can also increase the probability of ignition and the rate at which fire spreads. Temperature, soil moisture, humidity, wind speed, and fuel availability (vegetation) are all factors that interact to influence the frequency of large wildfires.
Learn MoreAir temperature can have wide-ranging effects on natural processes. Warmer air temperatures increase evapotranspiration—which is the combination of evaporation from the soil and bodies of water and transpiration from plants—and lower soil moisture.
Learn MoreFlash drought is the rapid onset or intensification of drought. Unlike slow-evolving drought, which is caused by a decline in precipitation, flash drought occurs when low precipitation is accompanied by abnormally high temperatures, high winds, and/or changes in radiation. These sometimes-rapid changes can quickly raise evapotranspiration rates and remove available water from the landscape.
Learn MoreDrought can reduce the water availability and water quality necessary for productive farms, ranches, and grazing lands, resulting in significant negative direct and indirect economic impacts to the agricultural sector. Monitoring agricultural drought typically focuses on examining levels of precipitation, evaporative demand, soil moisture, and surface/groundwater quantity and quality.
Learn MoreExtreme weather events can interact or cascade—where one disaster event triggers or changes the probability of another event. For example, drought conditions can increase the probability of large-scale wildfires, and droughts are often accompanied by extreme heat. By including drought in multi-hazard planning, a community can consolidate its resources and develop coordinated responses before a disaster.
Learn MoreBasin-Wide Historical Drought Conditions and Impacts
Drought is a normal climate pattern that has occurred in varying degrees of length, severity, and size throughout history. Below, you can look back at past drought conditions for the selected basin according to 3 historical drought indices. The U.S. Drought Monitor is a weekly map that shows the location and intensity of drought across the country since 2000. The Standardized Precipitation Index (SPI) is a monthly depiction of drought based on precipitation (with data going back to 1895). And the paleoclimate data uses tree-ring reconstructions to estimate drought conditions before we had widespread instrumental records, going back to the year 0 for some parts of the U.S. View more historical conditions.
U.S. Drought Monitor
D0 - Abnormally Dry
Abnormally Dry (D0) indicates a region that is going into or coming out of drought, according to the U.S. Drought Monitor. View typical impacts by state.
D1 – Moderate Drought
Moderate Drought (D1) is the first of four drought categories (D1–D4), according to the U.S. Drought Monitor. View typical impacts by state.
D2 – Severe Drought
Severe Drought (D2) is the second of four drought categories (D1–D4), according to the U.S. Drought Monitor. View typical impacts by state.
D3 – Extreme Drought
Extreme Drought (D3) is the third of four drought categories (D1–D4), according to the U.S. Drought Monitor. View typical impacts by state.
D4 – Exceptional Drought
Exceptional Drought (D4) is the most intense drought category, according to the U.S. Drought Monitor. View typical impacts by state.
The U.S. Drought Monitor (2000–present) depicts the location and intensity of drought across the country. Every Thursday, authors from NOAA, USDA, and the National Drought Mitigation Center produce a new map based on their assessments of the best available data and input from local observers. The map uses five categories: Abnormally Dry (D0), showing areas that may be going into or are coming out of drought, and four levels of drought (D1–D4). Learn more.
Source: NOAA, USDA, NDMC
Dry Conditions
D4 (SPI of -2.0 or less)
The 9-month Standardized Precipitation Index (SPI) value for this location is -2.0 or less, indicating exceptional drought (D4) conditions.
D3 (SPI of -1.9 to -1.6)
The Standardized Precipitation Index (SPI) value for this location is between -1.9 to -1.6, indicating extreme drought (D3) conditions.
D2 (SPI of -1.5 to -1.3)
The Standardized Precipitation Index (SPI) value for this location is between -1.5 to -1.3, indicating severe drought (D2) conditions.
D1 (SPI of -1.2 to -0.8)
The Standardized Precipitation Index (SPI) value for this location is between -1.2 to -0.8, indicating moderate drought (D1) conditions.
D0 (SPI of -0.7 to -0.5)
The Standardized Precipitation Index (SPI) value for this location is between -0.7 to -0.5, indicating abnormally dry (D0) conditions.
Wet Conditions
W0 (SPI of 0.5 to 0.7)
The Standardized Precipitation Index (SPI) value for this location is between 0.5 to 0.7, indicating abnormally wet (W0) conditions.
W1 (SPI of 0.8 to 1.2)
The Standardized Precipitation Index (SPI) value for this location is between 0.8 to 1.2, indicating moderate wet (W1) conditions.
W2 (SPI of 1.3 to 1.5)
The Standardized Precipitation Index (SPI) value for this location is between 1.3 to 1.5, indicating severe wet (W2) conditions.
W3 (SPI of 1.6 to 1.9)
The Standardized Precipitation Index (SPI) value for this location is between 1.6 to 1.9, indicating extreme wet (W3) conditions.
W4 (SPI of 2.0 or more)
The Standardized Precipitation Index (SPI) value for this location is 2.0 or greater, indicating exceptional wet (W4) conditions.
Drought results from an imbalance between water supply and water demand. The Standardized Precipitation Index (SPI) measures water supply, specifically precipitation. SPI captures how observed precipitation (rain, hail, snow) deviates from the climatological average over a given time period—in this case, over the 9 months leading up to the selected date. Red hues indicate drier conditions, while blue hues indicate wetter conditions. Data are available monthly from 1895–present. Learn more.
Source: NOAA's National Centers for Environmental Information
Dry Conditions
D4 (PMDI of -5.0 or less)
Tree rings were used to reconstruct a Palmer Modified Drought Index (PMDI) value for each June–August, estimating relative dryness. The PMDI value for this location is -5.0 or less, indicating exceptional drought (D4) conditions.
D3 (PMDI of -4.9 to -4.0)
Tree rings were used to reconstruct a Palmer Modified Drought Index (PMDI) value for each June–August, estimating relative dryness. The PMDI value for this location is -4.9 to -4.0, indicating extreme drought (D3) conditions.
D2 (PMDI of -3.9 to -3.0)
Tree rings were used to reconstruct a Palmer Modified Drought Index (PMDI) value for each June–August, estimating relative dryness. The PMDI value for this location is -3.9 to -3.0, indicating severe drought (D2) conditions.
D1 (PMDI of -2.9 to -2.0)
Tree rings were used to reconstruct a Palmer Modified Drought Index (PMDI) value for each June–August, estimating relative dryness. The PMDI value for this location is -2.9 to -2.0, indicating moderate drought (D1) conditions.
D0 (PMDI of -1.9 to -1.0)
Tree rings were used to reconstruct a Palmer Modified Drought Index (PMDI) value for each June–August, estimating relative dryness. The PMDI value for this location is -1.9 to -1.0, indicating abnormally dry (D0) conditions.
Wet Conditions
W0 (PMDI of 1.0 to 1.9)
Tree rings were used to reconstruct a Palmer Modified Drought Index (PMDI) value for each June–August, estimating relative dryness. The PMDI value for this location is 1.0 to 1.9, indicating abnormally wet (W0) conditions.
W1 (PMDI of 2.0 to 2.9)
Tree rings were used to reconstruct a Palmer Modified Drought Index (PMDI) value for each June–August, estimating relative dryness. The PMDI value for this location is 2.0 to 2.9, indicating moderate wet (W1) conditions.
W2 (PMDI of 3.0 to 3.9)
Tree rings were used to reconstruct a Palmer Modified Drought Index (PMDI) value for each June–August, estimating relative dryness. The PMDI value for this location is 3.0 to 3.9, indicating severe wet (W2) conditions.
W3 (PMDI of 4.0 to 4.9)
Tree rings were used to reconstruct a Palmer Modified Drought Index (PMDI) value for each June–August, estimating relative dryness. The PMDI value for this location is 4.0 to 4.9, indicating extreme wet (W3) conditions.
W4 (PMDI of 5.0 or greater)
Tree rings were used to reconstruct a Palmer Modified Drought Index (PMDI) value for each June–August, estimating relative dryness. The PMDI value for this location is 5.0 or greater, indicating exceptional wet (W4) conditions.
In paleoclimatology, proxy climate data (e.g., tree rings, ocean sediments) can allow us to reconstruct past climate conditions before we had widespread instrumental records. The Living Blended Drought Atlas, shown here, estimates average drought conditions each summer (June–August) as far back as the year 0 by combining tree-ring reconstructions and instrumental records. Red hues indicate drier conditions, while blue hues indicate wetter conditions.
Source: NOAA's National Centers for Environmental Information
The Mississippi River Basin Drought and Water Dashboard provides a suite of curated and customized drought information, tools, and data to support communications and decision-making across the Mississippi River Basin. This federal resource will assist state, tribal, and local governments; the private sector; and the public to proactively prepare for and mitigate the impacts of drought and low water in their communities.
The Dashboard is the result of cross-agency collaboration between NOAA's National Integrated Drought Information System (NIDIS), National Centers for Environmental Information, and National Weather Service; the U.S. Army Corps of Engineers; the U.S. Coast Guard; the U.S. Geological Survey; and state and local partners. NIDIS is an interagency program within the Climate Program Office, which is part of NOAA's Office of Oceanic and Atmospheric Research. NIDIS launched the Dashboard in 2025 following extensive outreach to gather feedback from the Mississippi River Basin region, and may modify the Dashboard as new information and tools are available.