Day 8-14 U.S. Hazards Outlook with Rapid Onset Drought
NOAA / National Weather Service / National Centers for Environmental Prediction / Climate Prediction Center (CPC)
The National Weather Service Climate Prediction Center (CPC) U.S. Hazards Outlook is released every weekday and targets the Day 8–14 (Week 2) forecast period for potential hazardous conditions related to temperature, precipitation, wind, snow, and Rapid Onset Drought (ROD). The forecast is mainly represented in probabilities—slight risk (20%–40%), moderate risk (40%–60%) and high risk (≥60%)—with the exclusion of a few variables (e.g., Rapid Onset Drought, frozen precipitation, and flooding), which are denoted in categorical format without associated probabilities. The National Weather Service releases a composite map in addition to the separate probabilistic maps, showing any categorical variables, as well as highlighted regions drawn as a moderate risk (≥40% probability) on any of the temperature, precipitation, and wind probabilistic maps.
In May 2022, CPC began issuing a Rapid Onset Drought risk product within the Day 8–14 U.S. Hazards Outlook. This product highlights areas where rapid drought development (sometimes known as “flash drought”) may occur in the coming 2–4 weeks as depicted by the U.S. Drought Monitor. Forecasters use initial conditions, such antecedent dryness (e.g., soil moisture), and skillful temperature and precipitation outlooks during the next 2 weeks to communicate the risk of rapidly developing drought. The Rapid Onset Drought product became operational in May 2024.
Rapid Onset Drought risk areas give end users, particularly farmers making decisions about planting and supplemental irrigation, an early warning of the potential for hot and dry conditions. This product supplements CPC’s Monthly Drought Outlook and is an important step toward comprehensive flash drought monitoring and prediction.
The Day 8–14 U.S. Hazards Outlook contains human-drawn delineations of where conditions are expected to have the potential of posing a hazard to life or property. National Weather Service forecasters use set criteria for designating a hazard area, but also apply a subjective decision factor. A cold snap in the winter or a heatwave in the summer are likely threats to life and property, while a cool period in July is not.
The Day 8–14 U.S. Hazards Outlook is released daily before 3 p.m. EST. However, Rapid Onset Drought risk hazards are only released on Thursdays between April 1–October 31, with potential updates on the following Monday. Excessive Heat hazards are issued between May–September.
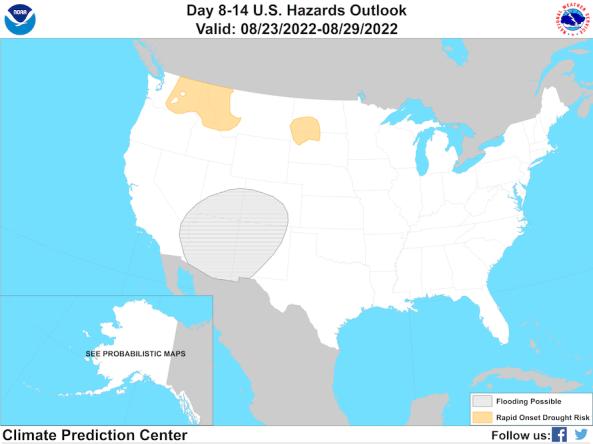
This National Weather Service hazard outlook map shows the risk of rapid onset drought (flash drought) development during the next 2–4 weeks.
Forecasters use initial conditions, like existing dryness (e.g., soil moisture), temperature, and precipitation outlooks, to assess the risk of rapid drought development. Rapid onset drought risk areas (yellow) can give users, such as farmers making decisions about planting and supplemental irrigation, an early warning of the potential for hot and dry conditions.
This National Weather Service (NWS) Day 8–14 Hazard Outlook map shows the risk of excessive heat (red) next week (8 days from now through 14 days from now).
An excessive heat hazard typically indicates a 40% or greater chance of exceeding widespread NWS Heat Advisory criteria, based on the Heat Index for your location.
Air temperature can have wide-ranging effects on natural processes. Warmer air temperatures increase evapotranspiration—which is the combination of evaporation from the soil and bodies of water and transpiration from plants—and lower soil moisture.
Learn MoreFlash drought is the rapid onset or intensification of drought. Unlike slow-evolving drought, which is caused by a decline in precipitation, flash drought occurs when low precipitation is accompanied by abnormally high temperatures, high winds, and/or changes in radiation. These sometimes-rapid changes can quickly raise evapotranspiration rates and remove available water from the landscape.
Learn MoreDrought can reduce the water availability and water quality necessary for productive farms, ranches, and grazing lands, resulting in significant negative direct and indirect economic impacts to the agricultural sector. Monitoring agricultural drought typically focuses on examining levels of precipitation, evaporative demand, soil moisture, and surface/groundwater quantity and quality.
Learn MoreExtreme weather events can interact or cascade—where one disaster event triggers or changes the probability of another event. For example, drought conditions can increase the probability of large-scale wildfires, and droughts are often accompanied by extreme heat. By including drought in multi-hazard planning, a community can consolidate its resources and develop coordinated responses before a disaster.
Learn MoreAir temperature can have wide-ranging effects on natural processes. Warmer air temperatures increase evapotranspiration—which is the combination of evaporation from the soil and bodies of water and transpiration from plants—and lower soil moisture.
Learn MoreFlash drought is the rapid onset or intensification of drought. Unlike slow-evolving drought, which is caused by a decline in precipitation, flash drought occurs when low precipitation is accompanied by abnormally high temperatures, high winds, and/or changes in radiation. These sometimes-rapid changes can quickly raise evapotranspiration rates and remove available water from the landscape.
Learn MoreDrought can reduce the water availability and water quality necessary for productive farms, ranches, and grazing lands, resulting in significant negative direct and indirect economic impacts to the agricultural sector. Monitoring agricultural drought typically focuses on examining levels of precipitation, evaporative demand, soil moisture, and surface/groundwater quantity and quality.
Learn MoreExtreme weather events can interact or cascade—where one disaster event triggers or changes the probability of another event. For example, drought conditions can increase the probability of large-scale wildfires, and droughts are often accompanied by extreme heat. By including drought in multi-hazard planning, a community can consolidate its resources and develop coordinated responses before a disaster.
Learn More2-4 Week Hazard Outlook
Risk of Rapid Onset Drought
National Weather Service forecasters predict that rapid drought development (also known as "flash drought") may occur in the coming 2–4 weeks.
Hazard Outlook for Days 8–14
Risk of Excessive Heat
This area has a risk for excessive heat next week (8 days from now through 14 days from now). National Weather Service forecasters predict a 40% or greater chance of exceeding widespread NWS Heat Advisory criteria, based on the Heat Index for your location.
This National Weather Service hazard outlook map shows the risk of rapid onset drought (flash drought) development during the next 2–4 weeks.
Forecasters use initial conditions, like existing dryness (e.g., soil moisture), temperature, and precipitation outlooks, to assess the risk of rapid drought development. Rapid onset drought risk areas (yellow) can give users, such as farmers making decisions about planting and supplemental irrigation, an early warning of the potential for hot and dry conditions.
This National Weather Service (NWS) Day 8–14 Hazard Outlook map shows the risk of excessive heat (red) next week (8 days from now through 14 days from now).
An excessive heat hazard typically indicates a 40% or greater chance of exceeding widespread NWS Heat Advisory criteria, based on the Heat Index for your location.
National Weather Service (NWS) forecasters issue rapid onset drought (ROD) risk areas on Thursdays, with the potential for updates on the following Mondays, from April 1–October 31.
The NWS Climate Prediction Center hazards outlook is issued between 2–5 p.m. ET, and this Drought.gov map updates at 7 p.m. ET.
The National Weather Service's Climate Prediction Center issues the Day 8–14 Hazards Outlook daily Monday–Friday between 2–5 p.m. ET, and this Drought.gov map updates daily Monday–Friday around 7 p.m. ET.
Air temperature can have wide-ranging effects on natural processes. Warmer air temperatures increase evapotranspiration—which is the combination of evaporation from the soil and bodies of water and transpiration from plants—and lower soil moisture.
Learn MoreFlash drought is the rapid onset or intensification of drought. Unlike slow-evolving drought, which is caused by a decline in precipitation, flash drought occurs when low precipitation is accompanied by abnormally high temperatures, high winds, and/or changes in radiation. These sometimes-rapid changes can quickly raise evapotranspiration rates and remove available water from the landscape.
Learn MoreDrought can reduce the water availability and water quality necessary for productive farms, ranches, and grazing lands, resulting in significant negative direct and indirect economic impacts to the agricultural sector. Monitoring agricultural drought typically focuses on examining levels of precipitation, evaporative demand, soil moisture, and surface/groundwater quantity and quality.
Learn MoreExtreme weather events can interact or cascade—where one disaster event triggers or changes the probability of another event. For example, drought conditions can increase the probability of large-scale wildfires, and droughts are often accompanied by extreme heat. By including drought in multi-hazard planning, a community can consolidate its resources and develop coordinated responses before a disaster.
Learn MoreAir temperature can have wide-ranging effects on natural processes. Warmer air temperatures increase evapotranspiration—which is the combination of evaporation from the soil and bodies of water and transpiration from plants—and lower soil moisture.
Learn MoreFlash drought is the rapid onset or intensification of drought. Unlike slow-evolving drought, which is caused by a decline in precipitation, flash drought occurs when low precipitation is accompanied by abnormally high temperatures, high winds, and/or changes in radiation. These sometimes-rapid changes can quickly raise evapotranspiration rates and remove available water from the landscape.
Learn MoreDrought can reduce the water availability and water quality necessary for productive farms, ranches, and grazing lands, resulting in significant negative direct and indirect economic impacts to the agricultural sector. Monitoring agricultural drought typically focuses on examining levels of precipitation, evaporative demand, soil moisture, and surface/groundwater quantity and quality.
Learn MoreExtreme weather events can interact or cascade—where one disaster event triggers or changes the probability of another event. For example, drought conditions can increase the probability of large-scale wildfires, and droughts are often accompanied by extreme heat. By including drought in multi-hazard planning, a community can consolidate its resources and develop coordinated responses before a disaster.
Learn MoreHow to
How do I use the site?
- Use the checkboxes above the interactive map to select between a composite day 8–14 map and a probabilistic dat 8–14 map, as well as hazard types: temperature, precipitation, snow, wind, and rapid onset drought.
- Click the colored regions on the interactive map to view more information about each hazard.
- Users can also view a static map image of the Day 8–14 U.S. Hazards Outlook. Just select "Day 8–14" to view the composite map, or select one of the experimental probabilistic outlooks: Temperature Hazards, Precipitation Hazards, Wind Hazards, or Snow Hazards.
- Below these maps, users can view a detailed summary of the current U.S. Hazards Outlook.
Access
U.S. Day 8–14 (Week 2) Hazards Outlook: View probabilistic and composite hazards outlooks, download data, and view detailed summary of the outlook.
U.S. Hazards Archive: View past probabilistic and composite Day 8–14 U.S. Hazard Outlook maps from October 2008 to the present.
Web Services for CPC Weather Hazards: View web services information for the CPC Day 3–7 and Day 8–14 Hazard Outlooks, including hazard criteria and data downloads.