Winter 2020-21 in Review: A Look Back at Drought Across the U.S. in 8 Maps
U.S. Drought Monitor
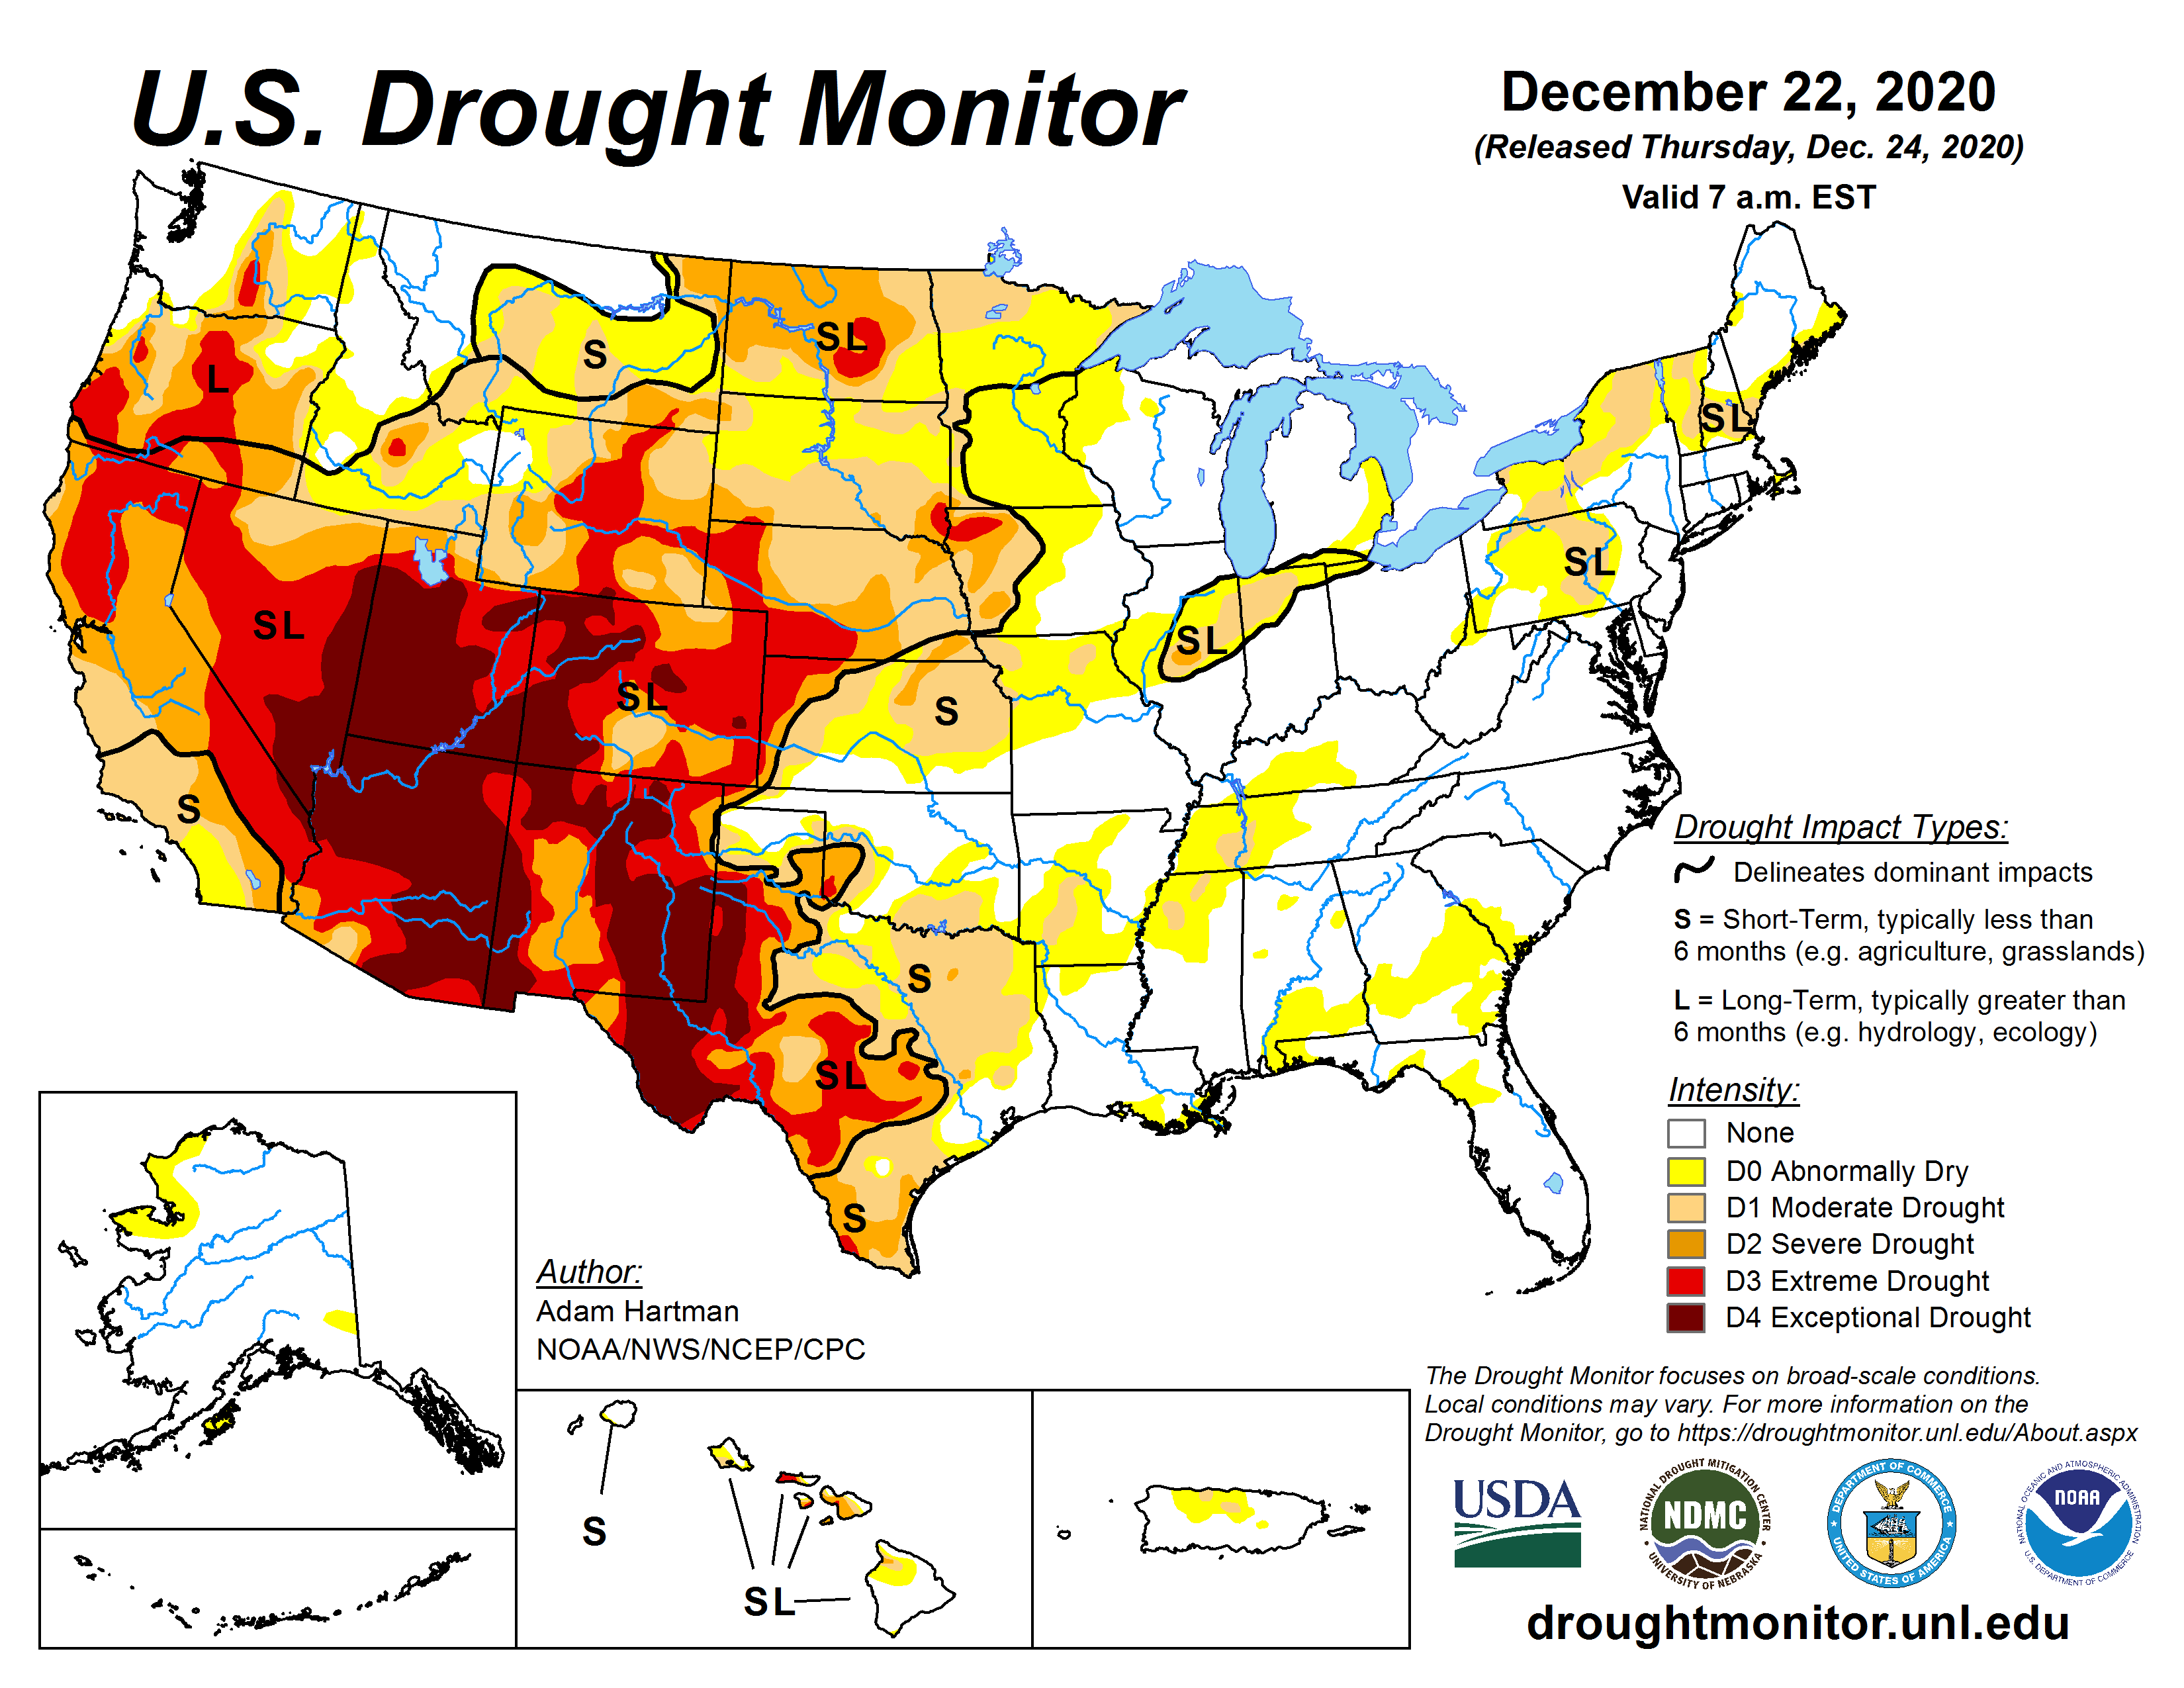
The first U.S. Drought Monitor issued over the winter was on December 22, 2020. As shown on the first map below, drought and dryness covered almost all of the Great Plains and West when winter began, except for parts of the Pacific Northwest and Southern Plains. The epicenter of the drought was the Southwest into the Central Rockies and W. Texas. East of the Plains, drought and dryness persisted in the Midwest, Northeast, and a few pockets in the South, but the intensity was much less than the West.
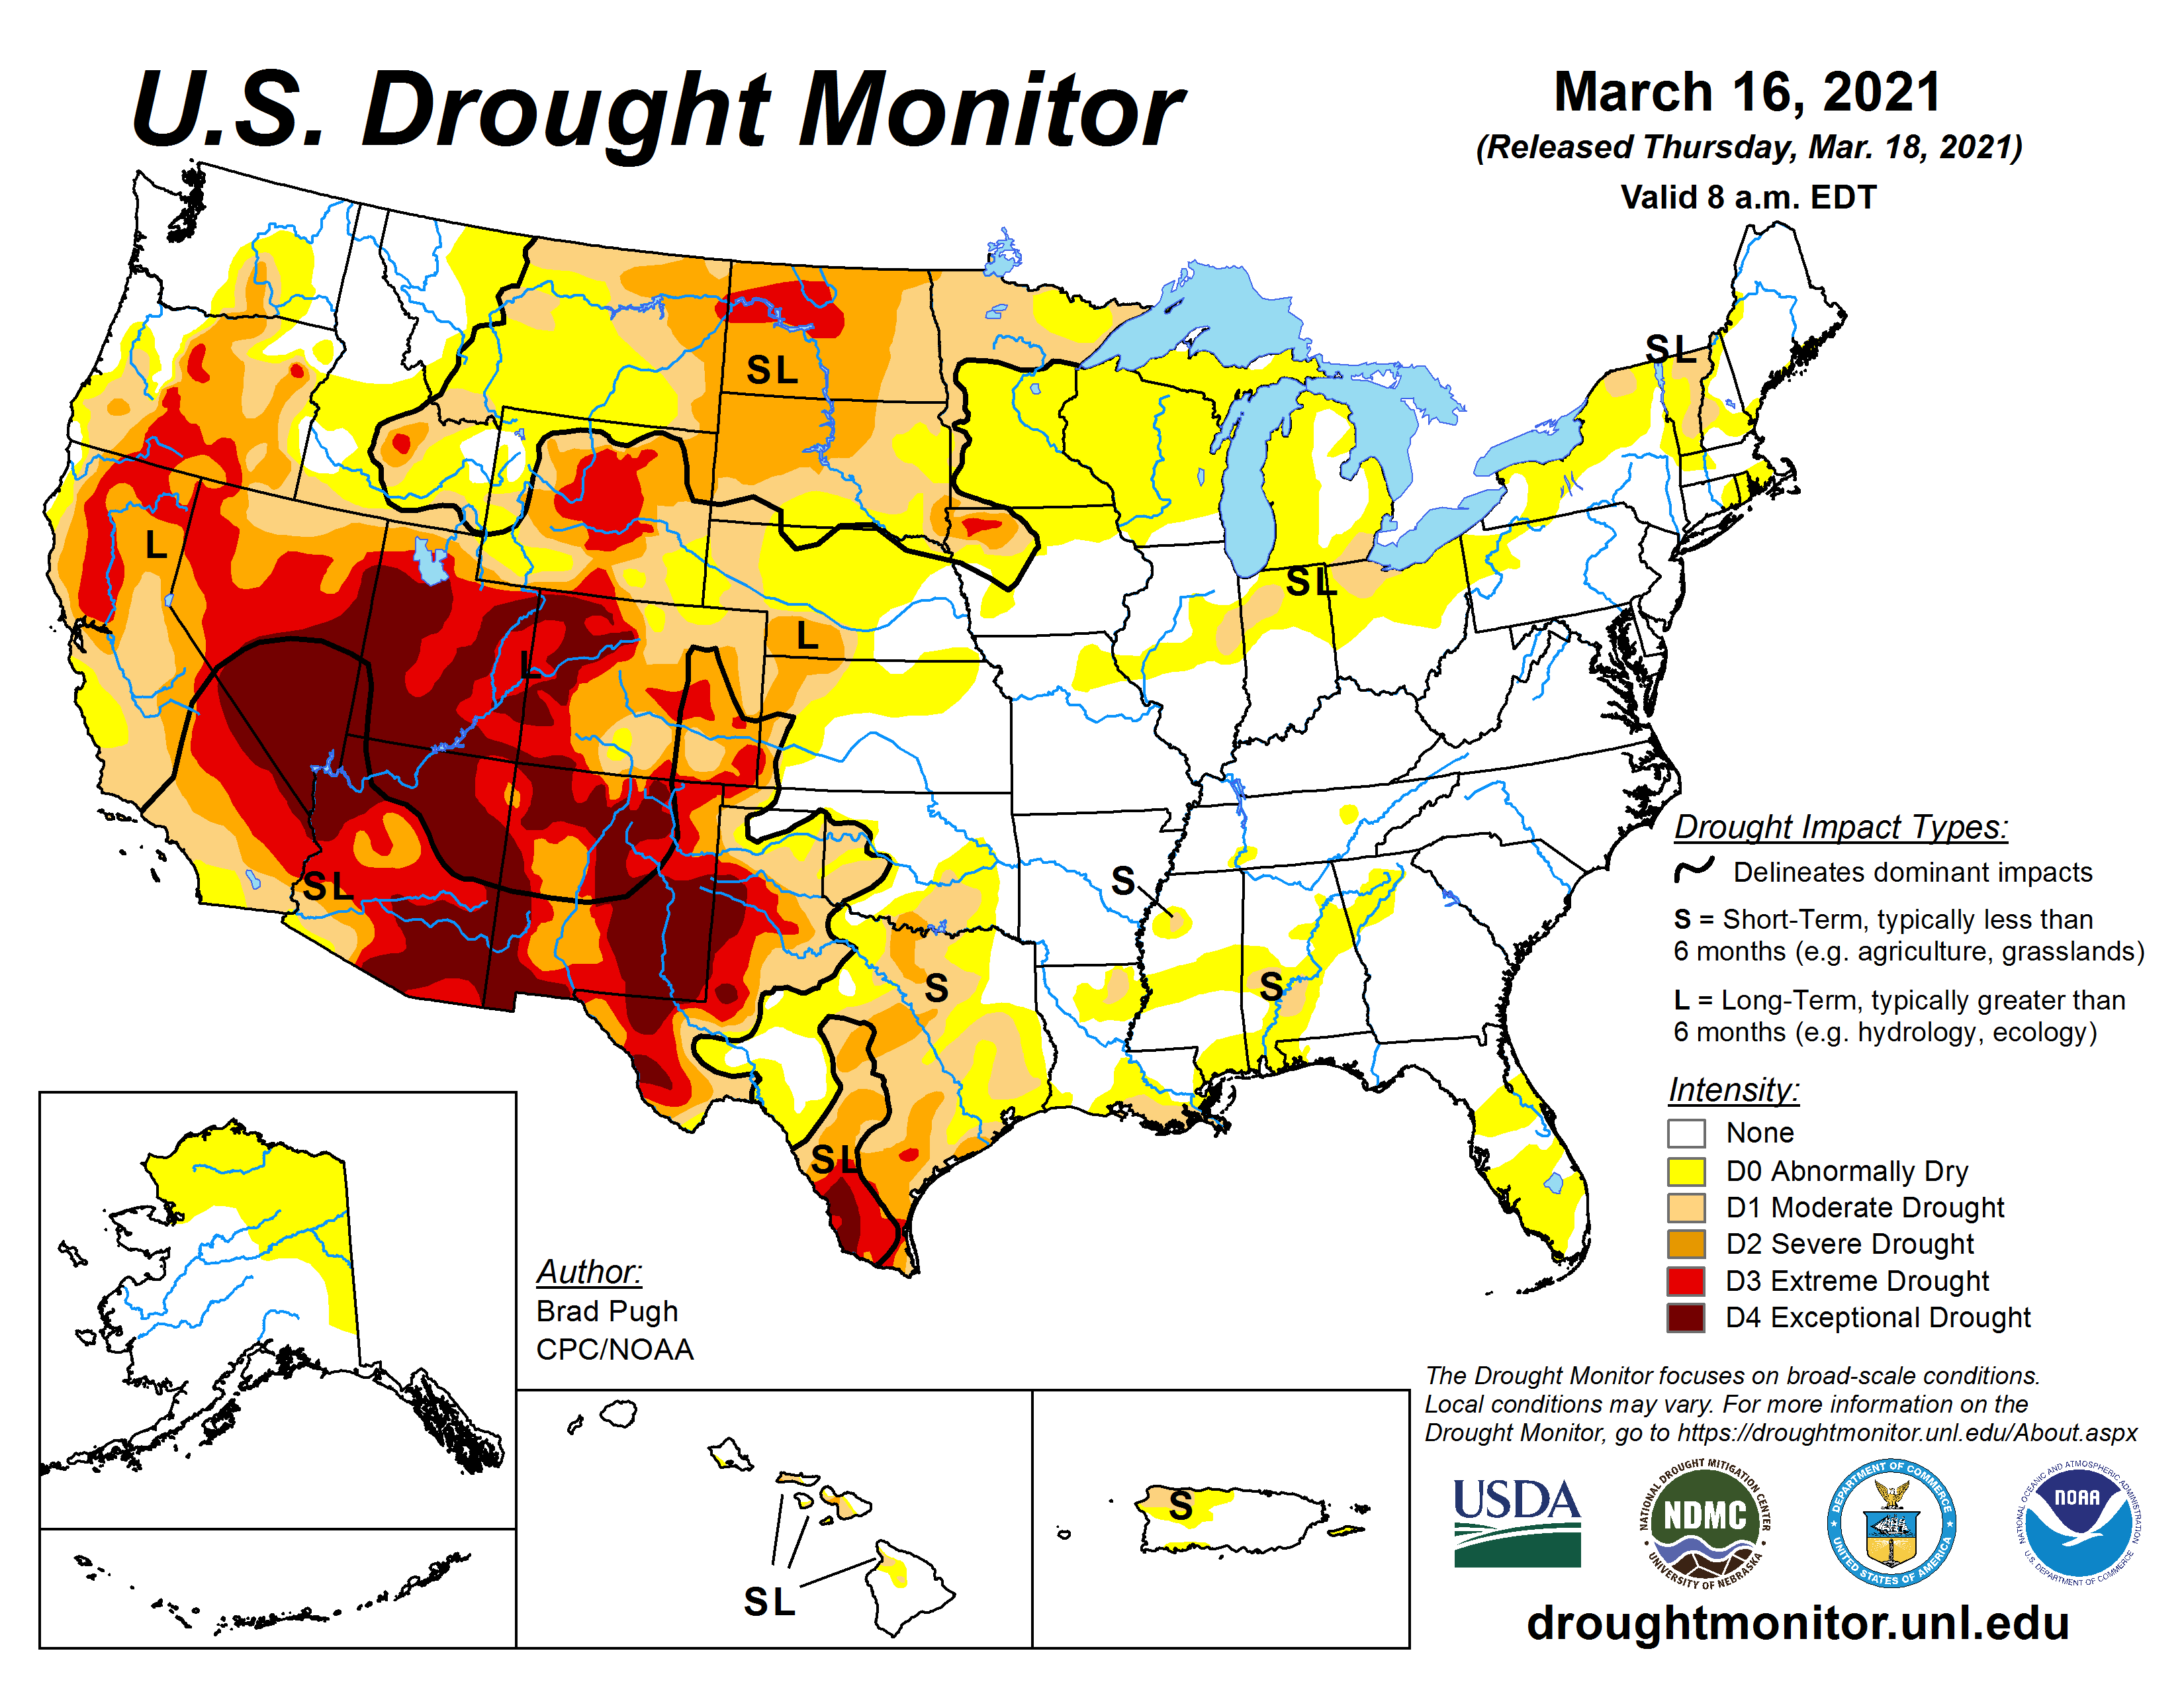
The last U.S. Drought Monitor issued over the winter was on March 16, 2021. In general, drought across the U.S. didn’t change that much, which is a troubling sign for areas that depend on winter precipitation for water supplies, agriculture, and recreation. It could also lead to another bad fire season. Conditions in the Central Plains improved, but the Northern Plains worsened. Conditions in the West slightly improved but are still dire. East of the Plains, areas of Moderate Drought (D1) and Abnormal Dryness (D0) could worsen this spring if normal rains don’t develop.
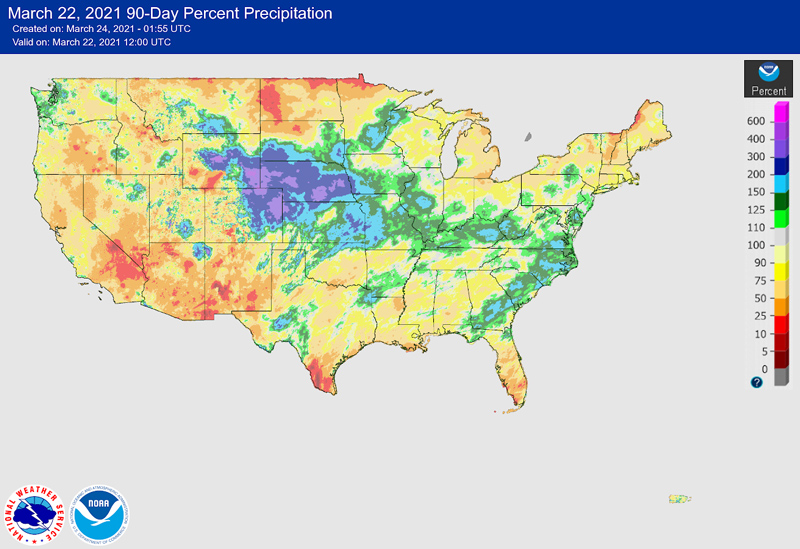
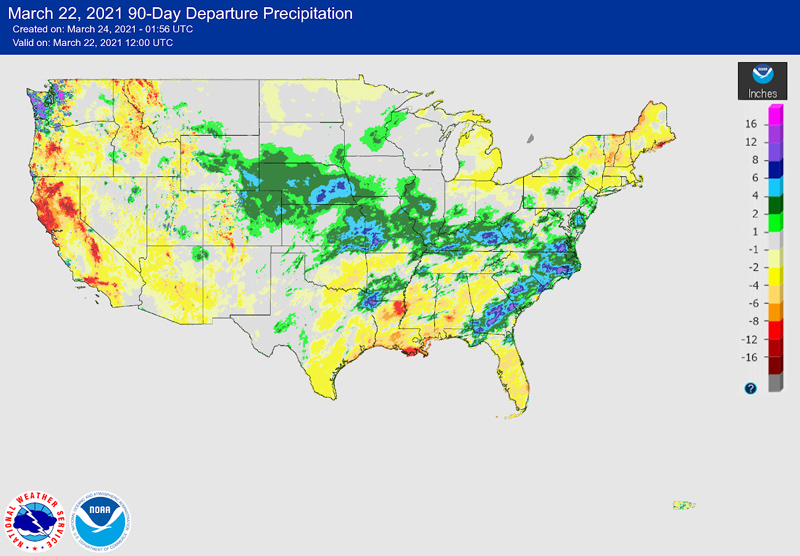
Percent of Normal Precipitation/Departure from Normal Precipitation
As shown on the two maps below, the only drought areas that greatly benefitted from winter precipitation were the Central Plains and parts of the Rockies, and much of that precipitation was from the mid-March storm that dropped feet of snow in CO and WY and inches of rain in KS and NE. Much of the precipitation east of the Plains fell on areas that weren’t in drought. The Southwest and CA remained drier than normal. Two areas that have worsened towards the end of winter: the Northern Plains and S. TX.
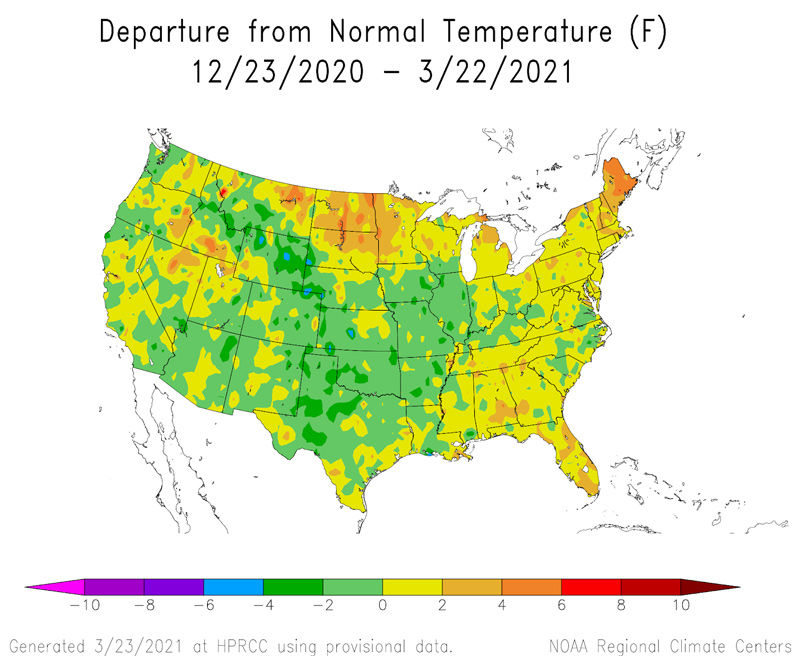
Departure from Normal Temperature
Temperatures were generally colder than normal over the winter for parts of the Midwest all the way to the West Coast. That’s not surprising after the bitter cold that hit Texas and other parts of the U.S. in February. One notable outlier: it was warmer (and drier) in the Northern Plains.
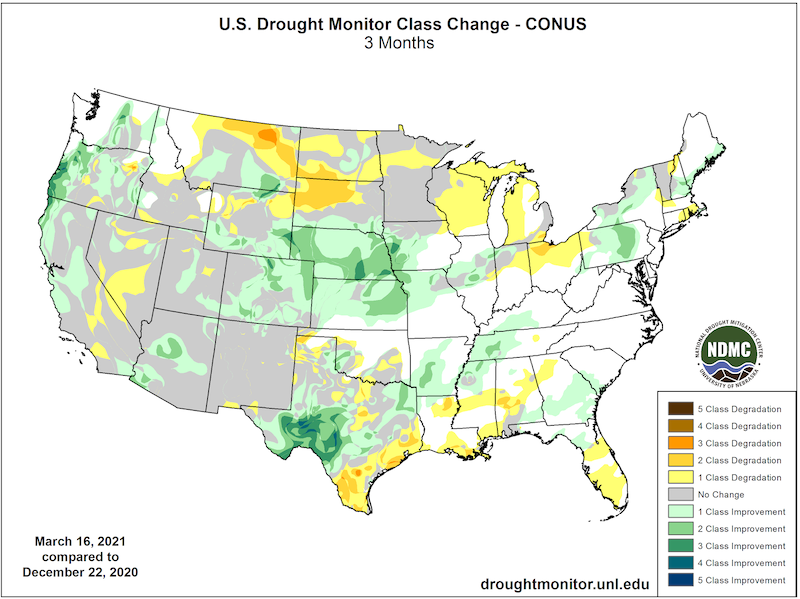
U.S. Drought Monitor Change Map
The greatest areas of drought degradation that took place over the winter were the Northern Plains, South/Southeast TX, the Upper Midwest, and FL. However, the Upper Midwest and FL only moved into Abnormal Dryness (D0). The Northern Plains and S. TX, on the other hand, are dealing with Extreme (D3) and Exceptional (D4) Drought, respectively. The greatest areas of improvements were the Central U.S. (where the big March storm hit) and W. TX. Scattered areas in the West also saw improvements but remain in intense drought.
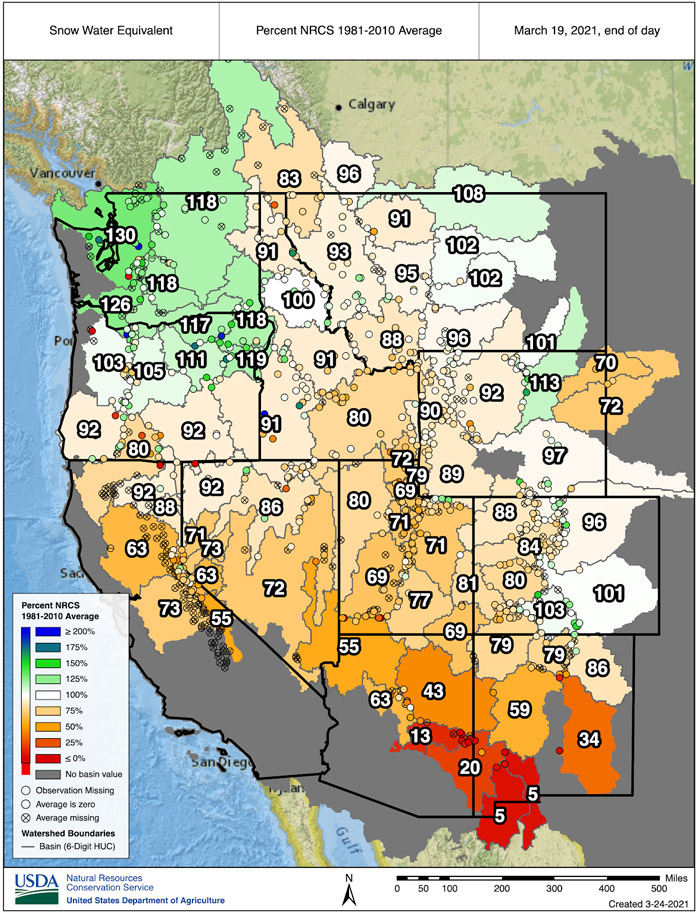
Snow Drought in the West 2020-21
Much of the West began the winter in drought, and the snowfall in 2020-21 didn’t do much to help conditions. The only areas that had average to above-average snow water equivalent (SWE) as of March 19 (the last day of winter), were parts of the Pacific Northwest, Northern Rockies, and the areas in CO and WY hit by the March blizzard. Some weak-to-moderate storms occurred in February and March in the Sierra Nevada, but it wasn’t enough. Similarly, snowpack improved in parts of OR, UT, CO, and WY in March, but SWE deficits were quite large prior to these improvements. Most of Alaska remained free of snow drought with the exception of the Koyukuk River Basin in north-central Alaska that drains part of the south slope of the Brooks Range.
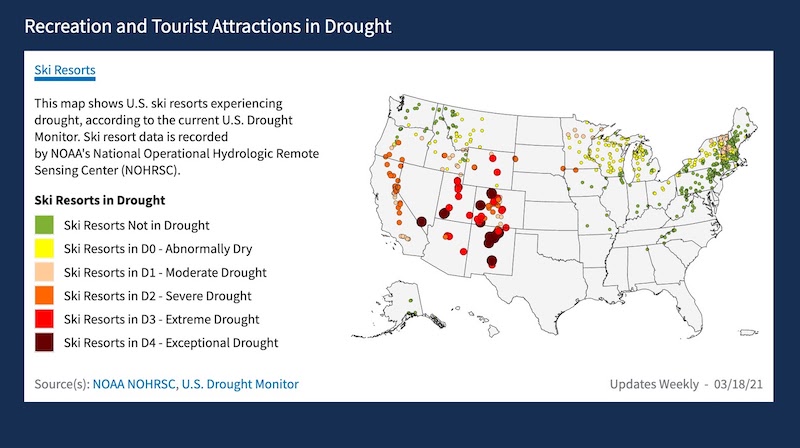
Ski Areas in Drought
The ski resorts map below, found on the Recreation and Tourist Attractions By Sector page on the new U.S. Drought Portal, shows that 437 resorts are in drought areas, according to the March 18, 2021 U.S. Drought Monitor.