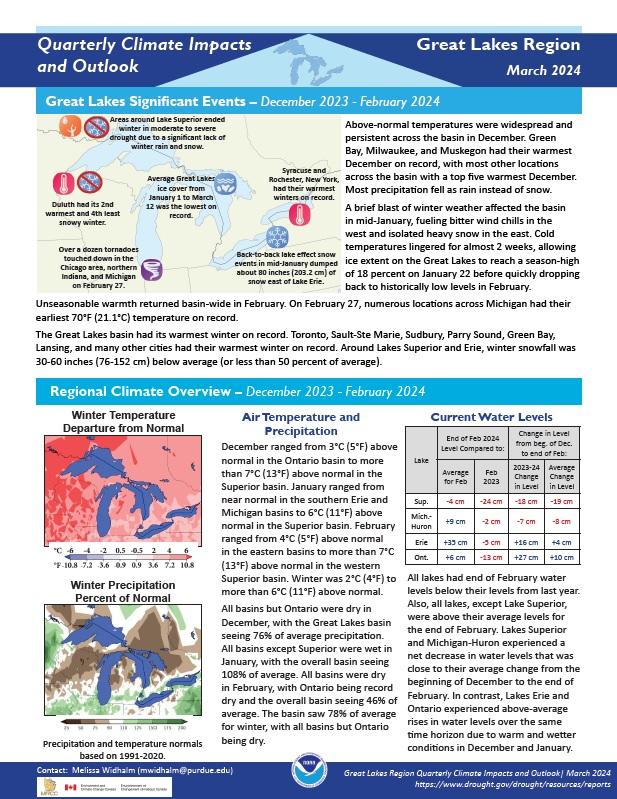
Quarterly Climate Impacts and Outlook for the Great Lakes Region for December 2023–February 2024. Dated March 2024.
Winter was 2°C (4°F) to more than 6°C (11°F) above normal. The basin saw 78% of average precipitation for winter, with all basins but Ontario being dry.
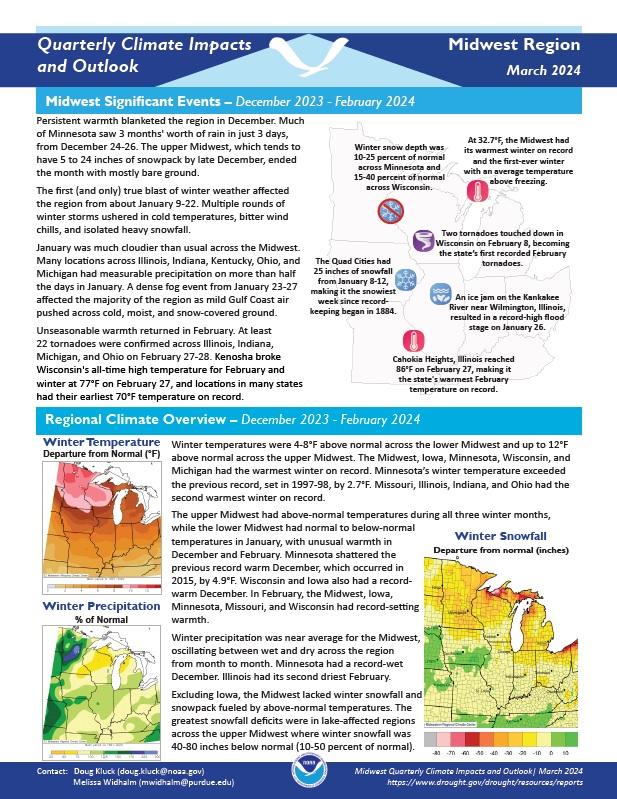
Quarterly Climate Impacts and Outlook for the Midwest Region for December 2023–January 2024. Dated March 2024.
Winter temperatures were 4-8°F above normal across the lower Midwest and up to 12°F
above normal across the upper Midwest. The Midwest, Iowa, Minnesota, Wisconsin, and
Michigan had the warmest winter on record. Winter precipitation was near average for the Midwest, oscillating between wet and dry across the region from month to month. Minnesota had a record-wet December. Illinois had its second driest February.
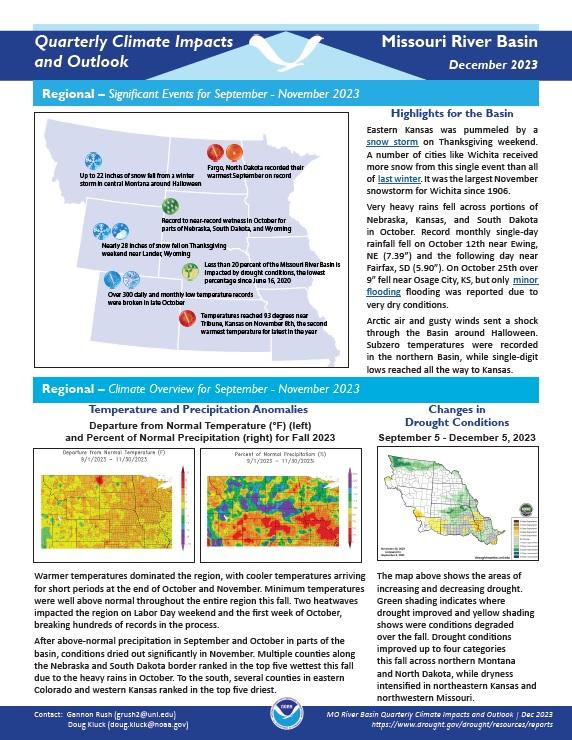
Quarterly Climate Impacts and Outlook for the Missouri River Basin for September–November 2023. Dated December 2023.
Warmer temperatures dominated the region, with cooler temperatures arriving for short periods at the end of October and November. Minimum temperatures were well above normal throughout the entire region this fall. After above-normal precipitation in September and October in parts of the basin, conditions dried out significantly in November.
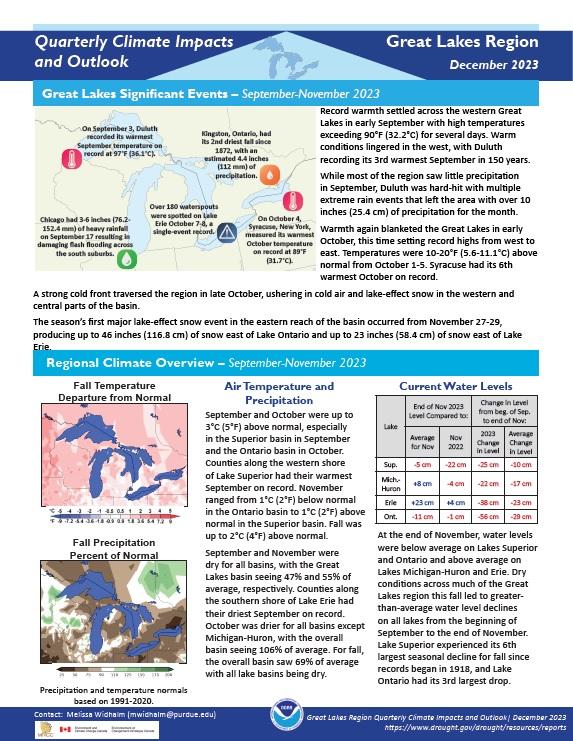
Quarterly Climate Impacts and Outlook for the Great Lakes Region for September–November 2023. Dated December 2023.
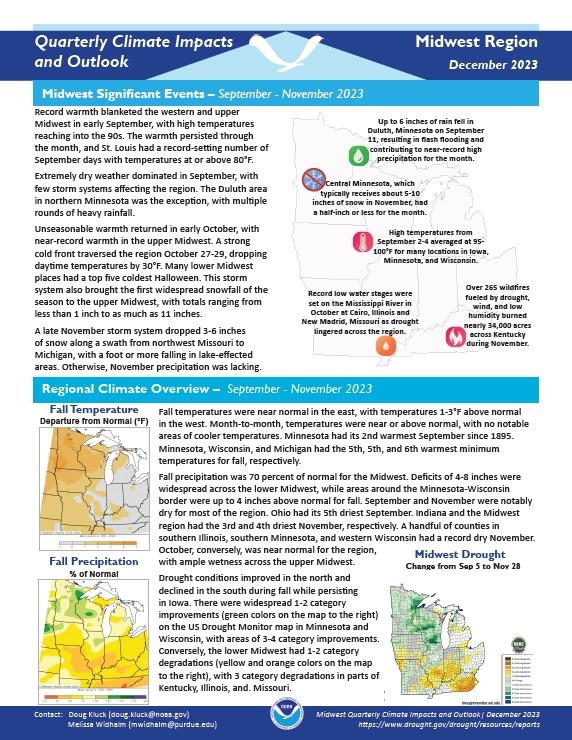
Fall temperatures in the region were up to 2°C (4°F) above normal. The overall basin saw 69% of average precipitation with all lake basins being dry.
Quarterly Climate Impacts and Outlook for the Midwest Region for September–November 2023. Dated December 2023.
Fall temperatures were near normal in the east, with temperatures 1–3°F above normal in the west. Month-to-month, temperatures were near or above normal, with no notable areas of cooler temperatures. Fall precipitation was 70% of normal for the Midwest. Deficits of 4–8 inches were widespread across the lower Midwest, while areas around the Minnesota-Wisconsin border were up to 4 inches above normal for fall.
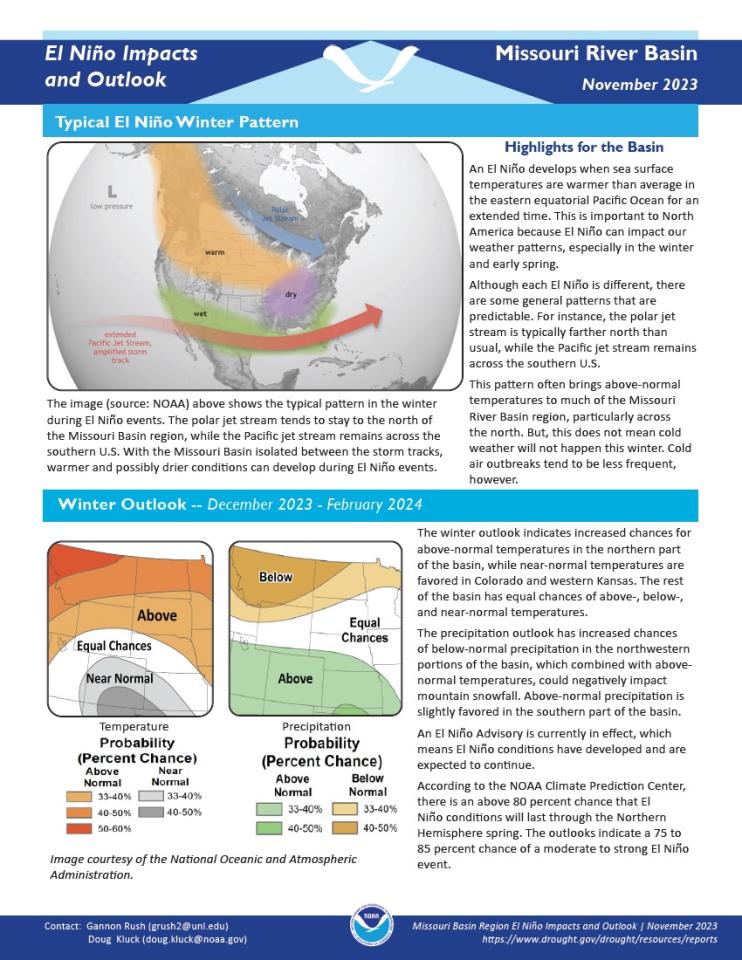
This handout provides information on the typical EL Niño winter pattern; the El Niño outlook; potential winter and spring impacts; and comparisons of conditions during previous El Niño years for the Missouri River Basin region. Updated November 2023.
NOAA’s Regional Climate Services Program created these outlooks to inform the public about climate impacts within their respective regions. Each regional report contains easy-to-understand language, and anyone can access them through the U.S. Drought Portal.
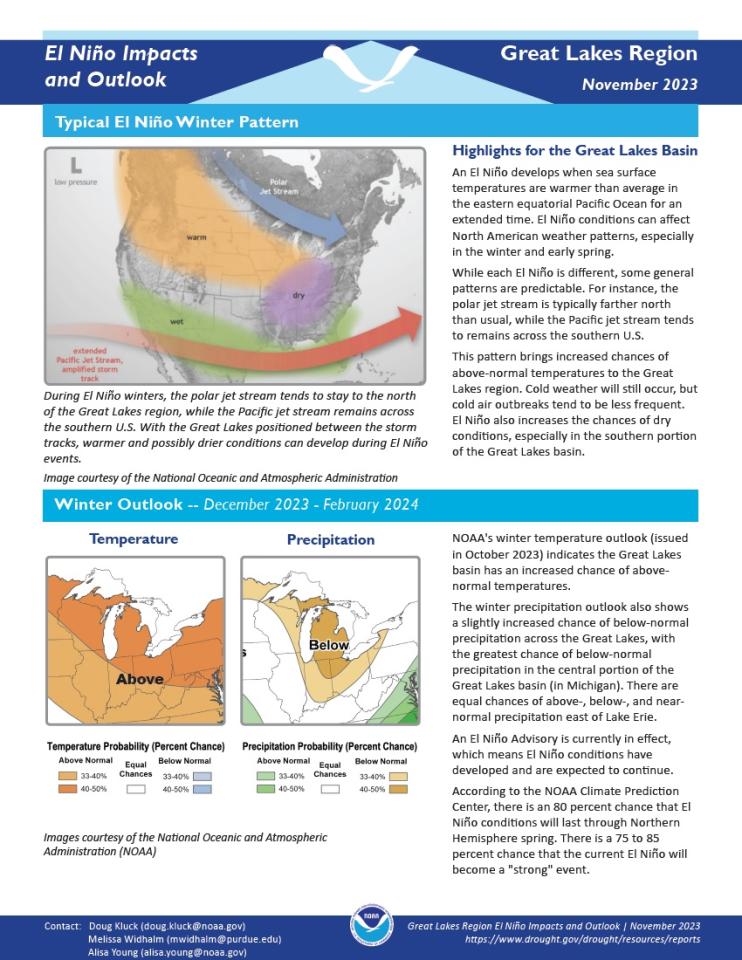
This handout provides information on the typical El Niño winter pattern; the El Niño outlook; potential winter and spring impacts; and comparisons of conditions during previous El Niño years for the Great Lakes region. Updated November 2023.
NOAA’s Regional Climate Services Program created these Outlooks to inform the public about climate impacts within their respective regions. Each regional report contains easy-to-understand language, and anyone can access them through the U.S. Drought Portal.
This report provides information on the typical El Niño winter pattern; the El Niño outlook; potential impacts; and comparisons of conditions during previous El Niño years for the Midwest U.S. Updated November 2023.
NOAA’s Regional Climate Services Program created these outlooks to inform the public about climate impacts within their respective regions. Each regional report contains easy-to-understand language, and anyone can access them through the U.S. Drought Portal.
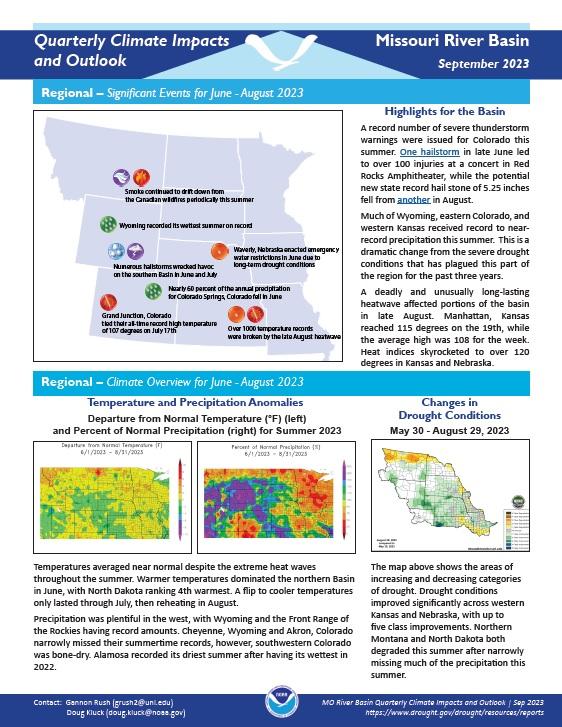
Quarterly Climate Impacts and Outlook for the Missouri River Basin for June–August 2023. Dated September 2023.
Temperatures averaged near normal despite the extreme heat waves throughout the summer. Precipitation was plentiful in the west, with Wyoming and the Front Range of the Rockies receiving record amounts. Cheyenne, Wyoming and Akron, Colorado narrowly missed their summertime records; however, southwestern Colorado was bone-dry.
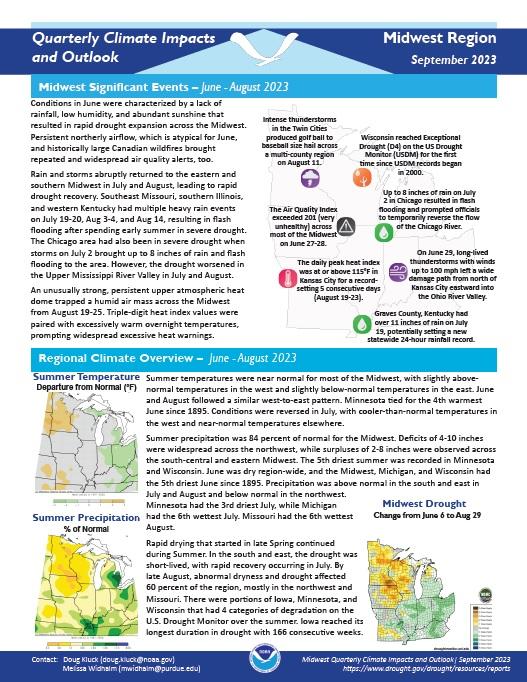
Quarterly Climate Impacts and Outlook for the Midwest Region for June–August 2023. Dated September 2023.
Summer temperatures were near normal for most of the Midwest, with slightly above-normal temperatures in the west and slightly below-normal temperatures in the east. Summer precipitation was 84% of normal for the Midwest. Deficits of 4–10 inches were widespread across the northwest, while surpluses of 2–8 inches were observed across the south-central and eastern Midwest.


