For the latest forecasts and critical weather information, visit weather.gov.
During late 2016, the National Integrated Drought Information System (NIDIS), the National Drought Mitigation Center (NDMC), the Midwestern Regional Climate Center (MRCC), and other regional partners convened four stakeholder meetings in the Midwest Drought Early Warning System (DEWS).
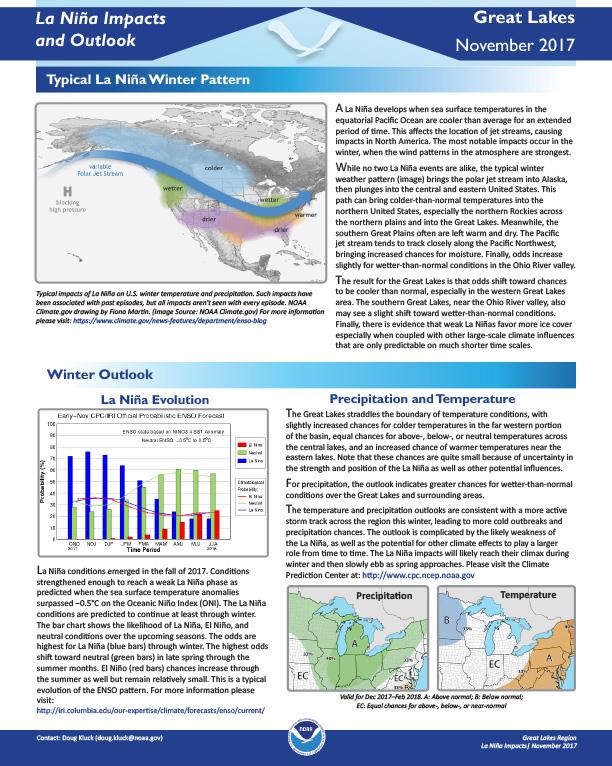
Quarterly Climate Impacts and Outlook for the Great Lakes Region for September – November 2017. Dated December 2017.
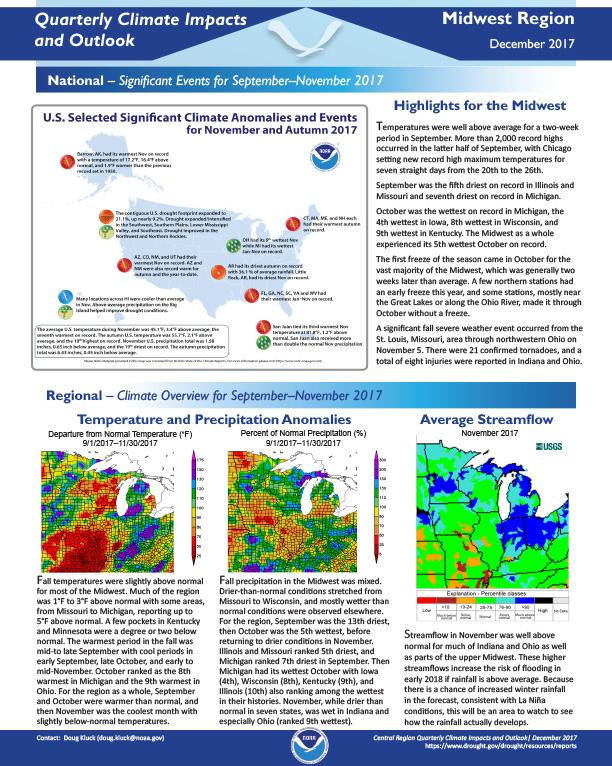
Quarterly Climate Impacts and Outlook for the Midwest Region for September – November 2017. Dated December 2017.
Defines La Niña; gives outlook for winter temperatures and precipitation; possible effects of La Niña on the Great Lakes region, including agriculture, the economy, water levels and lake ice.
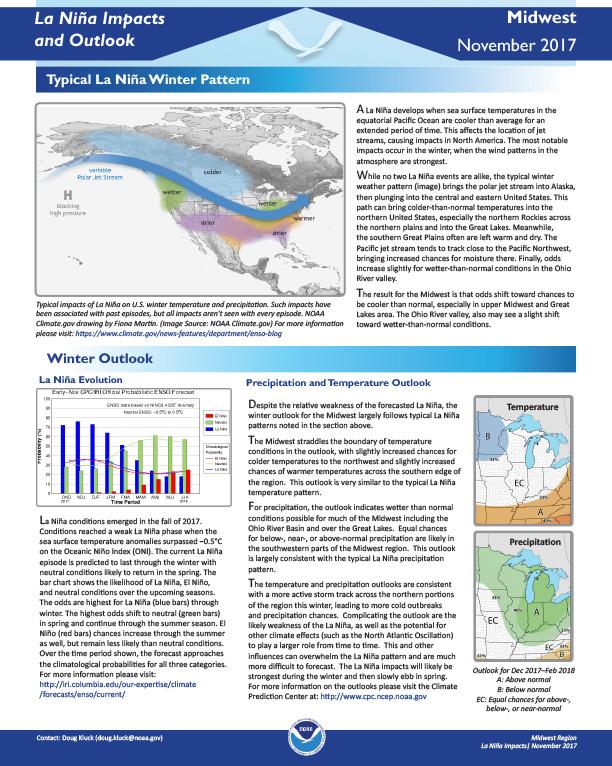
Discussion of La Niña in winter; outlook for precipitation and temperatures; impacts on agriculture, ecosystems/rivers, and the economy; how past La Niñas have unfolded.
NOAA’s Regional Climate Services Program created these Outlooks to inform the public about climate impacts within their respective regions. Each regional report contains easy-to-understand language, and anyone can access them through the Drought Portal at https://www.drought.gov/drought/resources/reports.
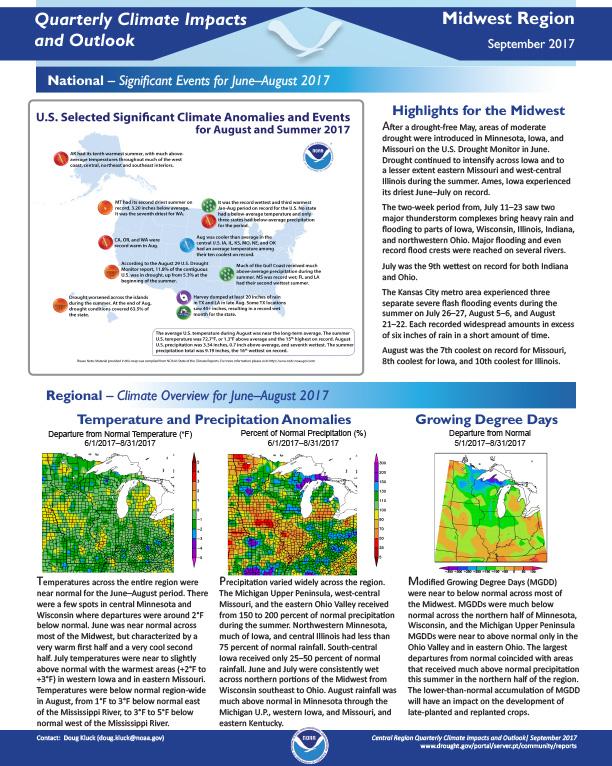
Quarterly Climate Impacts and Outlook for the Midwest Region for June – August 2017. Dated September 2017.
After a drought-free May, areas of moderate drought were introduced in Minnesota, Iowa, and Missouri on the U.S. Drought Monitor in June. Drought continued to intensify across Iowa and to a lesser extent eastern Missouri and west-central Illinois during the summer. Ames, Iowa experienced its driest June–July on record.
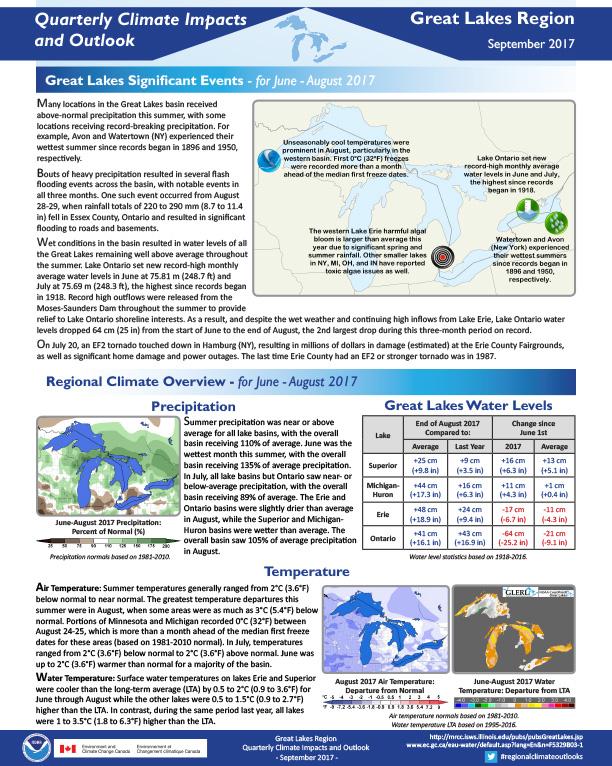
Quarterly Climate Impacts and Outlook for the Great Lakes Region for June – August 2017. Dated September 2017.
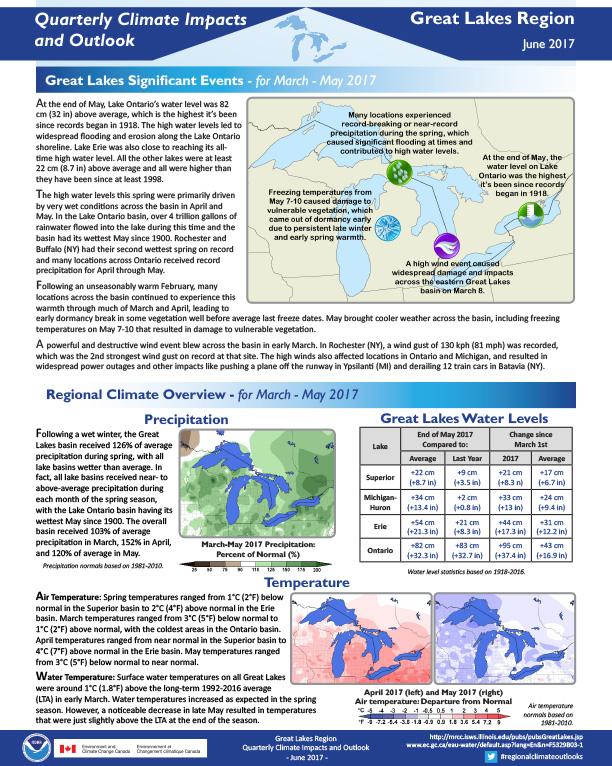
Quarterly Climate Impacts and Outlook for the Great Lakes Region for March – May 2017. Dated June 2017.
At the end of May, Lake Ontario’s water level was 82 cm (32 in) above average, which is the highest it’s been since records began in 1918. The high water levels led to widespread flooding and erosion along the Lake Ontario shoreline. Lake Erie was also close to reaching its all-time high water level. All the other lakes were at least 22 cm (8.7 in) above average and all were higher than they have been since at least 1998.
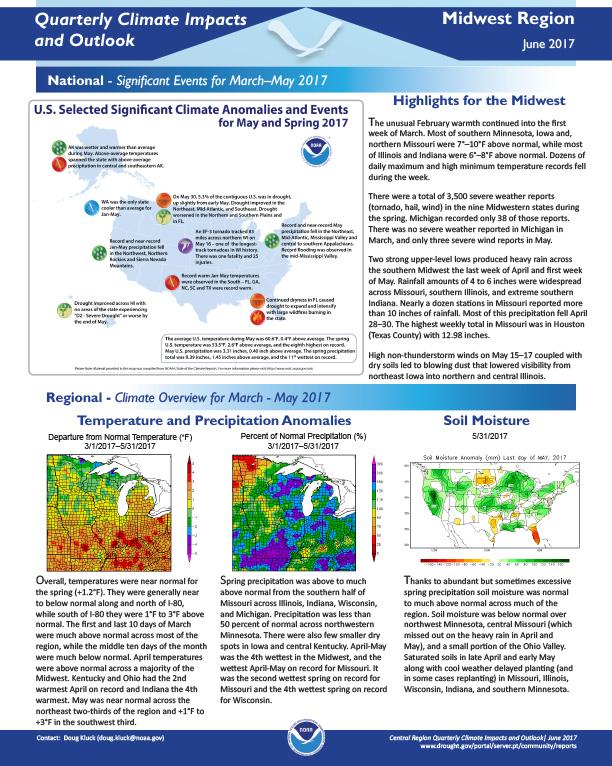
Quarterly Climate Impacts and Outlook for the Midwest Region for March – May 2017. Dated June 2017.
The unusual February warmth continued into the first week of March. Most of southern Minnesota, Iowa and, northern Missouri were 7°–10°F above normal, while most of Illinois and Indiana were 6°–8°F above normal. Dozens of daily maximum and high minimum temperature records fell during the week.


