GPM - IMERG: Drought Indices
NASA
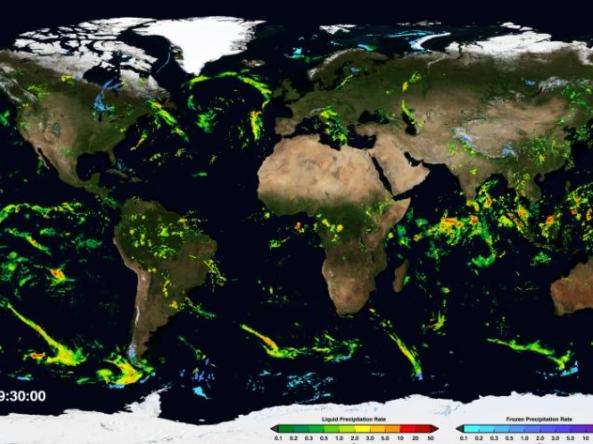
The NASA Integrated Multi-satellitE Retrievals for GPM (IMERG) algorithm combines information from the GPM satellite constellation to estimate precipitation over the majority of the Earth's surface. This algorithm is particularly valuable over the majority of the Earth's surface that lacks precipitation-measuring instruments on the ground. Now in the latest Version 06 release of IMERG the algorithm fuses the early precipitation estimates collected during the operation of the TRMM satellite (2000 - 2015) with more recent precipitation estimates collected during operation of the GPM satellite (2014 - present).
SPI
The Standardized Precipitation Index, or SPI, is a drought index that captures how observed precipitation deviates from the climatological average over a given time period. This global SPI is derived from the GPM-IMERG-LATE dataset, using the Climate Engine tool, and includes timescales of 1, 2, 3, 6, 9, and 12 months. The SPI calculation uses a climatology period of 2000-2026 and gamma distribution type.
The Standardized Precipitation Index, or SPI, is a drought index that captures how observed precipitation deviates from the climatological average over a given time period.
This map shows the Standardized Precipitation Index, or SPI, which compares the precipitation accumulation for the 30 days prior to the valid date to the distribution of accumulation totals for the same 30 day period between 2000 and 2026.
The Drought.gov team produces this SPI product with the Climate Engine tool and the NASA GPM-IMERG dataset, using a nonparametric distribution. The Integrated Multi-satellitE Retrievals (IMERG) algorithm for the Global Precipitation Mission (GPM) combines information from the GPM satellite constellation to estimate precipitation over the majority of the Earth's surface. This algorithm is particularly valuable over the majority of the Earth's surface that lacks precipitation-measuring instruments on the ground.
The Standardized Precipitation Index, or SPI, is a drought index that captures how observed precipitation deviates from the climatological average over a given time period.
This map shows the Standardized Precipitation Index, or SPI, which compares the precipitation accumulation for the 60 days prior to the valid date to the distribution of accumulation totals for the same 60 day period between 2000 and 2026.
The Drought.gov team produces this SPI product with the Climate Engine tool and the NASA GPM-IMERG dataset, using a nonparametric distribution. The Integrated Multi-satellitE Retrievals (IMERG) algorithm for the Global Precipitation Mission (GPM) combines information from the GPM satellite constellation to estimate precipitation over the majority of the Earth's surface. This algorithm is particularly valuable over the majority of the Earth's surface that lacks precipitation-measuring instruments on the ground.
The Standardized Precipitation Index, or SPI, is a drought index that captures how observed precipitation deviates from the climatological average over a given time period.
This map shows the Standardized Precipitation Index, or SPI, which compares the precipitation accumulation for the 90 days prior to the valid date to the distribution of accumulation totals for the same 90 day period between 2000 and 2026.
The Drought.gov team produces this SPI product with the Climate Engine tool and the NASA GPM-IMERG dataset, using a nonparametric distribution. The Integrated Multi-satellitE Retrievals (IMERG) algorithm for the Global Precipitation Mission (GPM) combines information from the GPM satellite constellation to estimate precipitation over the majority of the Earth's surface. This algorithm is particularly valuable over the majority of the Earth's surface that lacks precipitation-measuring instruments on the ground.
The Standardized Precipitation Index, or SPI, is a drought index that captures how observed precipitation deviates from the climatological average over a given time period.
This map shows the Standardized Precipitation Index, or SPI, which compares the precipitation accumulation for the 180 days prior to the valid date to the distribution of accumulation totals for the same 180 day period between 2000 and 2026.
The Drought.gov team produces this SPI product with the Climate Engine tool and the NASA GPM-IMERG dataset, using a nonparametric distribution. The Integrated Multi-satellitE Retrievals (IMERG) algorithm for the Global Precipitation Mission (GPM) combines information from the GPM satellite constellation to estimate precipitation over the majority of the Earth's surface. This algorithm is particularly valuable over the majority of the Earth's surface that lacks precipitation-measuring instruments on the ground.
The Standardized Precipitation Index, or SPI, is a drought index that captures how observed precipitation deviates from the climatological average over a given time period.
This map shows the Standardized Precipitation Index, or SPI, which compares the precipitation accumulation for the 270 days prior to the valid date to the distribution of accumulation totals for the same 270 day period between 2000 and 2026.
The Drought.gov team produces this SPI product with the Climate Engine tool and the NASA GPM-IMERG dataset, using a nonparametric distribution. The Integrated Multi-satellitE Retrievals (IMERG) algorithm for the Global Precipitation Mission (GPM) combines information from the GPM satellite constellation to estimate precipitation over the majority of the Earth's surface. This algorithm is particularly valuable over the majority of the Earth's surface that lacks precipitation-measuring instruments on the ground.
The Standardized Precipitation Index, or SPI, is a drought index that captures how observed precipitation deviates from the climatological average over a given time period.
This map shows the Standardized Precipitation Index, or SPI, which compares the precipitation accumulation for the 270 days prior to the valid date to the distribution of accumulation totals for the same 365 day period between 2000 and 2026.
The Drought.gov team produces this SPI product with the Climate Engine tool and the NASA GPM-IMERG dataset, using a nonparametric distribution. The Integrated Multi-satellitE Retrievals (IMERG) algorithm for the Global Precipitation Mission (GPM) combines information from the GPM satellite constellation to estimate precipitation over the majority of the Earth's surface. This algorithm is particularly valuable over the majority of the Earth's surface that lacks precipitation-measuring instruments on the ground.
Dry Conditions
D4 - Exceptional Drought (SPI of -2.0 or less)
The Standardized Precipitation Index (SPI) value for this location is -2.0 or less. SPI values can be interpreted as the number of standard deviations by which the precipitation anomaly deviates from the long-term mean. An SPI of -2.0 or less indicates Exceptional Drought (D4) conditions.
D3 - Extreme Drought (SPI of -1.9 to -1.6)
The Standardized Precipitation Index (SPI) value for this location is between -1.9 to -1.6. SPI values can be interpreted as the number of standard deviations by which the precipitation anomaly deviates from the long-term mean. An SPI of -1.9 to -1.6 indicates Extreme Drought (D3) conditions.
D2 - Severe Drought (SPI of -1.5 to -1.3)
The Standardized Precipitation Index (SPI) value for this location is between -1.5 to -1.3. SPI values can be interpreted as the number of standard deviations by which the precipitation anomaly deviates from the long-term mean. An SPI of -1.5 to -1.3 indicates Severe Drought (D2) conditions.
D1 - Moderate Drought (-1.2 to -0.8)
The Standardized Precipitation Index (SPI) value for this location is between -1.2 to -0.8. SPI values can be interpreted as the number of standard deviations by which the precipitation anomaly deviates from the long-term mean. An SPI of -1.2 to -0.8 indicates Moderate Drought (D1) conditions.
D0 - Abnormally Dry (SPI of -0.7 to -0.5)
The Standardized Precipitation Index (SPI) value for this location is between -0.7 to -0.5. SPI values can be interpreted as the number of standard deviations by which the precipitation anomaly deviates from the long-term mean. An SPI of -0.7 to -0.5 indicates Abnormally Dry (D0) conditions.
Wet Conditions
W0 (0.5 to 0.7)
The Standardized Precipitation Index (SPI) value for this location is between 0.5 to 0.7, indicating abnormally wet (W0) conditions.
W1 (0.8 to 1.2)
The Standardized Precipitation Index (SPI) value for this location is between 0.8 to 1.2, indicating moderate wet (W1) conditions.
W2 (1.3 to 1.5)
The Standardized Precipitation Index (SPI) value for this location is between 1.3 to 1.5, indicating severe wet (W2) conditions.
W3 (1.6 to 1.9)
The Standardized Precipitation Index (SPI) value for this location is between 1.6 to 1.9, indicating extreme wet (W3) conditions.
W4 (2.0 or more)
The Standardized Precipitation Index (SPI) value for this location is 2.0 or greater, indicating exceptional wet (W4) conditions.
Dry Conditions
D4 - Exceptional Drought (SPI of -2.0 or less)
The Standardized Precipitation Index (SPI) value for this location is -2.0 or less. SPI values can be interpreted as the number of standard deviations by which the precipitation anomaly deviates from the long-term mean. An SPI of -2.0 or less indicates Exceptional Drought (D4) conditions.
D3 - Extreme Drought (SPI of -1.9 to -1.6)
The Standardized Precipitation Index (SPI) value for this location is between -1.9 to -1.6. SPI values can be interpreted as the number of standard deviations by which the precipitation anomaly deviates from the long-term mean. An SPI of -1.9 to -1.6 indicates Extreme Drought (D3) conditions.
D2 - Severe Drought (SPI of -1.5 to -1.3)
The Standardized Precipitation Index (SPI) value for this location is between -1.5 to -1.3. SPI values can be interpreted as the number of standard deviations by which the precipitation anomaly deviates from the long-term mean. An SPI of -1.5 to -1.3 indicates Severe Drought (D2) conditions.
D1 - Moderate Drought (-1.2 to -0.8)
The Standardized Precipitation Index (SPI) value for this location is between -1.2 to -0.8. SPI values can be interpreted as the number of standard deviations by which the precipitation anomaly deviates from the long-term mean. An SPI of -1.2 to -0.8 indicates Moderate Drought (D1) conditions.
D0 - Abnormally Dry (SPI of -0.7 to -0.5)
The Standardized Precipitation Index (SPI) value for this location is between -0.7 to -0.5. SPI values can be interpreted as the number of standard deviations by which the precipitation anomaly deviates from the long-term mean. An SPI of -0.7 to -0.5 indicates Abnormally Dry (D0) conditions.
Wet Conditions
W0 (0.5 to 0.7)
The Standardized Precipitation Index (SPI) value for this location is between 0.5 to 0.7, indicating abnormally wet (W0) conditions.
W1 (0.8 to 1.2)
The Standardized Precipitation Index (SPI) value for this location is between 0.8 to 1.2, indicating moderate wet (W1) conditions.
W2 (1.3 to 1.5)
The Standardized Precipitation Index (SPI) value for this location is between 1.3 to 1.5, indicating severe wet (W2) conditions.
W3 (1.6 to 1.9)
The Standardized Precipitation Index (SPI) value for this location is between 1.6 to 1.9, indicating extreme wet (W3) conditions.
W4 (2.0 or more)
The Standardized Precipitation Index (SPI) value for this location is 2.0 or greater, indicating exceptional wet (W4) conditions.
Dry Conditions
D4 - Exceptional Drought (SPI of -2.0 or less)
The Standardized Precipitation Index (SPI) value for this location is -2.0 or less. SPI values can be interpreted as the number of standard deviations by which the precipitation anomaly deviates from the long-term mean. An SPI of -2.0 or less indicates Exceptional Drought (D4) conditions.
D3 - Extreme Drought (SPI of -1.9 to -1.6)
The Standardized Precipitation Index (SPI) value for this location is between -1.9 to -1.6. SPI values can be interpreted as the number of standard deviations by which the precipitation anomaly deviates from the long-term mean. An SPI of -1.9 to -1.6 indicates Extreme Drought (D3) conditions.
D2 - Severe Drought (SPI of -1.5 to -1.3)
The Standardized Precipitation Index (SPI) value for this location is between -1.5 to -1.3. SPI values can be interpreted as the number of standard deviations by which the precipitation anomaly deviates from the long-term mean. An SPI of -1.5 to -1.3 indicates Severe Drought (D2) conditions.
D1 - Moderate Drought (-1.2 to -0.8)
The Standardized Precipitation Index (SPI) value for this location is between -1.2 to -0.8. SPI values can be interpreted as the number of standard deviations by which the precipitation anomaly deviates from the long-term mean. An SPI of -1.2 to -0.8 indicates Moderate Drought (D1) conditions.
D0 - Abnormally Dry (SPI of -0.7 to -0.5)
The Standardized Precipitation Index (SPI) value for this location is between -0.7 to -0.5. SPI values can be interpreted as the number of standard deviations by which the precipitation anomaly deviates from the long-term mean. An SPI of -0.7 to -0.5 indicates Abnormally Dry (D0) conditions.
Wet Conditions
W0 (0.5 to 0.7)
The Standardized Precipitation Index (SPI) value for this location is between 0.5 to 0.7, indicating abnormally wet (W0) conditions.
W1 (0.8 to 1.2)
The Standardized Precipitation Index (SPI) value for this location is between 0.8 to 1.2, indicating moderate wet (W1) conditions.
W2 (1.3 to 1.5)
The Standardized Precipitation Index (SPI) value for this location is between 1.3 to 1.5, indicating severe wet (W2) conditions.
W3 (1.6 to 1.9)
The Standardized Precipitation Index (SPI) value for this location is between 1.6 to 1.9, indicating extreme wet (W3) conditions.
W4 (2.0 or more)
The Standardized Precipitation Index (SPI) value for this location is 2.0 or greater, indicating exceptional wet (W4) conditions.
Dry Conditions
D4 - Exceptional Drought (SPI of -2.0 or less)
The Standardized Precipitation Index (SPI) value for this location is -2.0 or less. SPI values can be interpreted as the number of standard deviations by which the precipitation anomaly deviates from the long-term mean. An SPI of -2.0 or less indicates Exceptional Drought (D4) conditions.
D3 - Extreme Drought (SPI of -1.9 to -1.6)
The Standardized Precipitation Index (SPI) value for this location is between -1.9 to -1.6. SPI values can be interpreted as the number of standard deviations by which the precipitation anomaly deviates from the long-term mean. An SPI of -1.9 to -1.6 indicates Extreme Drought (D3) conditions.
D2 - Severe Drought (SPI of -1.5 to -1.3)
The Standardized Precipitation Index (SPI) value for this location is between -1.5 to -1.3. SPI values can be interpreted as the number of standard deviations by which the precipitation anomaly deviates from the long-term mean. An SPI of -1.5 to -1.3 indicates Severe Drought (D2) conditions.
D1 - Moderate Drought (-1.2 to -0.8)
The Standardized Precipitation Index (SPI) value for this location is between -1.2 to -0.8. SPI values can be interpreted as the number of standard deviations by which the precipitation anomaly deviates from the long-term mean. An SPI of -1.2 to -0.8 indicates Moderate Drought (D1) conditions.
D0 - Abnormally Dry (SPI of -0.7 to -0.5)
The Standardized Precipitation Index (SPI) value for this location is between -0.7 to -0.5. SPI values can be interpreted as the number of standard deviations by which the precipitation anomaly deviates from the long-term mean. An SPI of -0.7 to -0.5 indicates Abnormally Dry (D0) conditions.
Wet Conditions
W0 (0.5 to 0.7)
The Standardized Precipitation Index (SPI) value for this location is between 0.5 to 0.7, indicating abnormally wet (W0) conditions.
W1 (0.8 to 1.2)
The Standardized Precipitation Index (SPI) value for this location is between 0.8 to 1.2, indicating moderate wet (W1) conditions.
W2 (1.3 to 1.5)
The Standardized Precipitation Index (SPI) value for this location is between 1.3 to 1.5, indicating severe wet (W2) conditions.
W3 (1.6 to 1.9)
The Standardized Precipitation Index (SPI) value for this location is between 1.6 to 1.9, indicating extreme wet (W3) conditions.
W4 (2.0 or more)
The Standardized Precipitation Index (SPI) value for this location is 2.0 or greater, indicating exceptional wet (W4) conditions.
Dry Conditions
D4 - Exceptional Drought (SPI of -2.0 or less)
The Standardized Precipitation Index (SPI) value for this location is -2.0 or less. SPI values can be interpreted as the number of standard deviations by which the precipitation anomaly deviates from the long-term mean. An SPI of -2.0 or less indicates Exceptional Drought (D4) conditions.
D3 - Extreme Drought (SPI of -1.9 to -1.6)
The Standardized Precipitation Index (SPI) value for this location is between -1.9 to -1.6. SPI values can be interpreted as the number of standard deviations by which the precipitation anomaly deviates from the long-term mean. An SPI of -1.9 to -1.6 indicates Extreme Drought (D3) conditions.
D2 - Severe Drought (SPI of -1.5 to -1.3)
The Standardized Precipitation Index (SPI) value for this location is between -1.5 to -1.3. SPI values can be interpreted as the number of standard deviations by which the precipitation anomaly deviates from the long-term mean. An SPI of -1.5 to -1.3 indicates Severe Drought (D2) conditions.
D1 - Moderate Drought (-1.2 to -0.8)
The Standardized Precipitation Index (SPI) value for this location is between -1.2 to -0.8. SPI values can be interpreted as the number of standard deviations by which the precipitation anomaly deviates from the long-term mean. An SPI of -1.2 to -0.8 indicates Moderate Drought (D1) conditions.
D0 - Abnormally Dry (SPI of -0.7 to -0.5)
The Standardized Precipitation Index (SPI) value for this location is between -0.7 to -0.5. SPI values can be interpreted as the number of standard deviations by which the precipitation anomaly deviates from the long-term mean. An SPI of -0.7 to -0.5 indicates Abnormally Dry (D0) conditions.
Wet Conditions
W0 (0.5 to 0.7)
The Standardized Precipitation Index (SPI) value for this location is between 0.5 to 0.7, indicating abnormally wet (W0) conditions.
W1 (0.8 to 1.2)
The Standardized Precipitation Index (SPI) value for this location is between 0.8 to 1.2, indicating moderate wet (W1) conditions.
W2 (1.3 to 1.5)
The Standardized Precipitation Index (SPI) value for this location is between 1.3 to 1.5, indicating severe wet (W2) conditions.
W3 (1.6 to 1.9)
The Standardized Precipitation Index (SPI) value for this location is between 1.6 to 1.9, indicating extreme wet (W3) conditions.
W4 (2.0 or more)
The Standardized Precipitation Index (SPI) value for this location is 2.0 or greater, indicating exceptional wet (W4) conditions.
Dry Conditions
D4 - Exceptional Drought (SPI of -2.0 or less)
The Standardized Precipitation Index (SPI) value for this location is -2.0 or less. SPI values can be interpreted as the number of standard deviations by which the precipitation anomaly deviates from the long-term mean. An SPI of -2.0 or less indicates Exceptional Drought (D4) conditions.
D3 - Extreme Drought (SPI of -1.9 to -1.6)
The Standardized Precipitation Index (SPI) value for this location is between -1.9 to -1.6. SPI values can be interpreted as the number of standard deviations by which the precipitation anomaly deviates from the long-term mean. An SPI of -1.9 to -1.6 indicates Extreme Drought (D3) conditions.
D2 - Severe Drought (SPI of -1.5 to -1.3)
The Standardized Precipitation Index (SPI) value for this location is between -1.5 to -1.3. SPI values can be interpreted as the number of standard deviations by which the precipitation anomaly deviates from the long-term mean. An SPI of -1.5 to -1.3 indicates Severe Drought (D2) conditions.
D1 - Moderate Drought (-1.2 to -0.8)
The Standardized Precipitation Index (SPI) value for this location is between -1.2 to -0.8. SPI values can be interpreted as the number of standard deviations by which the precipitation anomaly deviates from the long-term mean. An SPI of -1.2 to -0.8 indicates Moderate Drought (D1) conditions.
D0 - Abnormally Dry (SPI of -0.7 to -0.5)
The Standardized Precipitation Index (SPI) value for this location is between -0.7 to -0.5. SPI values can be interpreted as the number of standard deviations by which the precipitation anomaly deviates from the long-term mean. An SPI of -0.7 to -0.5 indicates Abnormally Dry (D0) conditions.
Wet Conditions
W0 (0.5 to 0.7)
The Standardized Precipitation Index (SPI) value for this location is between 0.5 to 0.7, indicating abnormally wet (W0) conditions.
W1 (0.8 to 1.2)
The Standardized Precipitation Index (SPI) value for this location is between 0.8 to 1.2, indicating moderate wet (W1) conditions.
W2 (1.3 to 1.5)
The Standardized Precipitation Index (SPI) value for this location is between 1.3 to 1.5, indicating severe wet (W2) conditions.
W3 (1.6 to 1.9)
The Standardized Precipitation Index (SPI) value for this location is between 1.6 to 1.9, indicating extreme wet (W3) conditions.
W4 (2.0 or more)
The Standardized Precipitation Index (SPI) value for this location is 2.0 or greater, indicating exceptional wet (W4) conditions.
The Standardized Precipitation Index, or SPI, is a drought index that captures how observed precipitation deviates from the climatological average over a given time period.
This map shows the Standardized Precipitation Index, or SPI, which compares the precipitation accumulation for the 30 days prior to the valid date to the distribution of accumulation totals for the same 30 day period between 2000 and 2026.
The Drought.gov team produces this SPI product with the Climate Engine tool and the NASA GPM-IMERG dataset, using a nonparametric distribution. The Integrated Multi-satellitE Retrievals (IMERG) algorithm for the Global Precipitation Mission (GPM) combines information from the GPM satellite constellation to estimate precipitation over the majority of the Earth's surface. This algorithm is particularly valuable over the majority of the Earth's surface that lacks precipitation-measuring instruments on the ground.
The Standardized Precipitation Index, or SPI, is a drought index that captures how observed precipitation deviates from the climatological average over a given time period.
This map shows the Standardized Precipitation Index, or SPI, which compares the precipitation accumulation for the 60 days prior to the valid date to the distribution of accumulation totals for the same 60 day period between 2000 and 2026.
The Drought.gov team produces this SPI product with the Climate Engine tool and the NASA GPM-IMERG dataset, using a nonparametric distribution. The Integrated Multi-satellitE Retrievals (IMERG) algorithm for the Global Precipitation Mission (GPM) combines information from the GPM satellite constellation to estimate precipitation over the majority of the Earth's surface. This algorithm is particularly valuable over the majority of the Earth's surface that lacks precipitation-measuring instruments on the ground.
The Standardized Precipitation Index, or SPI, is a drought index that captures how observed precipitation deviates from the climatological average over a given time period.
This map shows the Standardized Precipitation Index, or SPI, which compares the precipitation accumulation for the 90 days prior to the valid date to the distribution of accumulation totals for the same 90 day period between 2000 and 2026.
The Drought.gov team produces this SPI product with the Climate Engine tool and the NASA GPM-IMERG dataset, using a nonparametric distribution. The Integrated Multi-satellitE Retrievals (IMERG) algorithm for the Global Precipitation Mission (GPM) combines information from the GPM satellite constellation to estimate precipitation over the majority of the Earth's surface. This algorithm is particularly valuable over the majority of the Earth's surface that lacks precipitation-measuring instruments on the ground.
The Standardized Precipitation Index, or SPI, is a drought index that captures how observed precipitation deviates from the climatological average over a given time period.
This map shows the Standardized Precipitation Index, or SPI, which compares the precipitation accumulation for the 180 days prior to the valid date to the distribution of accumulation totals for the same 180 day period between 2000 and 2026.
The Drought.gov team produces this SPI product with the Climate Engine tool and the NASA GPM-IMERG dataset, using a nonparametric distribution. The Integrated Multi-satellitE Retrievals (IMERG) algorithm for the Global Precipitation Mission (GPM) combines information from the GPM satellite constellation to estimate precipitation over the majority of the Earth's surface. This algorithm is particularly valuable over the majority of the Earth's surface that lacks precipitation-measuring instruments on the ground.
The Standardized Precipitation Index, or SPI, is a drought index that captures how observed precipitation deviates from the climatological average over a given time period.
This map shows the Standardized Precipitation Index, or SPI, which compares the precipitation accumulation for the 270 days prior to the valid date to the distribution of accumulation totals for the same 270 day period between 2000 and 2026.
The Drought.gov team produces this SPI product with the Climate Engine tool and the NASA GPM-IMERG dataset, using a nonparametric distribution. The Integrated Multi-satellitE Retrievals (IMERG) algorithm for the Global Precipitation Mission (GPM) combines information from the GPM satellite constellation to estimate precipitation over the majority of the Earth's surface. This algorithm is particularly valuable over the majority of the Earth's surface that lacks precipitation-measuring instruments on the ground.
The Standardized Precipitation Index, or SPI, is a drought index that captures how observed precipitation deviates from the climatological average over a given time period.
This map shows the Standardized Precipitation Index, or SPI, which compares the precipitation accumulation for the 270 days prior to the valid date to the distribution of accumulation totals for the same 365 day period between 2000 and 2026.
The Drought.gov team produces this SPI product with the Climate Engine tool and the NASA GPM-IMERG dataset, using a nonparametric distribution. The Integrated Multi-satellitE Retrievals (IMERG) algorithm for the Global Precipitation Mission (GPM) combines information from the GPM satellite constellation to estimate precipitation over the majority of the Earth's surface. This algorithm is particularly valuable over the majority of the Earth's surface that lacks precipitation-measuring instruments on the ground.
Access
Data processed via Climate Engine available for download from NOAA/NIDIS