U.S. flag

An official website of the United States government

The U.S. government is closed. This site will not be updated; however, NOAA websites and social media channels necessary to protect lives and property will be maintained. To learn more, visit commerce.gov.

For the latest forecasts and critical weather information, visit weather.gov.
DATA & MAPS

Select categories to browse data

Looking to Download Data? The Drought.gov team reformats data from multiple partners into web- and GIS-ready formats, which we use throughout Drought.gov. These data are free for all to download.
Search Results(189)

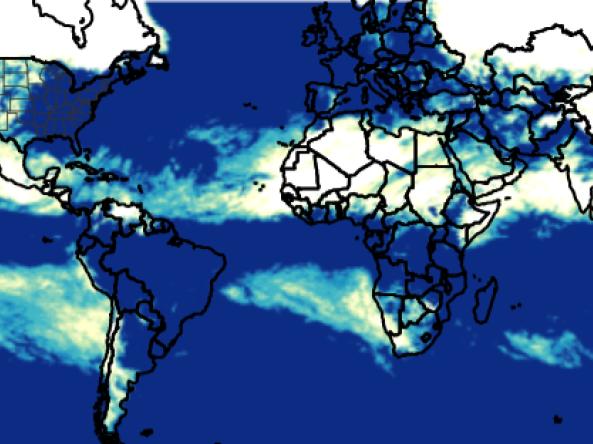
The Global Gridded Standardized Precipitation Index (SPI) is derived from the CMORPH daily dataset and includes timescales of 1, 3, 6 and 9 months.  The NOAA CMORPH precipitation dataset is a gridded dataset derived from combining numerous microwave-based estimates from low orbiter satellites. 

The Global Gridded Standardized Precipitation Index (SPI) is derived from the CMORPH daily dataset and includes timescales of 1, 3, 6 and 9 months.  The NOAA CMORPH precipitation dataset is a gridded dataset derived from combining numerous microwave-based estimates from low orbiter satellites. 

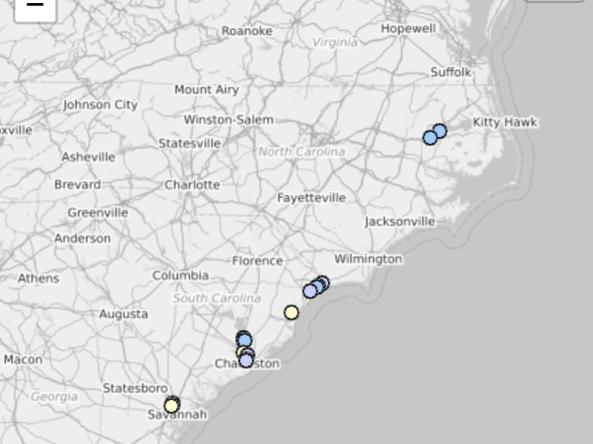
The CSI is a drought index tool that uses salinity data to characterize saline (drought) and freshwater (wet) conditions in coastal surface waters.

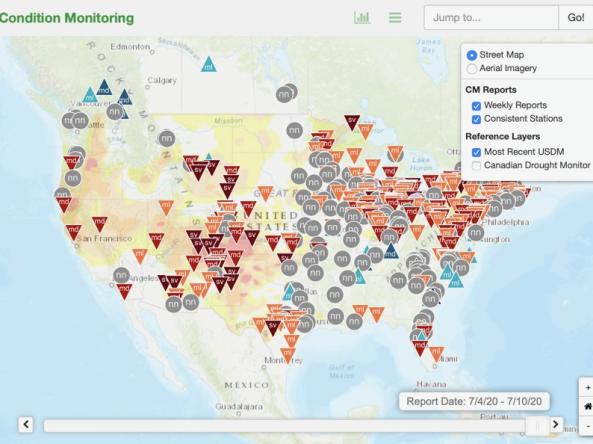
This condition monitoring map is a tool intended to depict local, community-level conditions and how recent weather and climate events have affected those communities.