U.S. flag

An official website of the United States government

The U.S. government is closed. This site will not be updated; however, NOAA websites and social media channels necessary to protect lives and property will be maintained. To learn more, visit commerce.gov.

For the latest forecasts and critical weather information, visit weather.gov.
DATA & MAPS

Select categories to browse data

Looking to Download Data? The Drought.gov team reformats data from multiple partners into web- and GIS-ready formats, which we use throughout Drought.gov. These data are free for all to download.
Search Results(189)

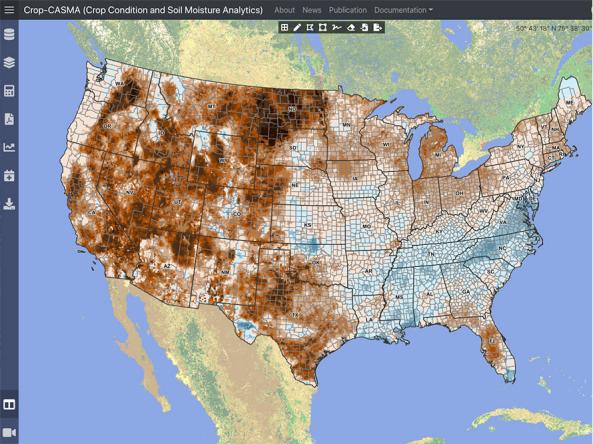
Crop-CASMA  is a web-based geospatial application that provides access to high-resolution data from NASA SMAP and MODIS missions to map soil moisture and crop vegetation conditions across the United States. 

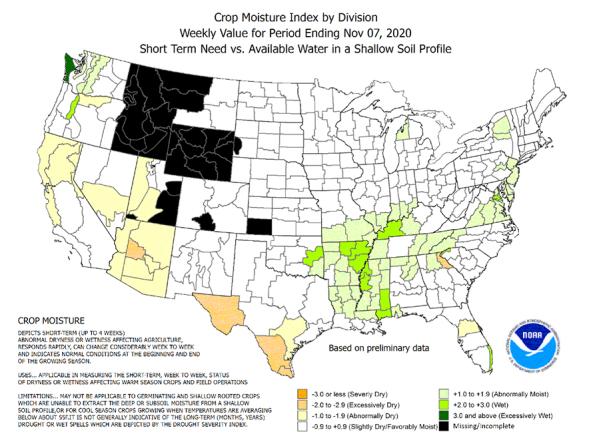
The CMI is an index of the relative dryness or wetness affecting water sensitive economies. It provides the short-term or current status of purely agricultural drought or moisture surplus.

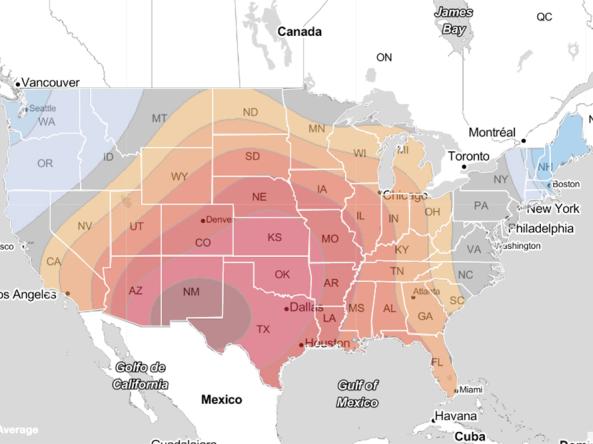
UC San Diego Scripps Institute of Oceanography Center for Western Weather and Water Extremes (CW3E) provides observation and forecast datasets, including integrated water transport, integrated water vapor, precipitation, snow, temperature, winds and height, isotherm, meteograms, and virtual RASS.

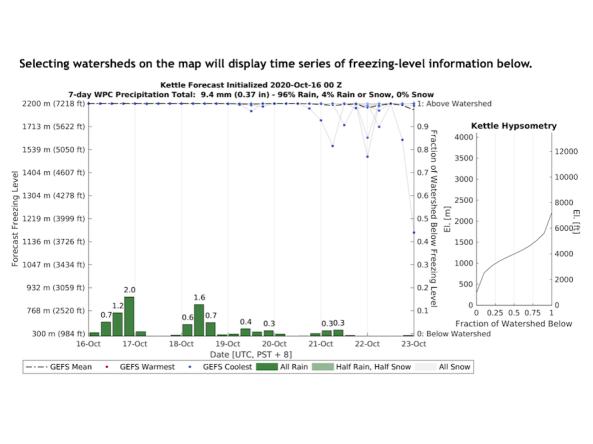
The Center for Western Weather and Water Extremes (CW3E) uses Global Ensemble Forecast System forecasts to show the evolution of the freezing level above, within, or below a watershed's terrain (that is, forecast near-surface temperatures being above or below freezing, and precipitation falling as rain or snow).