Quarterly Climate Impacts and Outlook for the Great Lakes Region for June – August 2020. Dated September 2020.
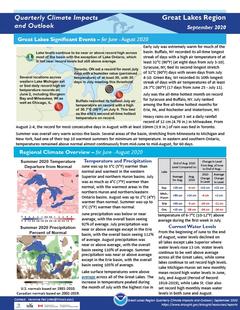
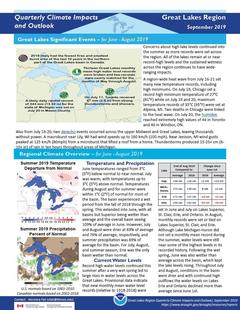
Summer was overall very warm across the basin. Several areas of the basin, stretching from Minnesota to Michigan and New York, had one of their top 10 warmest summers for minimum air temperature. In eastern and southern Ontario, temperatures remained above normal almost continuously from mid-June to mid-August. Summer precipitation was near or above average except in the Erie basin, with the overall basin seeing 105% of average.
Quarterly Climate Impacts and Outlook for the Great Lakes Region for March – May 2020. Dated June 2020.
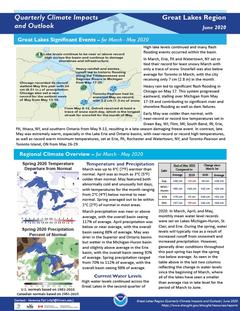
Spring temperatures averaged out to be within 1°C (2°F) of normal in most areas. Spring precipitation ranged from 70% to 112% of average, with the overall basin seeing 98% of average.
Quarterly Climate Impacts and Outlook for the Great Lakes Region for December 2019 – February 2020. Dated March 2020.
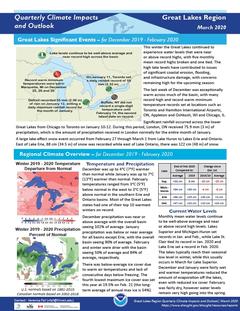
Most of the Great Lakes states had one of their top 10 warmest winters on record. Winter was drier with the basin seeing 84% of average. There was below average ice cover due to warm air temperatures and lack of consecutive days below freezing.
Quarterly Climate Impacts and Outlook for the Great Lakes Region for September – November 2019. Dated December 2019.
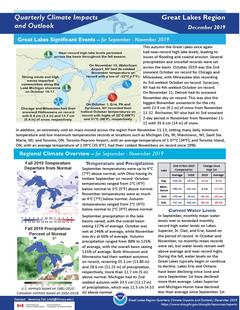
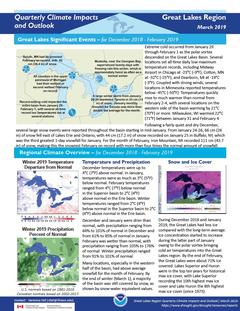
Autumn temperatures ranged from 2°C (4°F) below normal to 2°C (4°F) above normal. Autumn precipitation ranged from 88% to 125% of average, with the overall basin seeing 115% of average.
Quarterly Climate Impacts and Outlook for the Great Lakes Region for June – August 2019. Dated September 2019.
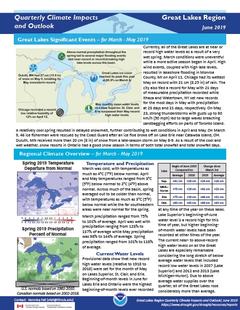
June temperatures ranged from 3°C (5°F) below normal to near normal. July was warm, with temperatures up to 3°C (5°F) above normal. Temperatures during August and for summer were within 1°C (2°F) of normal for most of the basin. The basin experienced a wet period from the fall of 2018 through the spring. This extended into June, with all basins but Superior being wetter than average and the overall basin seeing 109% of average in June.
Quarterly Climate Impacts and Outlook for the Great Lakes Region for March – May 2019. Dated June 2019.
Across much of the basin, spring averaged out to be colder than normal, with temperatures as much as 3°C (5°F) below normal while the far southeastern areas were near normal for the spring. Spring precipitation ranged from 101% to 118% of average.
Quarterly Climate Impacts and Outlook for the Great Lakes Region for December 2018 – February 2019. Dated March 2019.
Winter temperatures ranged from 2°C (4°F) below normal in the Superior basin to 2°C (4°F) above normal in the Erie basin. Winter precipitation ranged from 91% to 101% of normal.
Quarterly Climate Impacts and Outlook for the Great Lakes Region for September – November 2018. Dated December 2018.
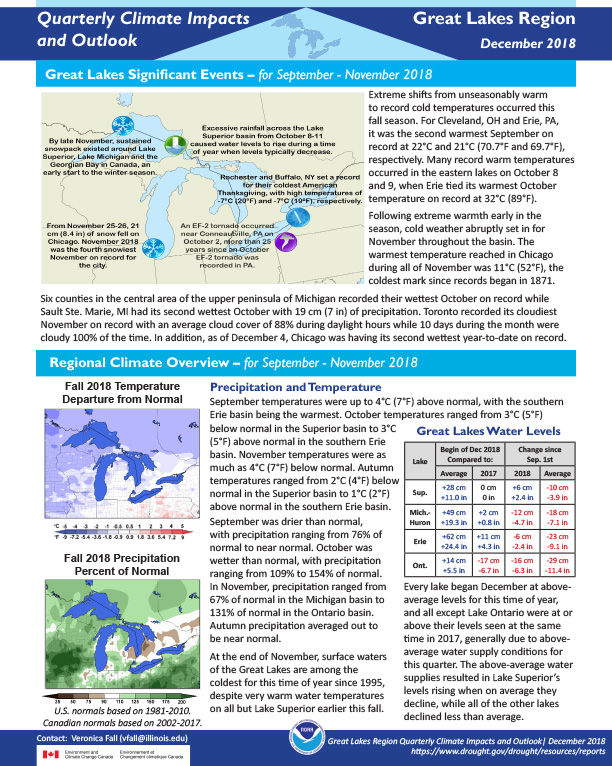
Extreme shifts from unseasonably warm to record cold temperatures occurred this fall season. Autumn precipitation averaged out to be near normal.
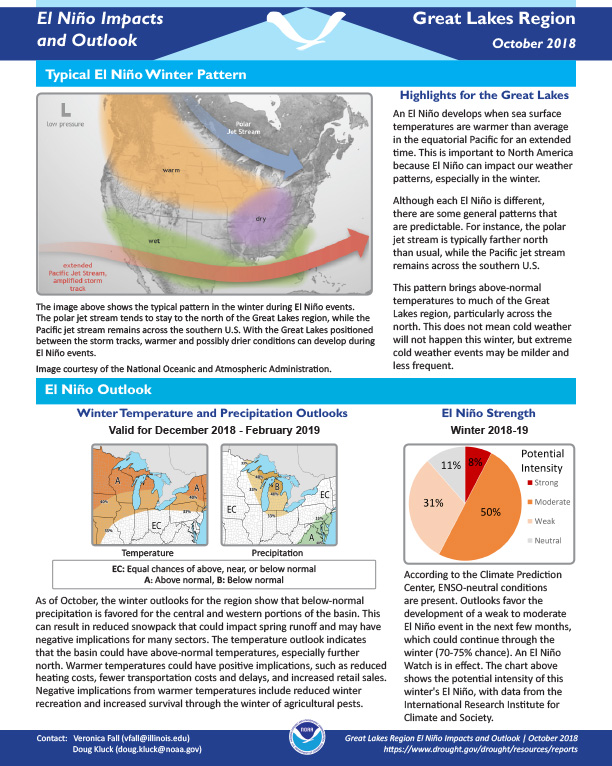
Provides a definition of El Nino; the outlook for winter temperatures and precipitation; potential winter and spring impacts; and a look back at previous El Nino winters.
NOAA’s Regional Climate Services Program created these Outlooks to inform the public about climate impacts within their respective regions. Each regional report contains easy-to-understand language, and anyone can access them through the Drought Portal at https://www.drought.gov/drought/resources/reports.
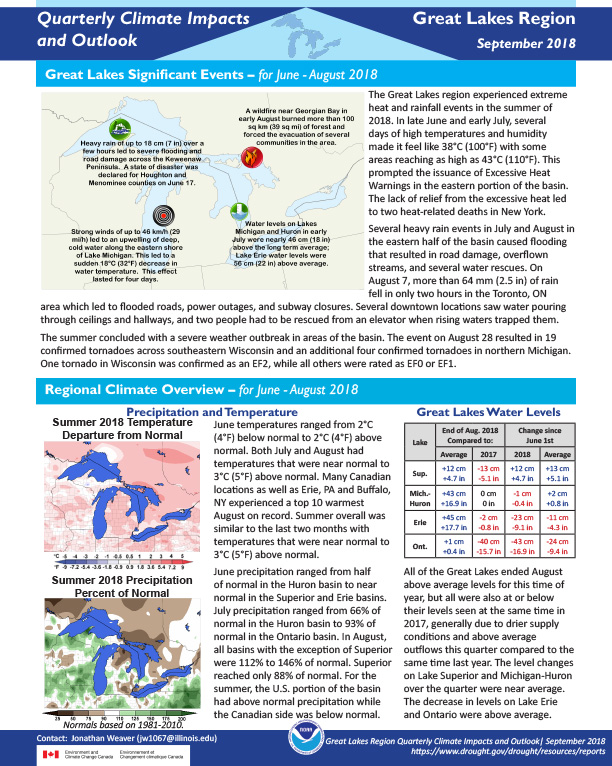
Quarterly Climate Impacts and Outlook for the Great Lakes Region for June – August 2018. Dated September 2018.