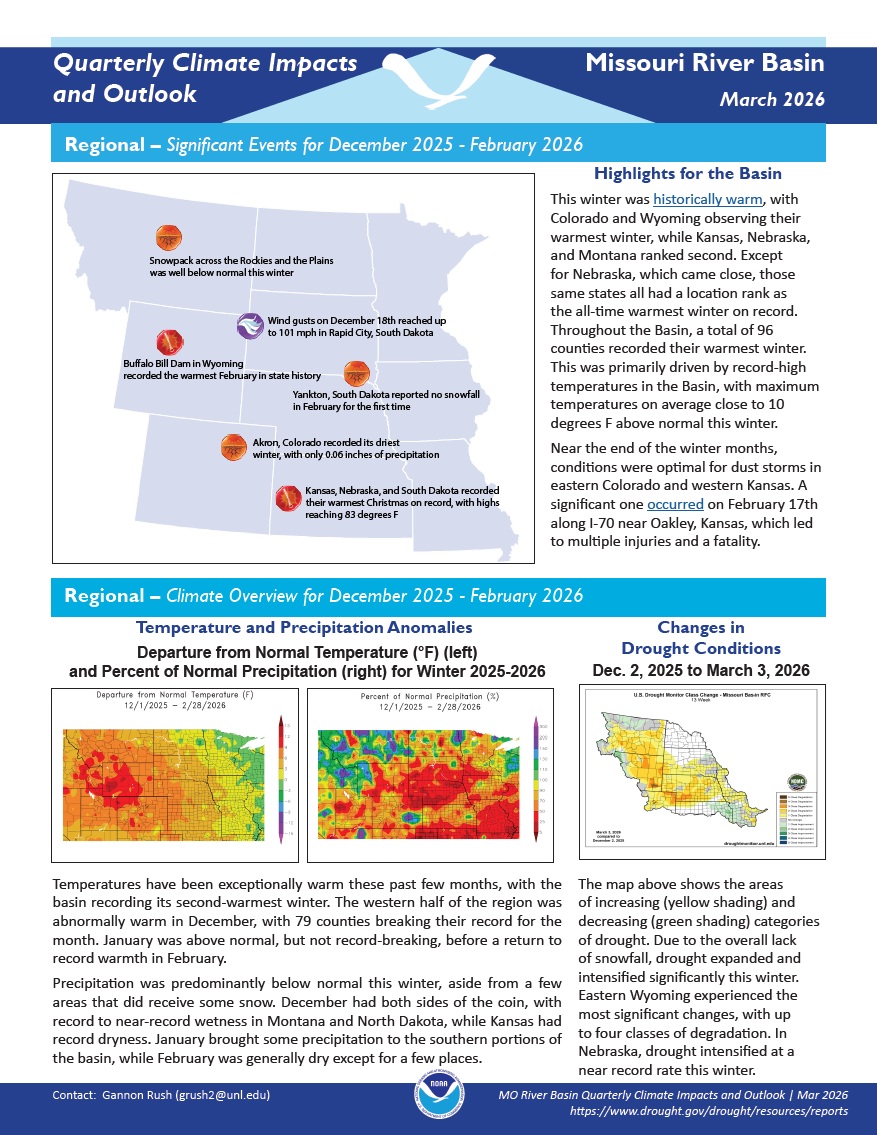
Quarterly Climate Impacts and Outlook for the Missouri River Basin for December 2025–February 2026. Dated March 2026.
Temperatures have been exceptionally warm these past few months, with the basin recording its second-warmest winter. Precipitation was predominantly below normal this winter, aside from a few areas that did receive some snow.
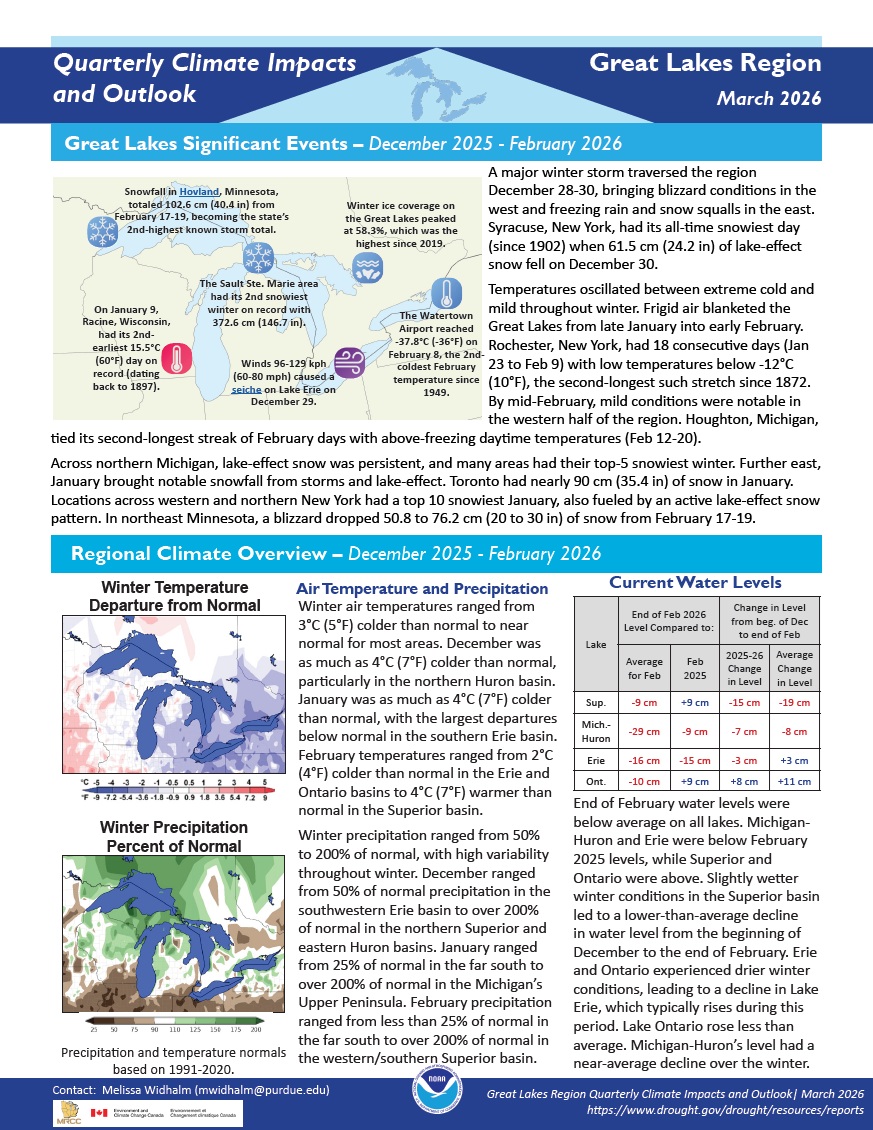
Quarterly Climate Impacts and Outlook for the Great Lakes Region for December 2025–February 2026. Dated March 2026.
Winter air temperatures ranged from 3 °C (5 °F) colder than normal to near normal for most areas. Winter precipitation ranged from 50% to 200% of normal, with high variability throughout winter.
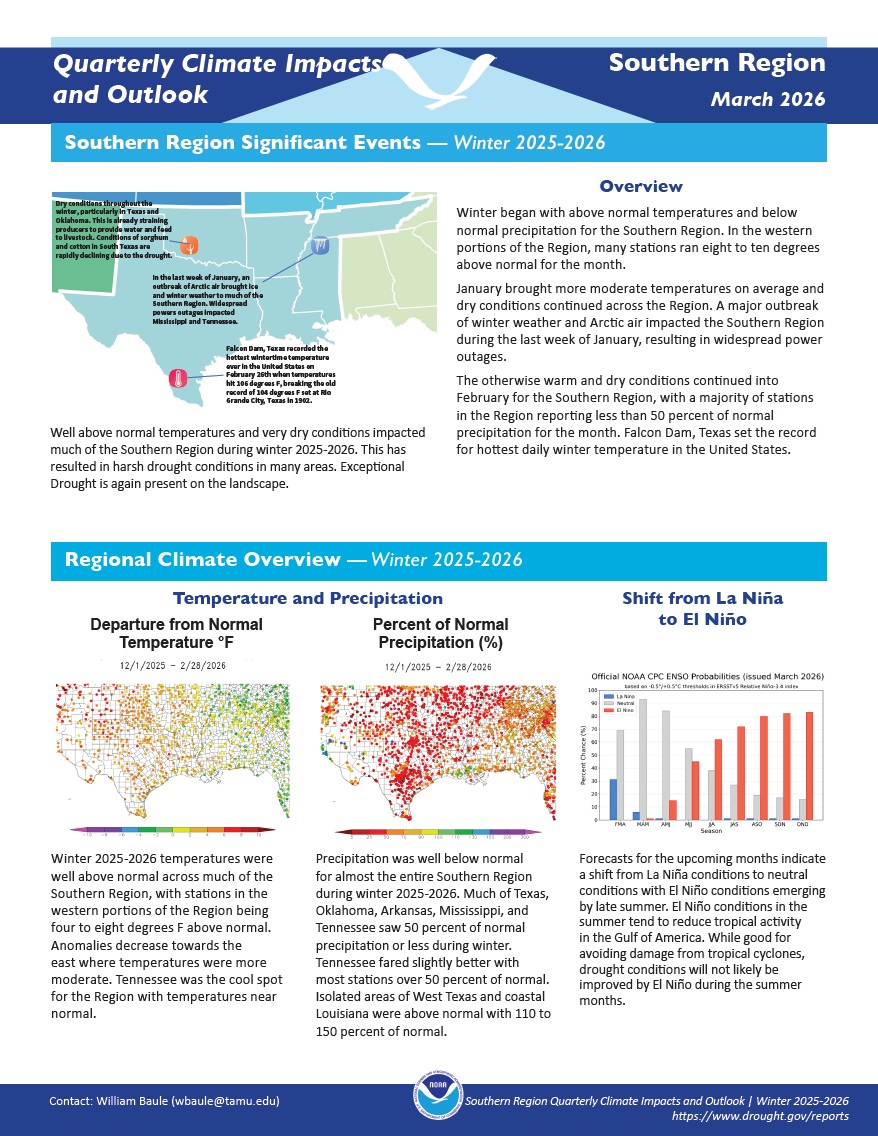
Quarterly Climate Impacts and Outlook for the Southern Region for December 2025–February 2026. Dated March 2026.
Winter temperatures were well above normal across much of the Southern Region, with stations in the western portions of the Region being four to 8 °F above normal. Anomalies decrease towards the east where temperatures were more moderate. Precipitation was well below normal for almost the entire Southern Region.
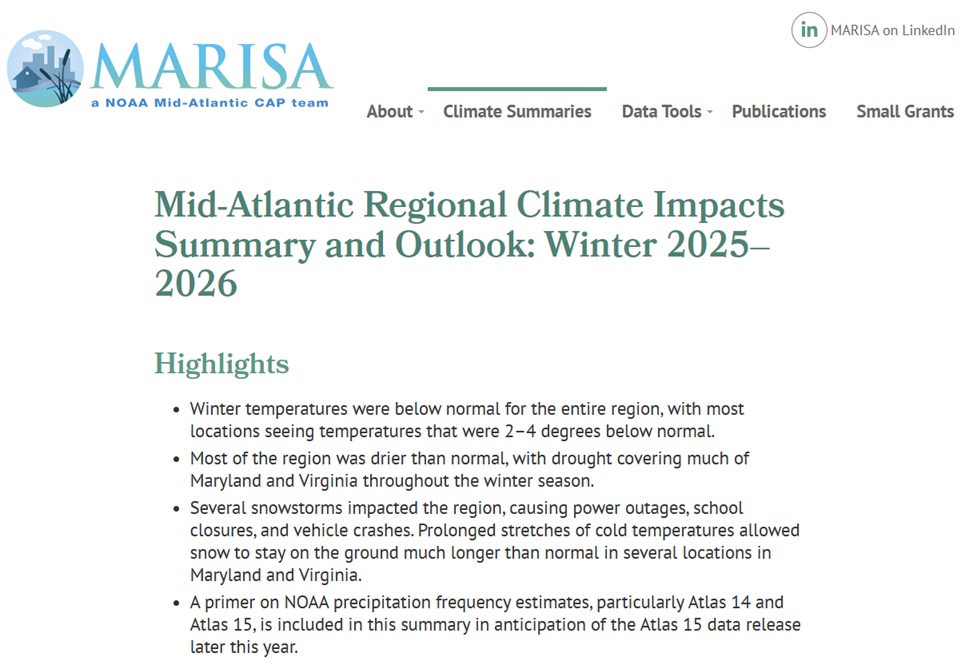
Quarterly Climate Impacts and Outlook for the Mid-Atlantic Region for December 2025–February 2026. Dated March 2026.
Winter temperatures were below normal for the entire region, with most locations seeing temperatures that were 2–4 degrees below normal. Most of the region was drier than normal, with drought covering much of Maryland and Virginia throughout the winter season.
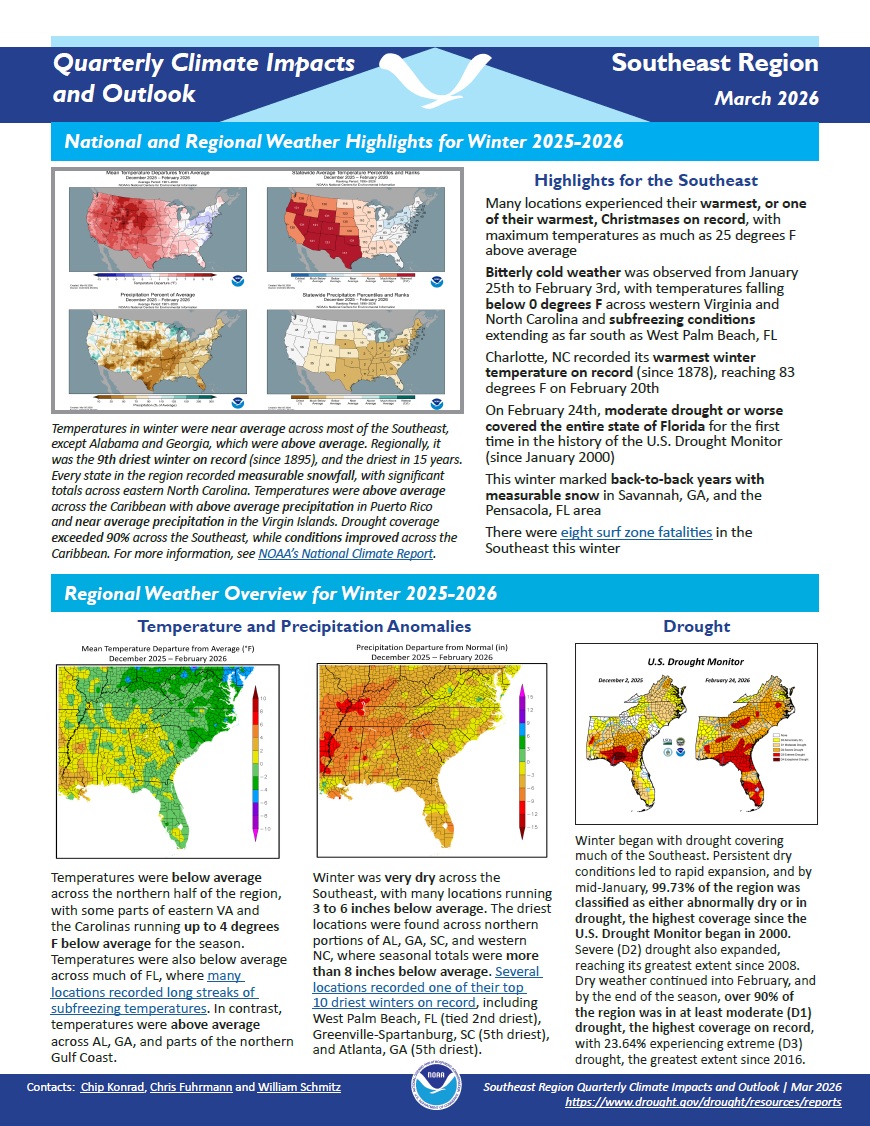
Quarterly Climate Impacts and Outlook for the Southeast and Caribbean Region for December 2025–February 2026. Dated March 2026. (Updated to add Spanish translation of Caribbean information.)
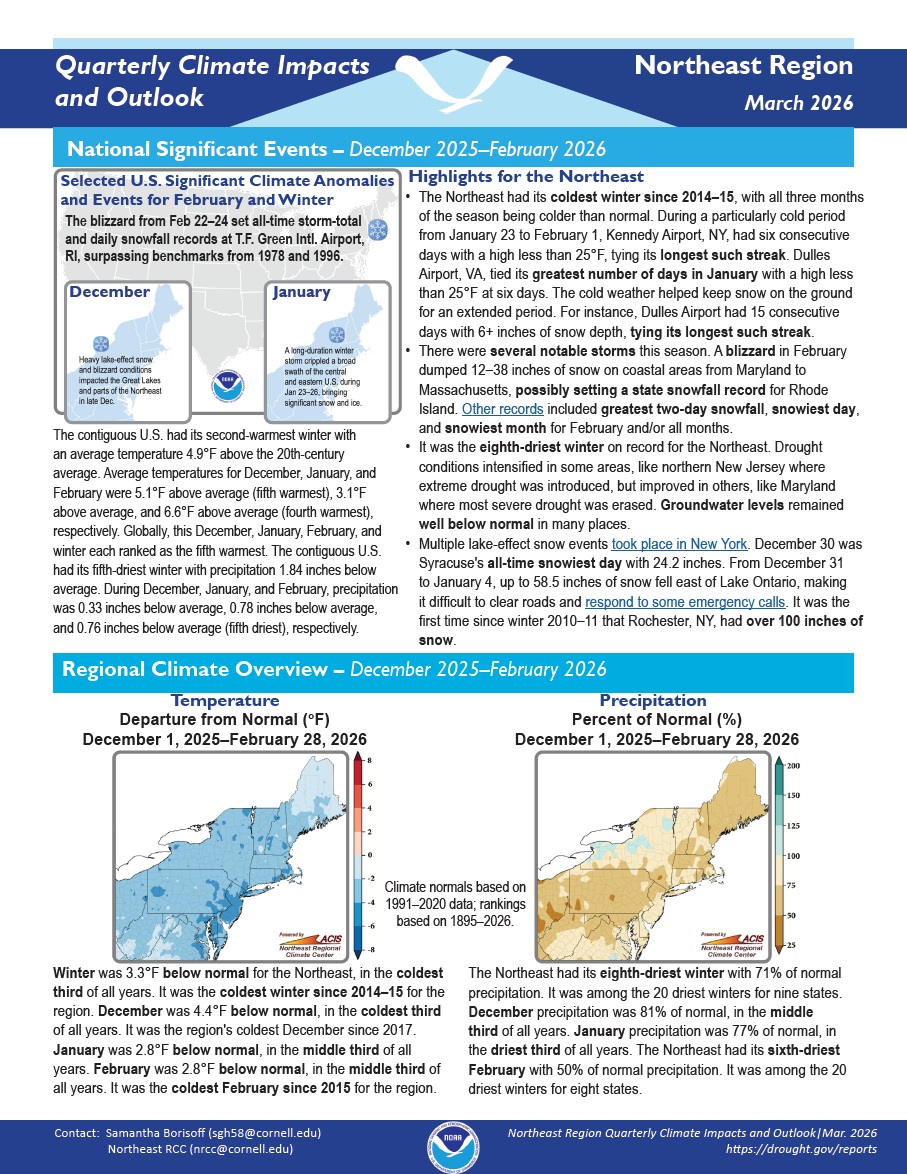
Quarterly Climate Impacts and Outlook for the Northeast Region for December 2025–February 2026. Dated March 2026.
Winter was 3.3°F below normal for the Northeast, in the coldest third of all years. It was the coldest winter since 2014–15 for the region. The Northeast had its eighth-driest winter with 71% of normal precipitation. It was among the 20 driest winters for nine states.
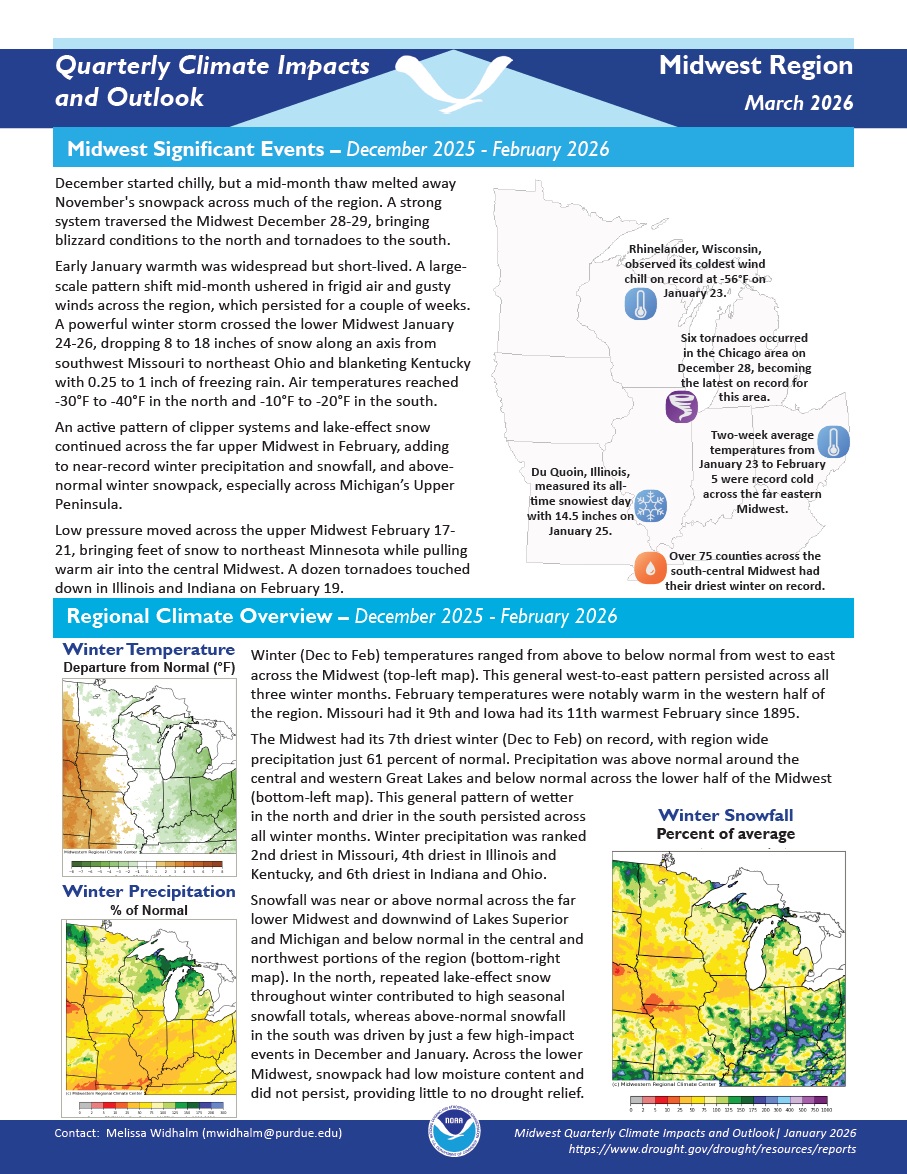
Quarterly Climate Impacts and Outlook for the Midwest Region for December 2025–February 2026. Dated March 2026.
Winter temperatures ranged from above to below normal from west to east across the Midwest. This general west-to-east pattern persisted across all three winter months. The Midwest had its 7th driest winter (December to February) on record, with region wide precipitation just 61% of normal.
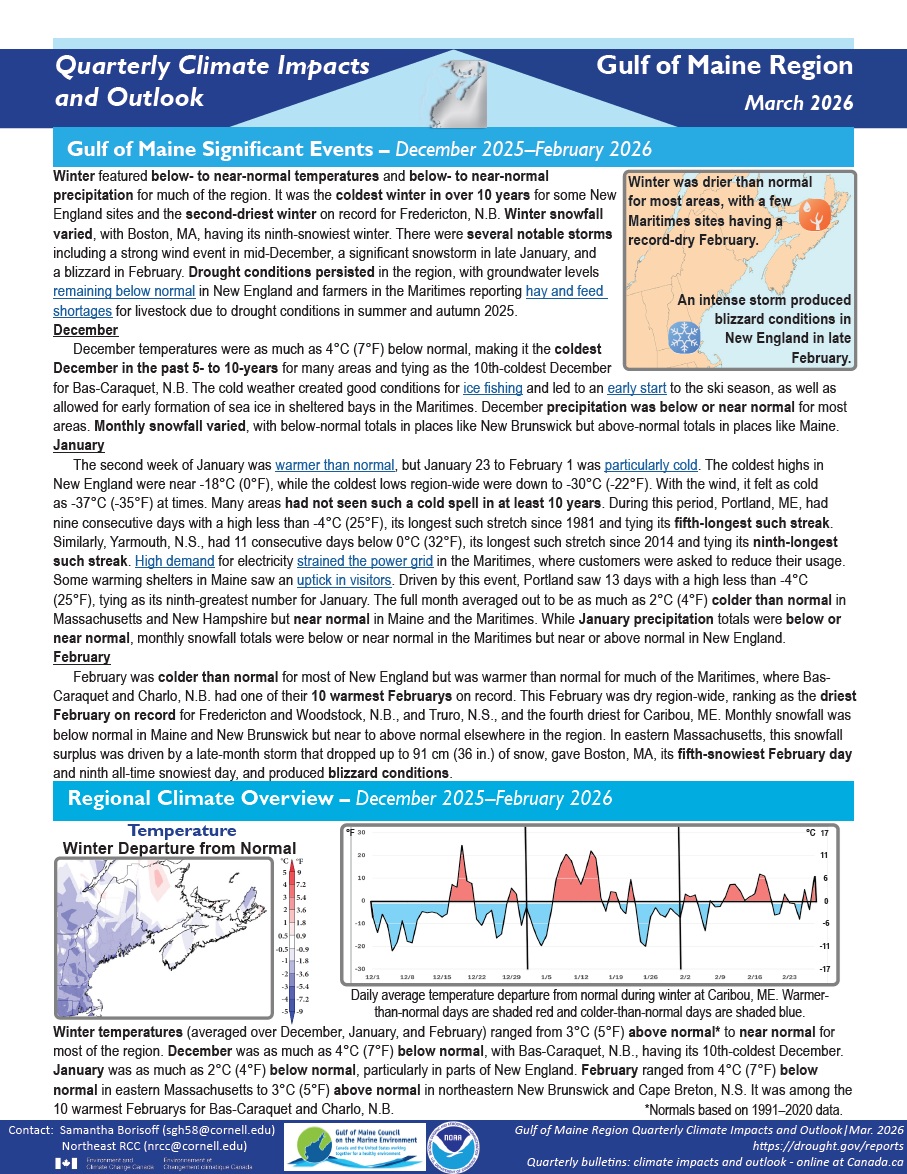
Quarterly Climate Impacts and Outlook for the Gulf of Maine Region for December 2025–February 2026. Dated March 2026.
Winter featured below- to near-normal temperatures and below- to near-normal precipitation for much of the region. It was the coldest winter in over 10 years for some New England sites and the second-driest winter on record for Fredericton, N.B. Winter snowfall varied, with Boston, Massachusetts, having its ninth-snowiest winter.
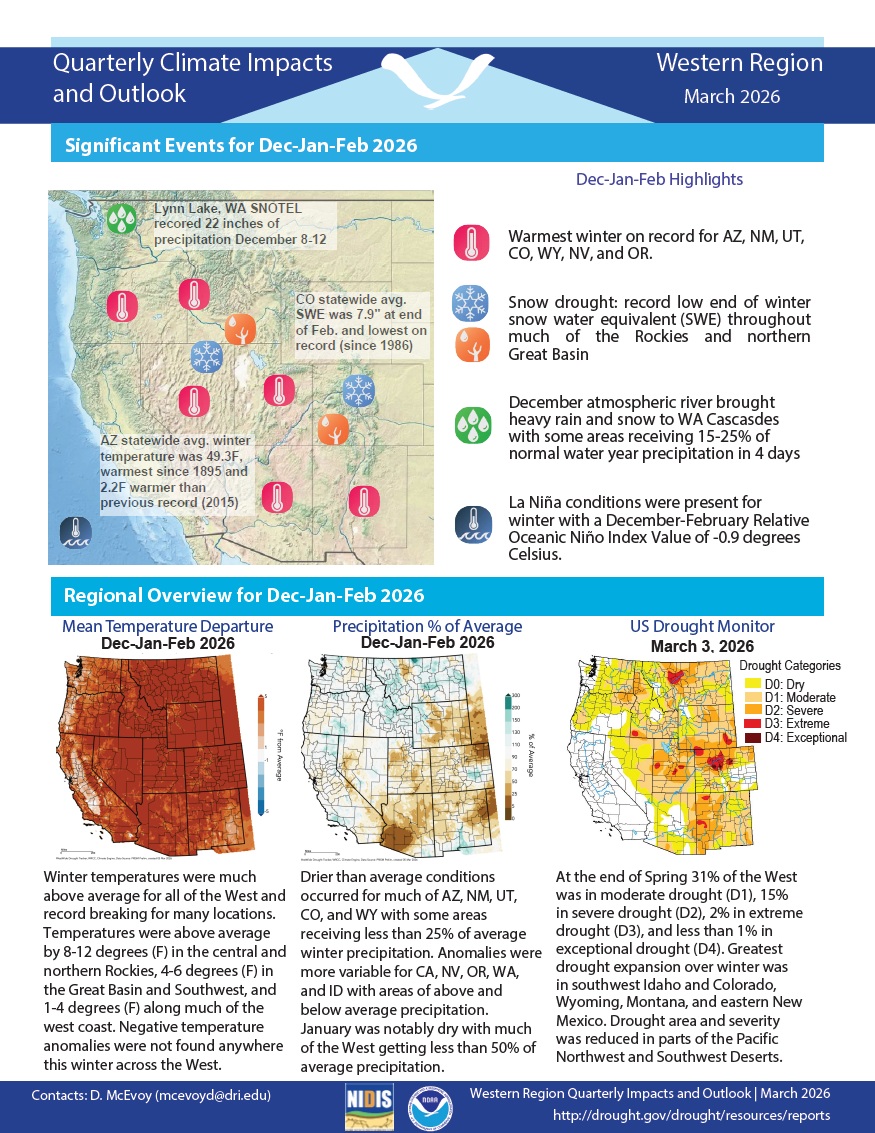
Quarterly Climate Impacts and Outlook for the Western Region for December 2025–February 2026. Dated March 2026.
Winter temperatures were much above average for all of the West and record breaking for many locations. Drier-than-average conditions occurred for much of Arizona, New Mexico, Utah, Colorado, and Wyoming, with some areas receiving less than 25% of average precipitation.
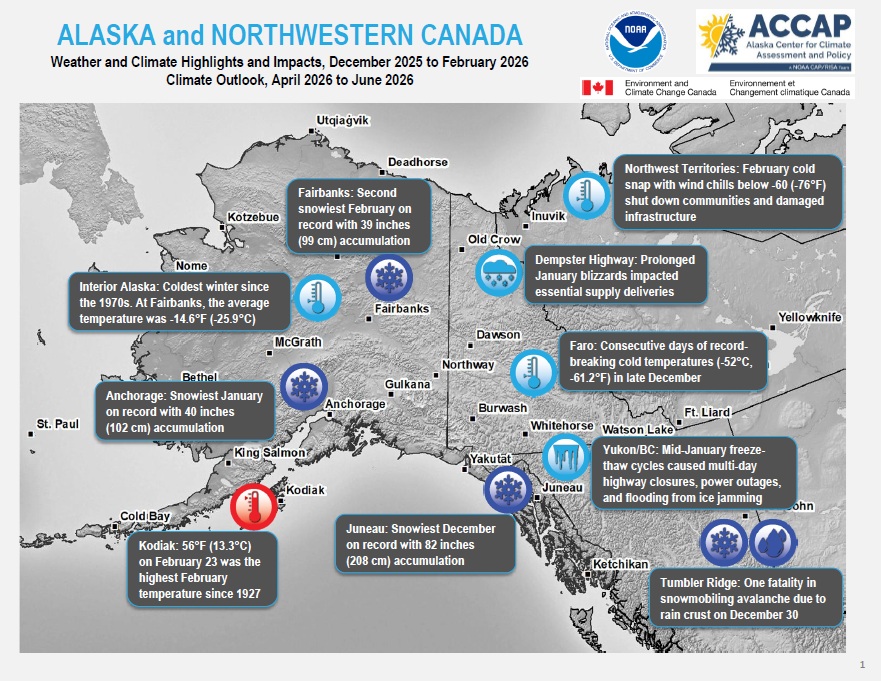
Quarterly Climate Impacts and Outlook for Alaska and Northwestern Canada for December 2025–February 2026, with an outlook for April–June 2026. Dated March 2026.
ECCC, NOAA, and partners created these outlooks to inform the public about recent impacts within their respective regions. Each regional report contains easy-to-understand language, and anyone can access them through the U.S. Drought Portal.