Research Confirms the Role of Citizen Science Contributions to Drought Detection and Monitoring
Timely information on drought impacts is important for developing and evaluating drought indicators, documenting drought events, reducing future risks, and enhancing public awareness. To address needs for better understanding and monitoring of localized drought impacts, this study recruited volunteers from the Community Collaborative Rain, Hail and Snow (CoCoRaHS) network to report on how weather and recent precipitation affected their local environments and communities. The study found that the reporting of conditions across a wet-to-dry scale by the CoCoRaHS volunteers reflect meteorological conditions, and provide on-the-ground details that are being incorporated into existing drought monitoring processes. The study was led by researchers from the Carolinas Integrated Sciences and Assessments (CISA), a NOAA RISA team, and the State Climate Office of North Carolina, with funding from NIDIS and the NOAA RISA program.
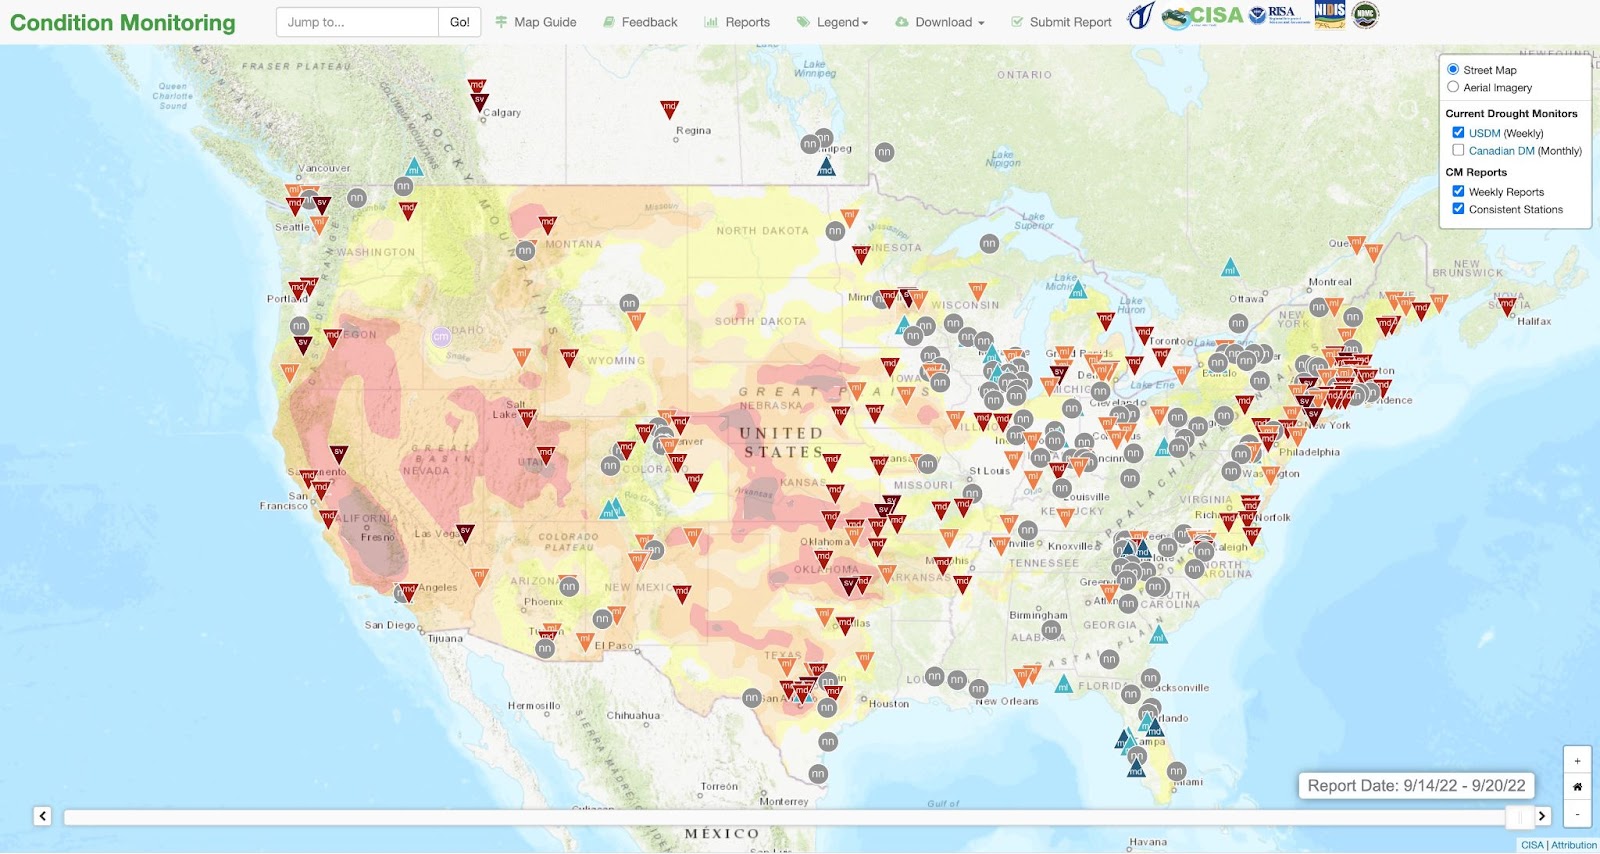
The project started as a pilot in North Carolina and South Carolina in 2013 as part of the Coastal Carolinas Drought Early Warning System (DEWS) and expanded to the national CoCoRaHS network in 2016. Volunteers indicate the level of wet, normal, or dry conditions they observe using the “condition monitoring scale bar,” and they can also provide a written narrative. The submitted information is accessible through an interactive web map (Figure 1).
Drawing from the more than 7,000 reports submitted by 431 observers in the Carolinas from October 2016 to June 2020, as well as feedback provided by agencies responsible for drought monitoring, this study assessed the usefulness of the reports for drought monitoring and decision making. Three dimensions of usefulness were considered: the extent to which volunteers’ assessments of conditions correspond to quantitative indicators (namely EDDI, SPI, SPEI), how their qualitative narratives depicted changing conditions, and agencies’ actual use of the reports.
The evaluation indicated that the volunteers’ scale bar selections align with commonly used quantitative indicators, with the 14-day Standardized Precipitation-Evapotranspiration Index (SPEI) showing the strongest correlation. While the content of the written narratives varied considerably, the most comprehensive reports included information that helped to capture the complexity of different drought stages and impacts, for example during drought onset when topsoil layers and plants show stress and deeper soil levels and water resources are not yet affected. Individuals involved in monitoring indicated that they found the volunteer reports and their assessments to be credible, relevant, and timely. The reports themselves provided on-the-ground verification of conditions and pointed to places that warrant further investigation by official drought monitoring committees (Table 1). Reports from volunteers who report regularly, that is every one to two weeks, were considered to be most useful.
The extent and nature of report use by decision makers in the study varied and depended on organizational activities and staff capacity to regularly assess the reports’ use and utility. These reports are not widely used beyond drought monitoring, in part because their design and volunteer training has focused on collecting drought-related information. However, the narrative reports often contain additional information, such as about recent weather events, that could inform the writing of weather event summaries or climate overviews. The highly localized information provided by observers can fill drought monitoring gaps by ground-truthing quantitative indicators and offering information in places where other monitoring tools may not exist. Overall, the research team found that strategic investments in time and funding can help fill in geographic and temporal gaps in drought monitoring information through volunteer observations. Consideration of the resources required to recruit and train new volunteers, for paid staff to engage with volunteers and to quality control and assure volunteer-collected data, as well as the investments made by volunteers themselves, helps to sustain high-quality data collection.
The study team included Amanda Farris and Kirsten Lackstrom of the Carolinas Integrated Sciences and Assessments (CISA), a NOAA RISA team, and Rebecca Ward of the State Climate Office of North Carolina. Other partners included the Community Collaborative Rain, Hail and Snow (CoCoRaHS) network, the National Drought Mitigation Center, and North Carolina and South Carolina State Climate Offices.
| Overview of Conditions | Condition Monitoring Report Examples |
|---|---|
| Spring early onset: Wet conditions characterized much of the Carolinas through winter and early spring of 2019. South Carolina observers noted drying in March, although April rains brought the return of wetter conditions. | "January and February together recorded a 3.0" deficit for the year. We've had small amounts of rain this past week, but with warmer temperatures, it is necessary to monitor more closely lawn and garden irrigation. Pollen is also now a factor. Very messy! Lagoon levels are beginning to drop some and birds and other wildlife are looking for water. It would be nice to have a soaking day long rain!" (SC-BF-10, 3 March 2019, scale bar selection = mildly dry) |
| Spring intensification: Conditions began to shift as an early heatwave led to North Carolina's third warmest May on record and record-setting temperatures topped 100 degrees F throughout South Carolina. | "No significant rain for 6 weeks. Need to water vegetation in yard and garden. Water level in retention pond is down by 3.5 feet. Air temperatures in the 90s causing accelerated evaporation of pond and bird baths." (SC-DC-55, 26 May 2019, scale bar selection = moderately dry) |
| Spring recovery: Drought severity peaked during the week of June 4 but subsided as storms brought relief. | "After 5" of rain this week the soil has returned to normal. Grass [has] turned green in most spots and has started to grow again. Lagoons have been refreshed with new water and the fish and alligators are happy." (SC-BF-2, 10 June 2019, scale bar selection = normal) |
| Summer variability and near-normal conditions: Summer weather was characterized by spotty thunderstorms. Sporadic rainfall and some below-average temperatures in late July and August kept dry conditions at bay for many areas. | "We've had 2.49" so far in July, with 0.82" in the last seven days. We had to water grass late last week when the lawn was starting to show stress, but rains this week have the lawn looking good." (SC-RC-12, 27 July 2019, scale bar selection = normal) |
| Summer onset: Drought began to emerge again throughout South Carolina and into North Carolina in late summer. | "With only 0.20 of rain over the past 7 days, we are experiencing dry conditions. Water levels are just below what would be normal but not significantly low. Risk of fire is a little higher than it has been as well. Our Christmas Trees are doing fine but could use some rain in the next few days. Our vegetable garden is beginning to play out but there is still enough moisture to keep tomatoes coming." (NC-MS-19, 2 September 2019, scale bar selection = mildly dry) |
| Drought buster (or bust): Hurricane Dorian made landfall near Cape Hatteras, NC on Sept 6, which alleviated dryness along the coast. However, the hurricane failed to bring widespread rainfall. |
"It was a dry week, but Hurricane Dorian brought 1.81 inches of steady rain yesterday. That replenished moisture to normal conditions." (NC-WK-203, 6 September 2019, scale bar selection = normal) "Hurricane Dorian missed my area. We got 0.46" of rain and that is all for the week. Dry but not arid. The Eno River remains very low." (NC-OR-41, 7 September 2019, scale bar selection = dry) |
| Intensification: After Dorian, another round of unseasonably hot and dry weather through September and October led to the second flash drought of 2019. | "No rainfall in nearly a month. Grass is brown. Hay fields are not growing any. Farmers are still cutting fields that grew from rain received earlier in the summer. Once cut, the grass is not growing any. Pastures are not growing, and farmers are having to feed hay early. This could cause hay shortages this winter. Soybeans are turning and losing their leaves earlier than usual. The dry weather is good for the corn that is being harvested. Small blueberry bushes need to be watered to keep them from drying. The danger for wildfires is increasing." (NC-CT-39, 21 September 2019, scale bar selection = moderately dry) |
| Slow recovery: Conditions began to improve in late October. Condition monitoring observers record a lingering recovery lasting into December. | "With just over 2 inches of rain during the past week our dry conditions have improved somewhat. We are still dry but the recent precipitation has helped our springs and creeks. The much needed rain has helped to reduce the risk of fire as well." (Station NC-MS-19, 25 November 2019, scale bar selection = moderately dry) |
Examples of condition monitoring reports at different stages of the 2019 flash droughts. Source: Lackstrom, Kirsten, Amanda Farris, and Rebecca Ward. Backyard Hydroclimatology: Citizen Scientists Contribute to Drought Detection and Monitoring, Bulletin of the American Meteorological Society, 2022.