Visualizing Colorado’s Drought Plan: A Story Map
-- View the Story Map –
The Colorado Water Conservation Board (CWCB), part of the state’s Department of Natural Resources, has launched an interactive dashboard that displays drought vulnerability at the state and county level based on Colorado’s 2018 Drought Plan. An Esri Story Map, the platform takes users through visual summaries of Colorado drought risk by sectors, using images and graphs to provide an interactive and engaging experience.
Colorado’s Drought Plan
Colorado is no stranger to drought (Fig 1). Since 2000, the state has experienced four periods of exceptional (D4) drought lasting over six months, with the longest duration of drought (D1-D4) spanning just over seven and a half years beginning on October 30, 2001 and ending on May 19, 2009 (based on the U.S. Drought Monitor). During the week of July 16, 2002, exceptional drought D4 affected 34.37% of Colorado land.
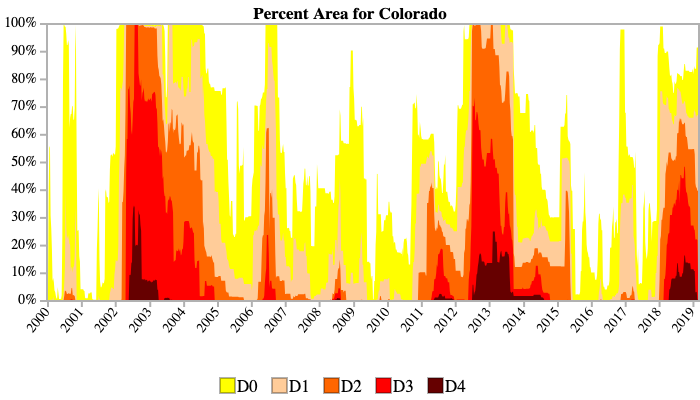
Fig 1. Times series showing the history of drought in Colorado going back to 2000.
Colorado’s first drought plan was drafted in 1981 and has gone through many revisions, the most recent of these in 2018. A large focus of the 2018 plan was on risk assessment, including an overview and analysis of the Colorado’s drought vulnerability based on estimates provided in both local and state risk assessments.
The vulnerability assessment focused on identifying, quantifying, and scoring the threat from potential drought hazards to various sectors across social, economic, environmental, and political fields. It highlights drought consequences for sectors and the surrounding environment and also explores how the state could improve its capacity to manage these consequences. The drought vulnerability assessment categorizes sectors and assets which ultimately drive the risk management process.
The Story Map
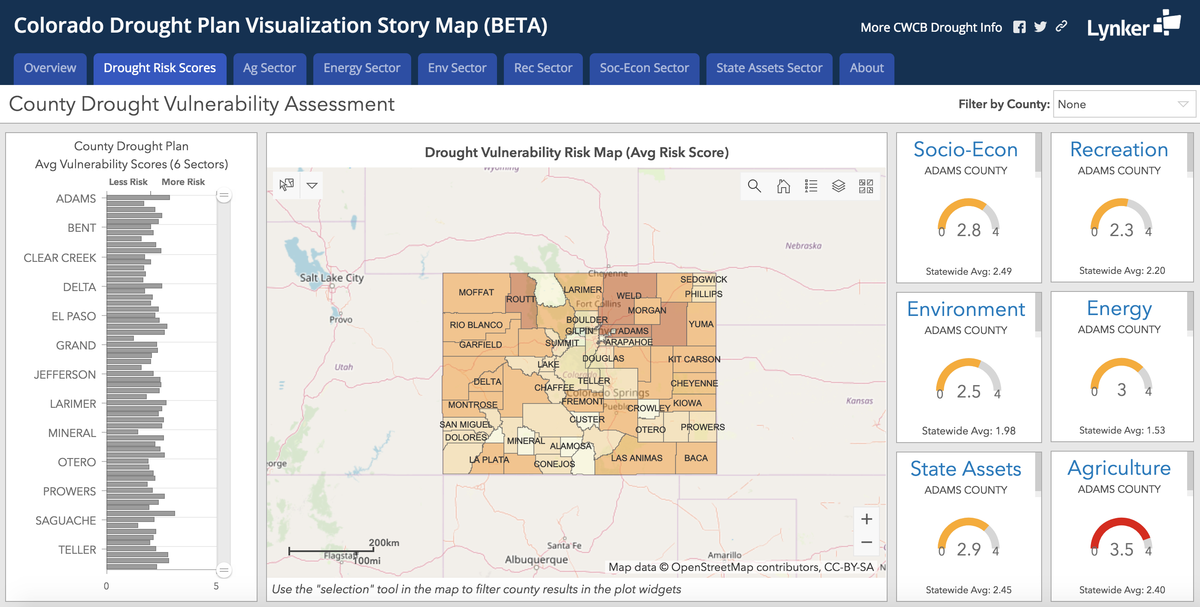
Now, in addition to the Plan’s detailed Drought Vulnerability Assessment, those interested in Colorado drought risk can view up-to-date stats on the state and county level using the new CWCB Colorado Drought Plan Visualization Story Map.
The opening screen of the Story Map provides an overview of County Drought Risk Scores across Colorado as well as a snapshot of drought vulnerability risk by sector. Similar to the 2018 updated Plan, the Story Map also drills down into content specific to different sectors: agriculture, recreation, socioeconomic, environment, energy, and state assets. State assets include state buildings and critical infrastructure (dams), land board revenue, state-based recreation and park visitation, aquatic species and habitat (fisheries), and protected state-owned areas.
The assessment calculations are numerical vulnerability scores of 1-4 for each county and each sector. As of March 7, 2019, statewide average risk scores by sector were: agriculture (2.40), recreation (2.20), socioeconomic (2.49), environment (1.98), energy (1.53), and state assets (2.45). Counties with the highest average risk scores include Routt (3.09), Adams (2.84), Weld (2.79), and Washington (2.76) counties.
The sector tabs on the Story Map feature a map showing the location and distribution of risk across the state as well as statistics relevant to that sector. These stats help put drought vulnerability into the perspective of indirect impacts on society and the economy. For example, the recreation sector page not only shows the distribution of county drought vulnerability in the recreation sector, but also displays current information on the number of ski resorts, golf courses, wildlife viewing areas, water/boating state parks, and whitewater rafting reaches that are affected by drought right now.
The Story Map provides an innovative, integrated way for policy makers and citizens to understand the drought vulnerability assessment in a way that is relevant to both the public and private sectors of Colorado.
For other drought status and monitoring resources in Colorado, please visit:
Water Availability Task Force (WATF)
Drought Status Reports
Water Supply Monitoring Measurements
Drought and Weather Forecast
Staff from Lynker, a Boulder-based environmental consulting group, have supported CWCB on both the Colorado Drought Vulnerability Assessment and development of the Drought Plan Visualization tool.