Quarterly Climate Impacts and Outlook for the Great Lakes Region for June – August 2019. Dated September 2019.
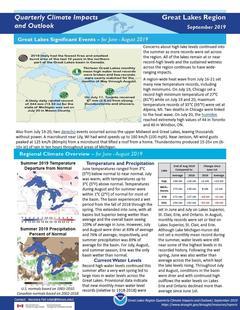
June temperatures ranged from 3°C (5°F) below normal to near normal. July was warm, with temperatures up to 3°C (5°F) above normal. Temperatures during August and for summer were within 1°C (2°F) of normal for most of the basin. The basin experienced a wet period from the fall of 2018 through the spring. This extended into June, with all basins but Superior being wetter than average and the overall basin seeing 109% of average in June.
Quarterly Climate Impacts and Outlook for the Great Lakes Region for March – May 2019. Dated June 2019.
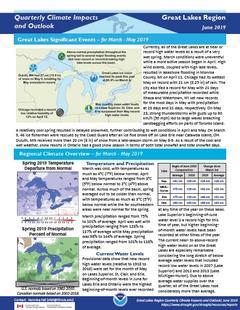
Across much of the basin, spring averaged out to be colder than normal, with temperatures as much as 3°C (5°F) below normal while the far southeastern areas were near normal for the spring. Spring precipitation ranged from 101% to 118% of average.
Quarterly Climate Impacts and Outlook for the Midwest Region for March – May 2019. Dated June 2019.
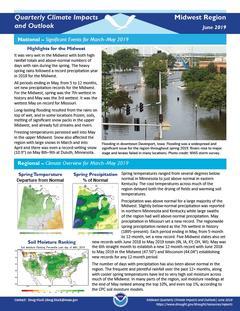
Spring temperatures ranged from several degrees below normal in Minnesota to just above normal in eastern Kentucky. Precipitation was above normal for a large majority of the Midwest.
Quarterly Climate Impacts and Outlook for the Midwest Region for December 2018 – February 2019. Dated March 2019.
Winter temperatures for the 3-month period of December to February ranged from a few degrees below normal in the northwest to a few degrees above normal in the southeast. Precipitation was well above normal in the Midwest, ranking as the third wettest winter back to 1895.
Quarterly Climate Impacts and Outlook for the Great Lakes Region for December 2018 – February 2019. Dated March 2019.
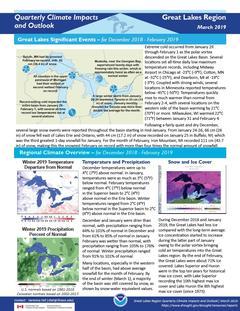
Winter temperatures ranged from 2°C (4°F) below normal in the Superior basin to 2°C (4°F) above normal in the Erie basin. Winter precipitation ranged from 91% to 101% of normal.
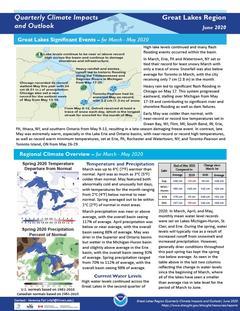
Quarterly Climate Impacts and Outlook for the Great Lakes Region for March – May 2020. Dated June 2020.
Spring temperatures averaged out to be within 1°C (2°F) of normal in most areas. Spring precipitation ranged from 70% to 112% of average, with the overall basin seeing 98% of average.
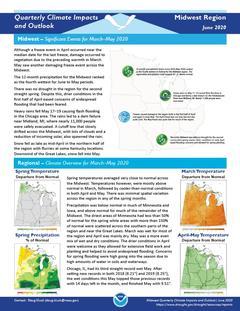
Quarterly Climate Impacts and Outlook for the Midwest Region for March – May 2020. Dated June 2020.
Spring temperatures averaged very close to normal across the Midwest. Precipitation was below normal in much of Minnesota and Iowa, and above normal for much of the remainder of the Midwest.
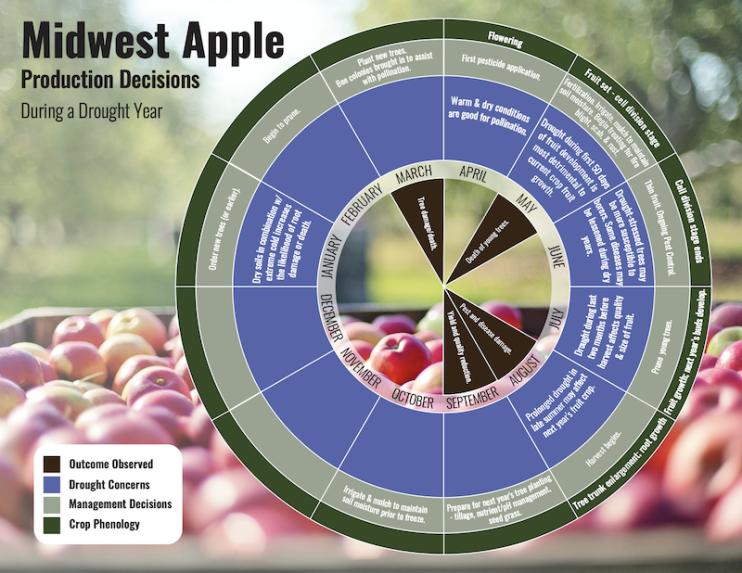
The project, Connecting Drought Early Warning to the Decision Making Needs of Specialty Crop Producers in the Midwestern United States, developed a set of decision calendars that provide month-by-month and seasonal advice on how growers manage production of Midwestern apple, grape, cranberry, and irrigated potato crops during drought years. Fact sheets highlighting appropriate drought and climate tools for monitoring conditions during the growing seasons and beyond are also available.
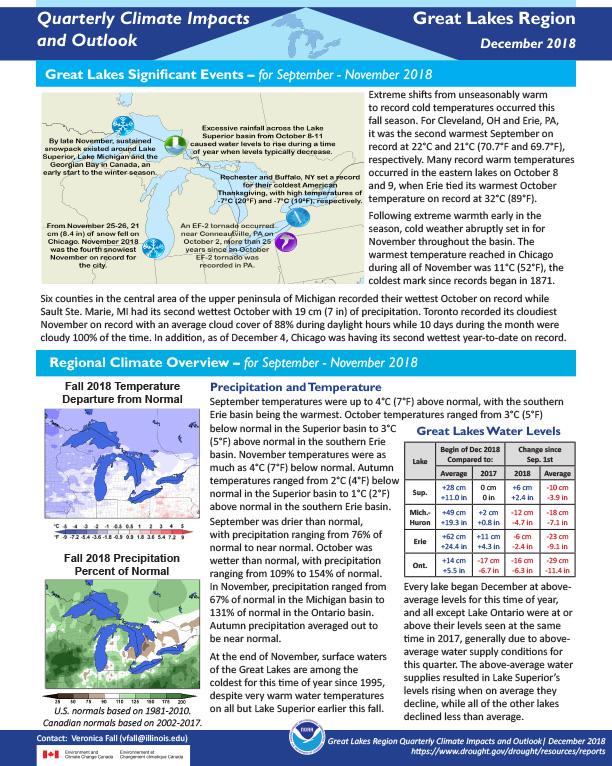
Quarterly Climate Impacts and Outlook for the Great Lakes Region for September – November 2018. Dated December 2018.
Extreme shifts from unseasonably warm to record cold temperatures occurred this fall season. Autumn precipitation averaged out to be near normal.
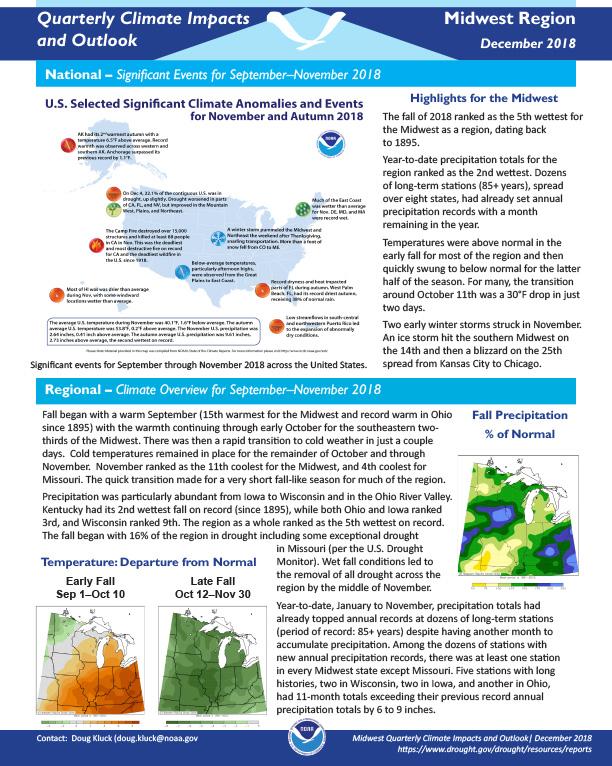
Quarterly Climate Impacts and Outlook for the Midwest Region for September – November 2018. Dated December 2018.
Fall began with a warm September (15th warmest for the Midwest and record warm in Ohio since 1895) with the warmth continuing through early October for the southeastern two thirds of the Midwest. Precipitation was particularly abundant from Iowa to Wisconsin and in the Ohio River Valley.


