The Climate Toolbox: Drought Recovery Tool
University of California, Climate Impacts Research Consortium (CIRC), NOAA's National Integrated Drought Information System (NIDIS)
The Climate Toolbox’s Drought Recovery Tool allows users to investigate the probability of recovering from drought conditions in the Western U.S. based on past observations from 1920-2020. Users can select a Western U.S. county or HUC 8 watershed on an interactive map to view the probability of recovering from drought given the current classification of drought for that region.
Users can select a region and time period of interest, choose a data variable—soil moisture or total moisture—and select a definition of “drought recovery.” Once selected, an interactive map will show the initial month’s drought conditions alongside another map showing the probability (from 0%-100%) that the forecast month will meet the selected conditions for drought recovery.
The probability of drought for a future month—given the current state of drought in an initial month—can be useful to drought planners and decision-makers. This tool estimates this conditional probability of drought given current conditions by considering all past years that had the same drought classification as current conditions. By counting which of those years resulted in drought in a future month, this tool estimates the conditional probability of drought as the count divided by the number of years with current conditions. The research team did this for the years 1920–2020 to form a look up table of the conditional probabilities of drought.
This tool was created by Katherine Hegewisch and John Abatzoglou at the University of California Merced, with funding from NOAA’s National Integrated Drought Information System (NIDIS) and Climate Impacts Research Consortium (CIRC). Learn more about the research that led to this tool.
How To
- Under the “Choose View” section, select whether you want to view maps of initial and forecast data, or a table of past data and map of forecast data.
- Under “Choose Location,” select whether to look at summaries by county or HUC 8 watershed. Specify an exact location to highlight on the maps by selecting a specific county or watershed from the dropdown or by clicking the region on the map.
- Under “Choose Data,” select the variable, initial month, forecast month, and definition of drought recovery (e.g., wetter than Moderate Drought - D1).
- The map or table on the left shows drought classifications for the initial month specified in terms of the colors and categories from the US Drought Monitor.
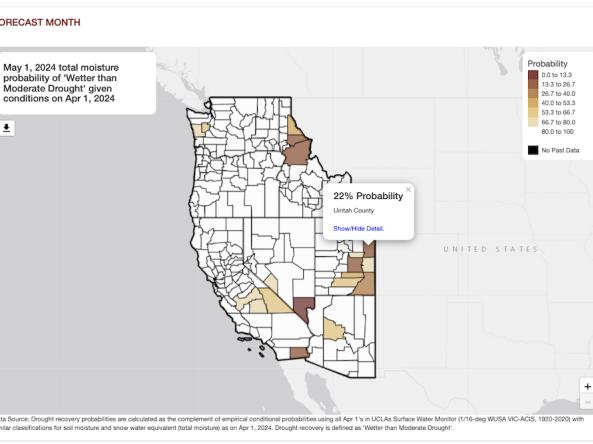
- The map on the right shows the conditional probabilities of locations being in drought in a forecast month, based on the criteria you selected.
- Click on region (county or HUC 8 watershed) on the map to view more information.
Documentation
This tool uses gridded hydrology data from VIC (UCLA). The method for this tool was based on Danielle Moruzzi's Master's thesis at Oregon State University. The data for this tool was made accessible to the designers by Dennis Lettenmaier at the University of California Los Angeles.