Quick Drought Response Index (QuickDRI)
National Drought Mitigation Center, University of Nebraska-Lincoln, U.S. Geological Survey Earth Resources Observation and Science Center, U.S. Department of Agriculture (USDA) Agricultural Research Service, NASA Goddard Space Flight Center
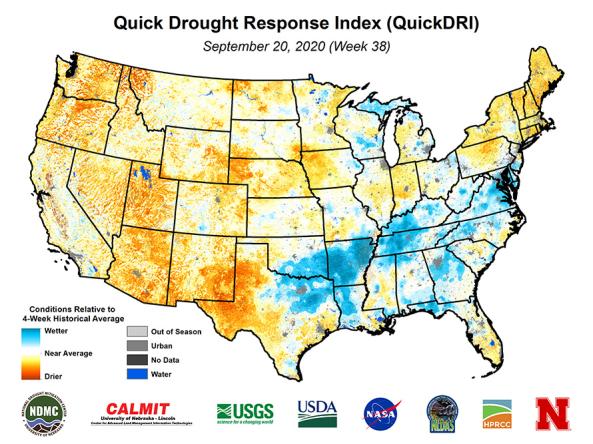
The Quick Drought Response Index (QuickDRI) is a shorter-term indicator of dryness. It is calculated through the analysis of satellite- and model-based observations of conditions that influence drought.
QuickDRI is a composite index that combines: Station-based precipitation, Soil moisture, Evapotranspiration, Vegetation health, and Environmental landscape characteristics, such as soils, land use, land cover, and elevation.
QuickDRI is designed to provide a snapshot of anomalously dry or wet conditions over the past 4 weeks and serves as an indicator of emerging or rapidly changing drought conditions. The maps are updated weekly over the continental United States and have a 1-kilometer spatial resolution.
How to
How to use this site:
- Homepage includes the most recent weekly map. Use your cursor to select a state for futher details
- Maps can be downloaded in PDF, PNG, or JPG formats by selecting the icon belong the map or map legend
- Archived maps can be found by selecting the “Archive” tab at the top for the page
- Time series maps can be found by selecting the “Time Series” tab at the top of the page
Access
Quick Drought Response Index (QuickDRI) – homepage for Quick Drought Response Index (QuickDRI) product
Archived QuickDRI maps – weekly maps dating back to January 2, 2000