U.S. flag

An official website of the United States government

The U.S. government is closed. This site will not be updated; however, NOAA websites and social media channels necessary to protect lives and property will be maintained. To learn more, visit commerce.gov.

For the latest forecasts and critical weather information, visit weather.gov.
DATA & MAPS

Select categories to browse data

Looking to Download Data? The Drought.gov team reformats data from multiple partners into web- and GIS-ready formats, which we use throughout Drought.gov. These data are free for all to download.
Search Results(26)

NOAA Quarterly Climate Impacts and Outlooks Reports: two-page reports on regional climate impacts with an overview of recent and forecast conditions produced by NOAA.

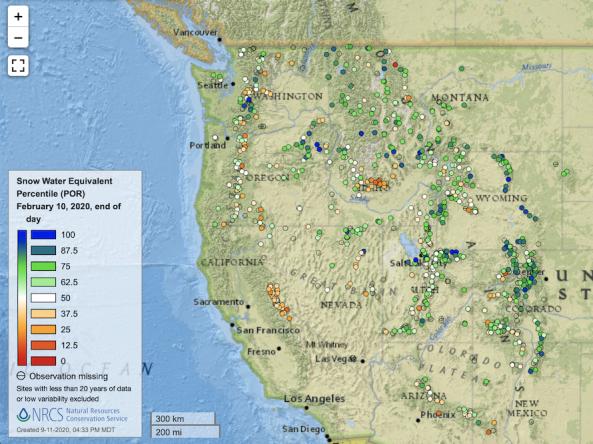
Point maps and interactive maps of snow water equivalent, snow depth, and snow density from the Natural Resources Conservation Service (NRCS) Snow Telemetry (SNOTEL).

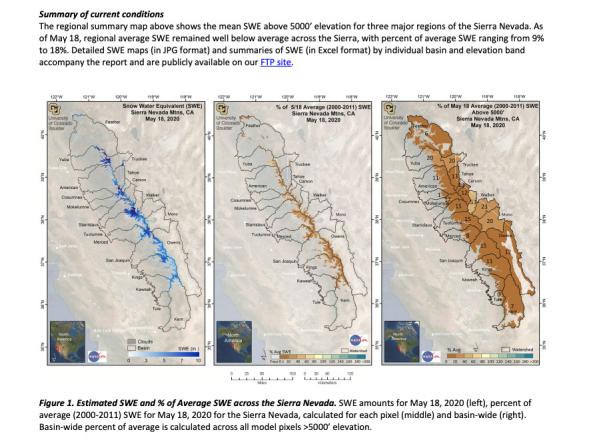
Provided by the University of Colorado Boulder and NASA's Jet Propulsion Laboratory, these reports provide near-real-time estimates of snow-water equivalent (SWE) at a spatial resolution of 500 m for the Sierra Nevada mountain range in California and the Intermountain West region (Colorado, Utah, and Wyoming) from mid-winter through the melt season. 

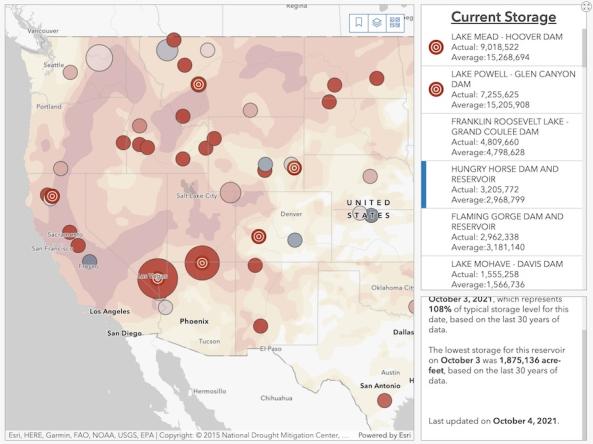
The Bureau of Reclamation's interactive Reservoir Storage Dashboard provides current conditions for 44 major Reclamation reservoirs and comparisons with historical storage data. For each reservoir, users can view the current storage amount in acre-feet, the current storage level as a percent of average (based on the last 30 years of data), and records for lowest observed storage.