U.S. flag

An official website of the United States government

DATA & MAPS

Select categories to browse data

Looking to Download Data? The Drought.gov team reformats data from multiple partners into web- and GIS-ready formats, which we use throughout Drought.gov. These data are free for all to download.
Search Results(189)

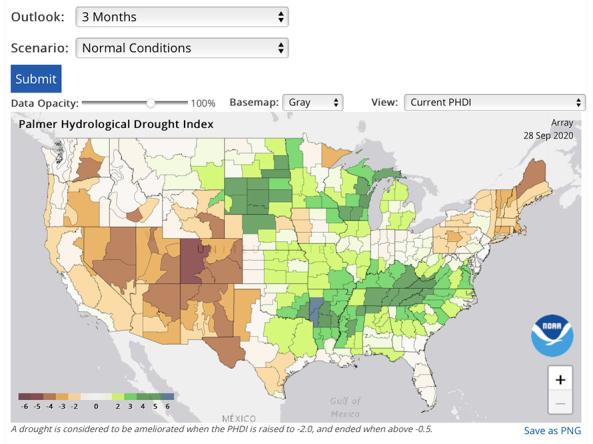
The National Weather Service's Climate Prediction Center (CPC) produces official monthly and seasonal temperature and precipitation outlook products. This information was converted into projected monthly temperature and precipitation values for future months, then the projected values were used to compute projected future Palmer Hydrological Drought Index (PHDI) values.

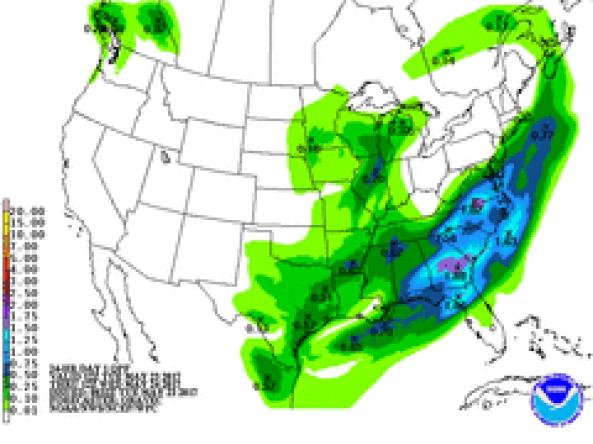
NWS WPC produces Quantitative Precipitation Forecasts (QPFs) that depict the amount of liquid precipitation expected to fall in a defined period of time. In the case of snow or ice, QPF represents the amount of liquid that will be measured when the precipitation is melted.

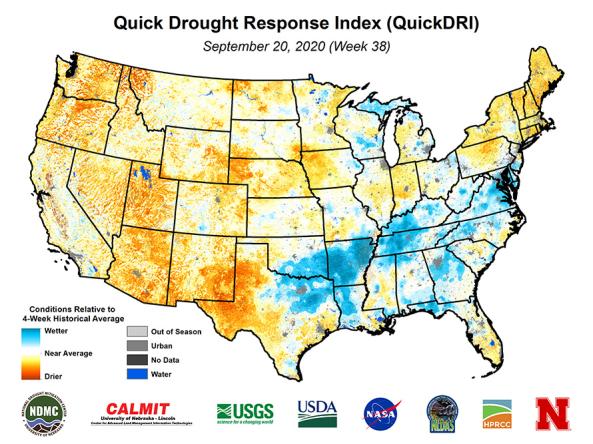
Quick Drought Response Index (QuickDRI): a geospatial tool that characterizes the intensification of short-term drought condition patterns on a weekly basis across the continental United States (CONUS) at a 1-km gridded spatial resolution.

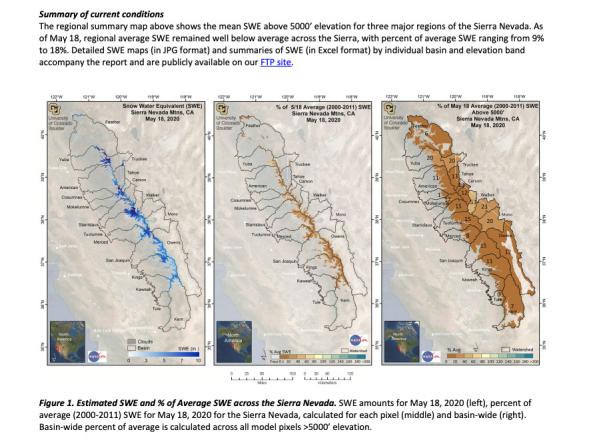
Provided by the University of Colorado Boulder and NASA's Jet Propulsion Laboratory, these reports provide near-real-time estimates of snow-water equivalent (SWE) at a spatial resolution of 500 m for the Sierra Nevada mountain range in California and the Intermountain West region (Colorado, Utah, and Wyoming) from mid-winter through the melt season.