December storms helped, but the drought is not busted yet.
Register here for the January 23 California-Nevada Drought & Climate Outlook Webinar.
Key Points
- Several December storms have helped snowpack and soil moisture conditions; nonetheless, 98% of California and 100% of Nevada remain in drought.
- A La Niña advisory is still in effect, but is expected to change to ENSO neutral by spring.
- Extended range forecasts are leaning towards dry conditions for California and Nevada for the latter part of December. However, storms forecasted for the Pacific Northwest could drop down and impact the region.
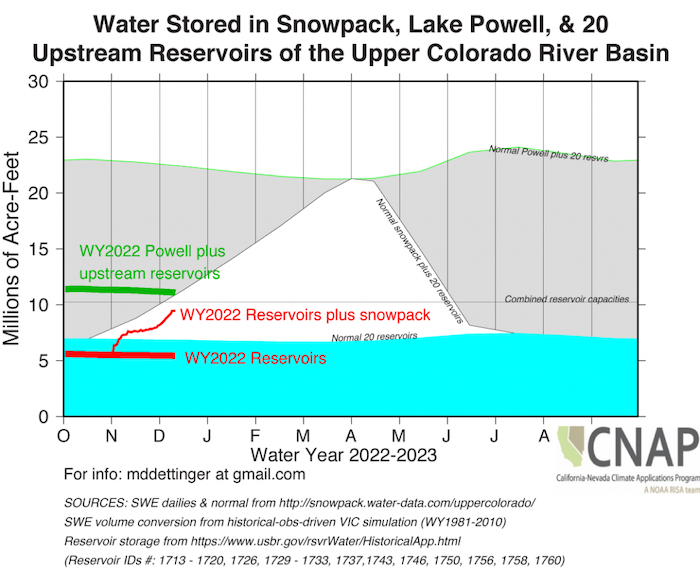
- A Colorado Basin 24-month study shows Lake Powell dropping below the power pool in the minimum probable inflow scenario.
The U.S. Drought Monitor (USDM) is updated each Thursday to show the location and intensity of drought across the country. Drought categories show experts’ assessments of conditions related to dryness and drought including observations of how much water is available in streams, lakes, and soils compared to usual for the same time of year.
California/Nevada conditions as of December 13, 2022:
- 97.94% of California is experiencing Moderate (D1) to Exceptional (D4) Drought (28.33% in D3, 7.16% in D4)
- California population in drought: 37,060,803
- 100% of Nevada is experiencing Moderate (D1) to Exceptional (D4) Drought (24.45% in D3, 0% in D4)
- Nevada population in drought: 2,700,550
U.S. Drought Monitor Categories
Abnormally Dry (D0)
Abnormally Dry (D0) indicates a region that is going into or coming out of drought. View typical impacts by state.
Moderate Drought (D1)
Moderate Drought (D1) is the first of four drought categories (D1–D4), according to the U.S. Drought Monitor. View typical impacts by state.
Severe Drought (D2)
Severe Drought (D2) is the second of four drought categories (D1–D4), according to the U.S. Drought Monitor. View typical impacts by state.
Extreme Drought (D3)
Extreme Drought (D3) is the third of four drought categories (D1–D4), according to the U.S. Drought Monitor. View typical impacts by state.
Exceptional Drought (D4)
Exceptional Drought (D4) is the most intense drought category, according to the U.S. Drought Monitor. View typical impacts by state.
The U.S. Drought Monitor (USDM) is updated each Thursday to show the location and intensity of drought across the country. Drought categories show experts’ assessments of conditions related to dryness and drought including observations of how much water is available in streams, lakes, and soils compared to usual for the same time of year.
California/Nevada conditions as of December 13, 2022:
- 97.94% of California is experiencing Moderate (D1) to Exceptional (D4) Drought (28.33% in D3, 7.16% in D4)
- California population in drought: 37,060,803
- 100% of Nevada is experiencing Moderate (D1) to Exceptional (D4) Drought (24.45% in D3, 0% in D4)
- Nevada population in drought: 2,700,550
Current Conditions
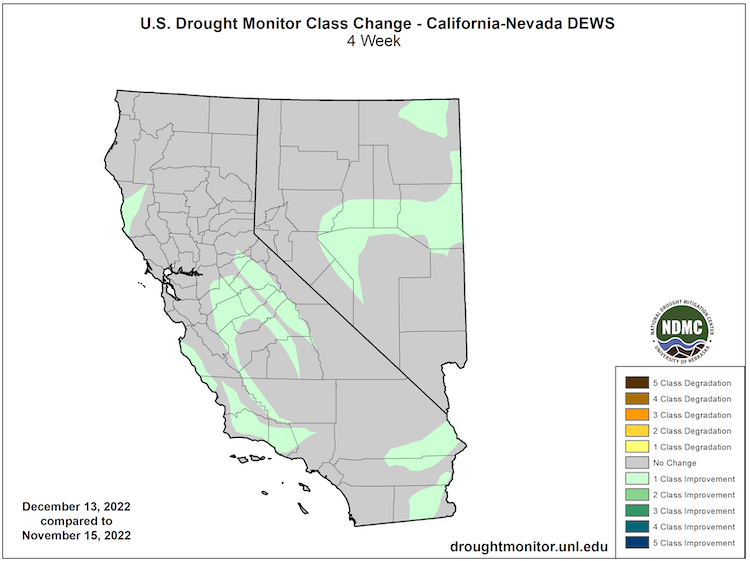
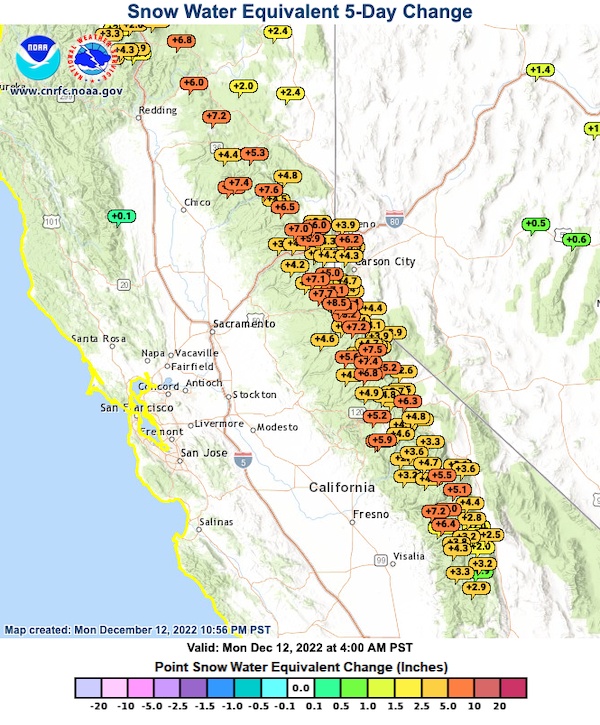
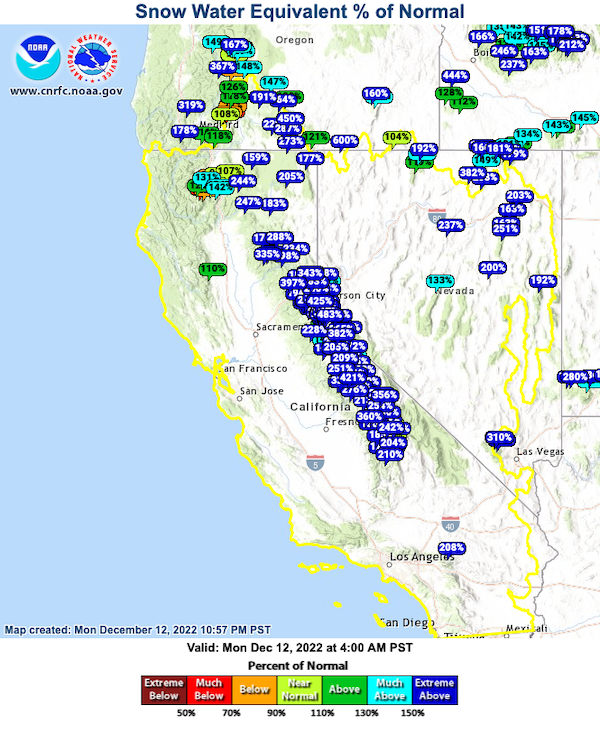
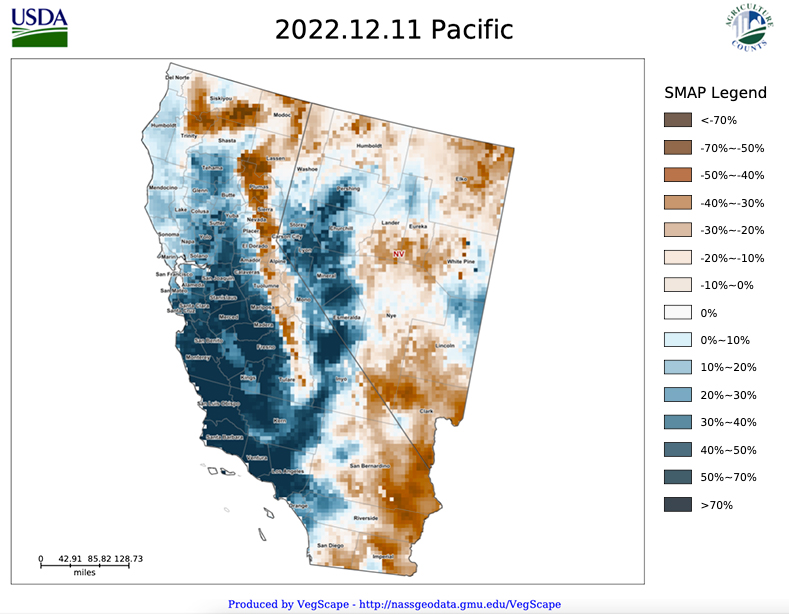
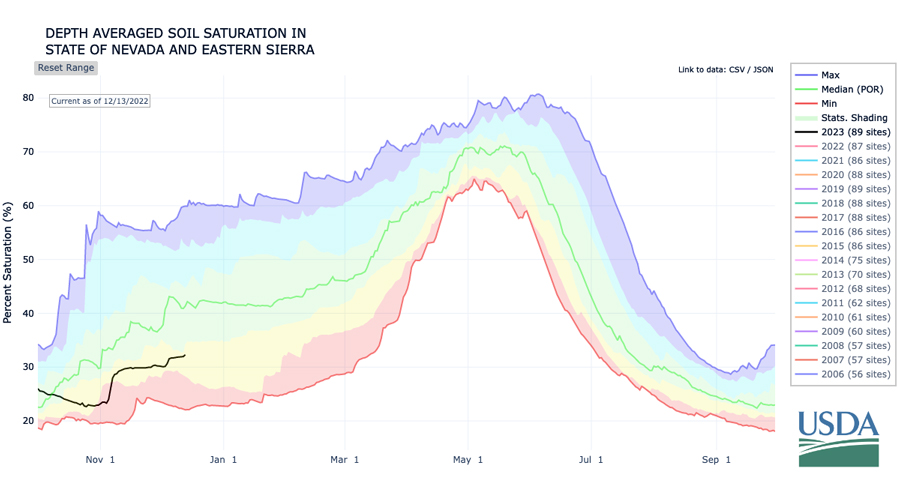
- According to the U.S. Drought Monitor, over the last month drought conditions have improved slightly in a few areas in California and Nevada. Recent storms have built a snowpack well above average for this time of year and increased soil moisture throughout much of California and Nevada.
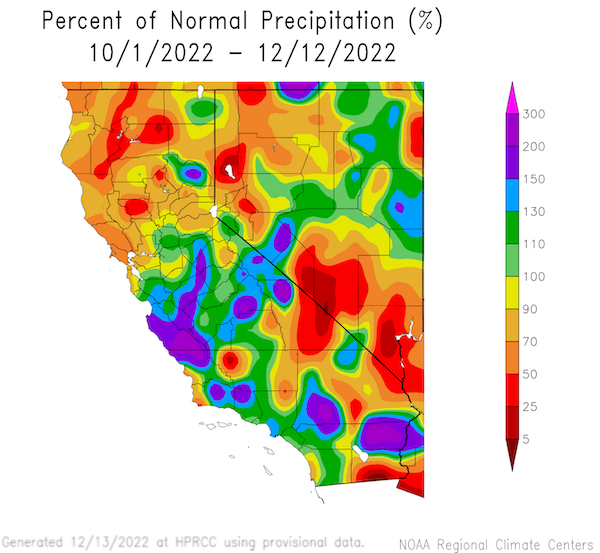
- Much of southern and central California have received above-normal precipitation for this time of year while precipitation in northern California is currently below normal. Southern Nevada and northwestern Nevada have received below-normal precipitation, though parts of Nevada are well above normal.
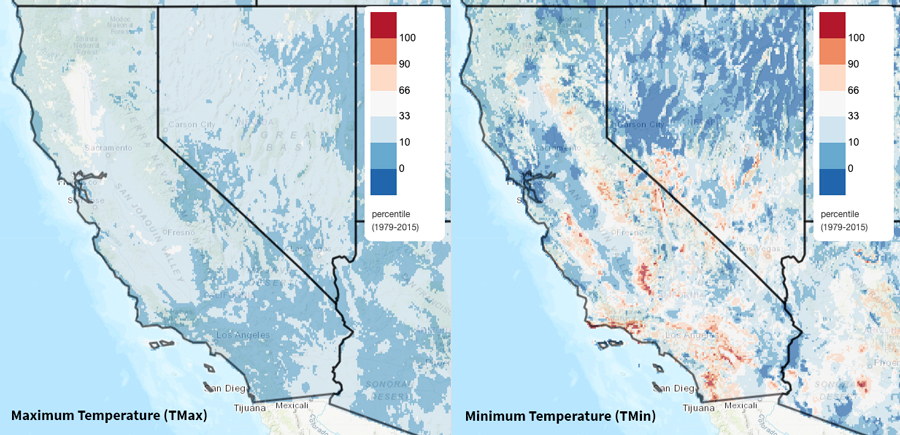
- A cold November that is continuing into December has helped to preserve the snowpack and minimize evaporative demand (the “thirst” of the atmosphere).
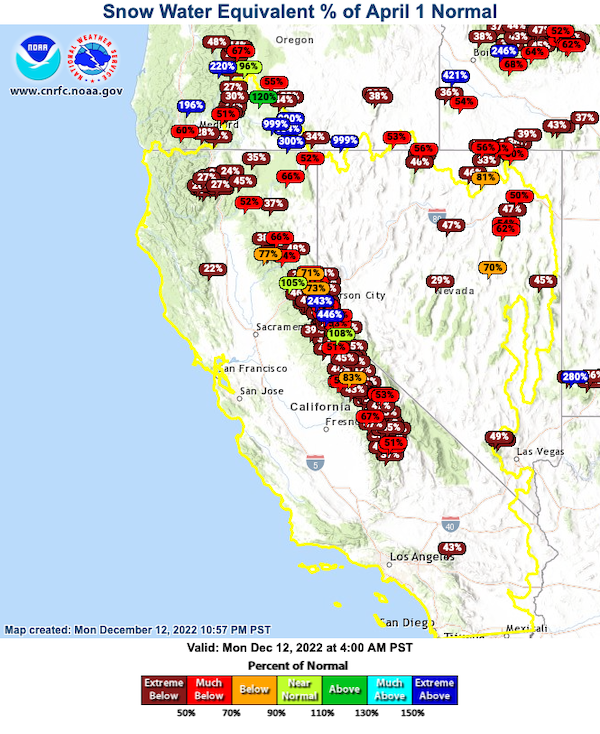
- Although recent storms have produced a healthy snowpack for this time of year, the snowpack is about 50% of April 1 normal snow water equivalent values.
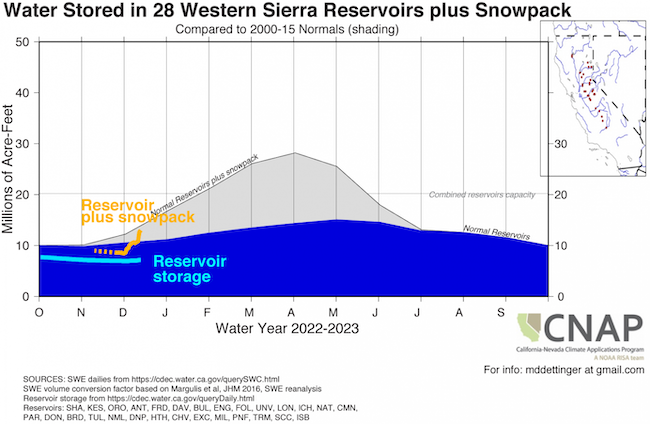
- Western Sierra reservoirs’ water storage plus snowpack is near normal for this time of year due to the recent storms, but many major reservoirs in California are well below normal.
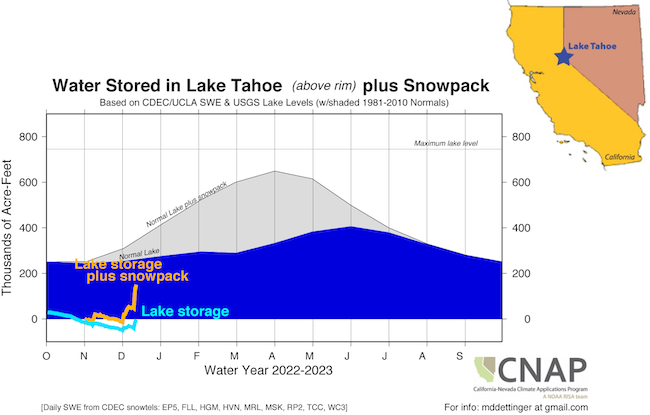
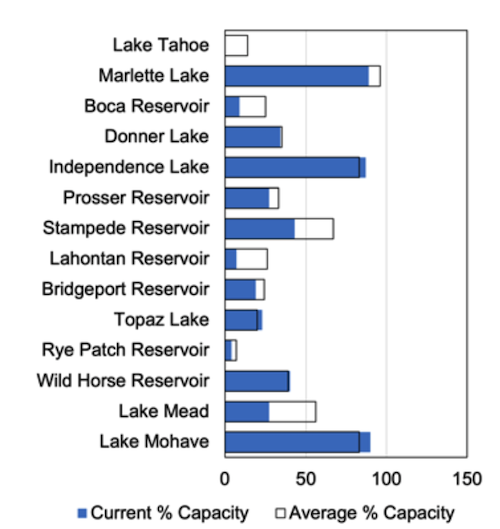
- In Nevada, Lake Mead, Lake Tahoe, and Lake Lahontan are well below the average percent of capacity. For Lake Tahoe, when snowpack plus water storage are combined, the total storage is above the rim.
- The most recent 24-month study for the Colorado River under the minimal probable inflow scenario shows Lake Powell dropping below the power pool and Lake Mead dropping to 1,018 feet.
- The Metropolitan Water District’s Board of Directors has declared a Regional Drought Emergency for all of Southern California and called upon water agencies to immediately reduce their use of all imported supplies.
- In the Upper Colorado, the combined snowpack and 20 upstream reservoirs of Lake Powell are slightly below normal for this time of year.
- For more information, check out Living with Drought in Nevada and the California Water Watch.
How is drought affecting your neighborhood? Click to see drought indicators, outlooks, and historical conditions by city, county, and state, as well as sign up for alerts.
U.S. Drought Monitor 4-Week Change Map
Percent of Normal Precipitation: Water Year to Date
Average Daily Maximum/Minimum Temperature Percentiles
Snow Water Equivalent Change: December 8–12
Snow Water Equivalent Percent of Normal
Daily Averaged Soil Moisture Anomalies
Depth Averaged Soil Saturation in Nevada and the Eastern Sierra
Water Storage + Snowpack: 28 Western Sierra Reservoirs and Lake Tahoe
Nevada Reservoir Storage
Upper Colorado River Basin Water Storage
Drought & Climate Outlook
El Niño–Southern Oscillation (ENSO)
NOAA’s ENSO alert system status is currently a La Niña Advisory. La Niña is expected to continue into the winter, with equal chances of La Niña and ENSO-neutral during January–March 2023. In February–April 2023, there is a 71% chance of ENSO-neutral. For more information, check out the NOAA ENSO blog or current status presentation and how La Niña impacts the Western U.S.
Subseasonal to Seasonal Drought, Temperature, and Precipitation Outlooks
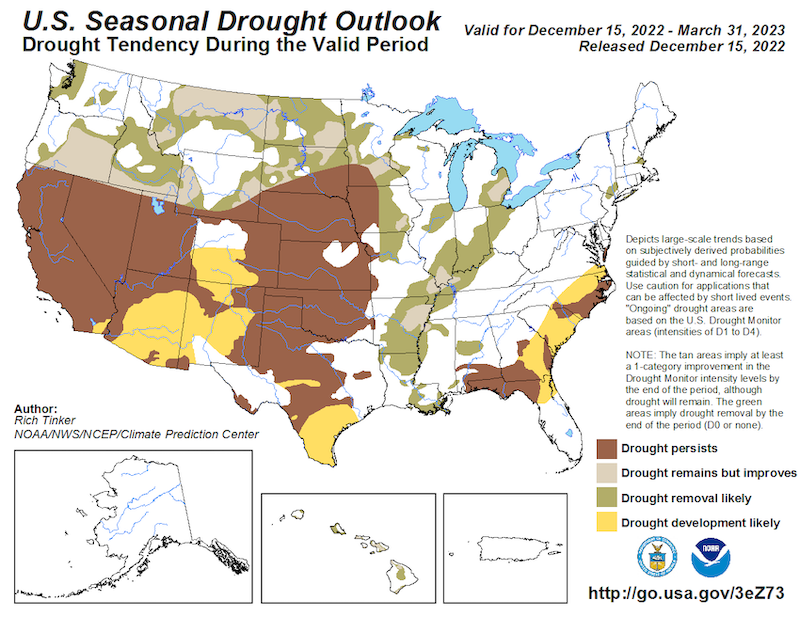
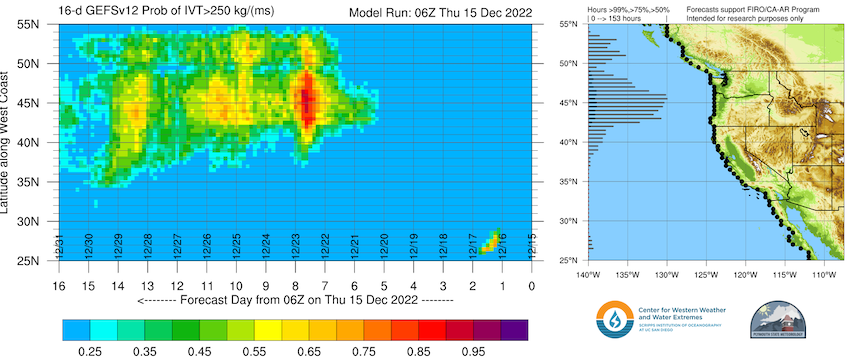
The next one-to-three month forecast shows drought persisting across California and the Great Basin, given the La Niña advisory. Historically, La Niña is associated with dry to normal conditions in the southern part of California and Nevada. The January-February-March outlook from the National Weather Service's Climate Prediction Center also favors equal chances of above- or below-normal temperatures for much of the region, with above-normal temperatures in southern California and Nevada. In the near term (1–2 weeks), both GEFS (the U.S. national model) and ECMWF (the European model) are suggesting another storm around December 22–23 focused on Oregon, but it may impact northern California and Nevada.
Seasonal (3-Month) Drought Outlook
Seasonal Temperature and Precipitation Outlooks
Likelihood and Timing of Atmospheric River Conditions
Drought Early Warning Resources
Prepared By
Julie Kalansky
Program Manager, California-Nevada Adaptation Program (A NOAA CAP/RISA team)
This drought status update is issued in partnership between the National Oceanic and Atmospheric Administration (NOAA), the California-Nevada Adaptation Program (a NOAA CAP/RISA team), and the Western Regional Climate Center at the Desert Research Institute to communicate the current state of drought conditions in California-Nevada based on recent conditions and the upcoming forecast. NIDIS and its partners will issue future drought status updates as conditions evolve.