Extremely Wet and Cool Winter Alleviates Most of the Region’s Drought
Register here for the May 9 Western Drought Webinar.
Register here for the May 22 California-Nevada Drought & Climate Outlook Webinar.
Key Points
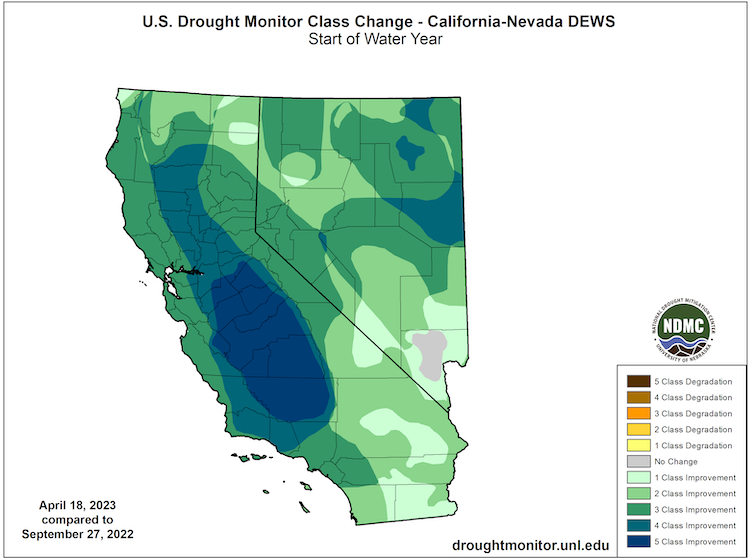
- According to the April 18, 2023 U.S. Drought Monitor, 14.6% (only ~1% Severe Drought) of California-Nevada remains in drought, with no Extreme or Exceptional Drought. Drought has not been this low in California-Nevada since late February 2020.
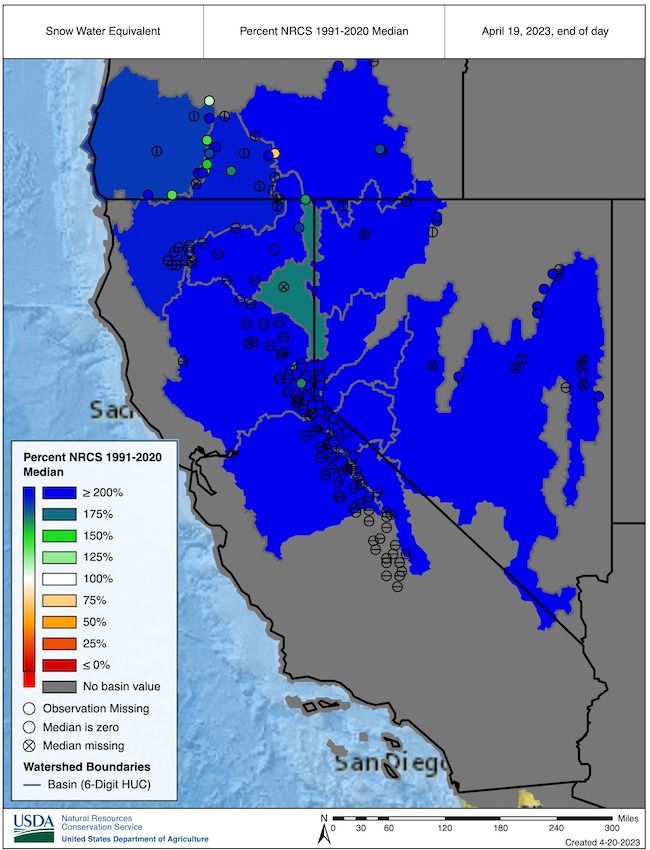
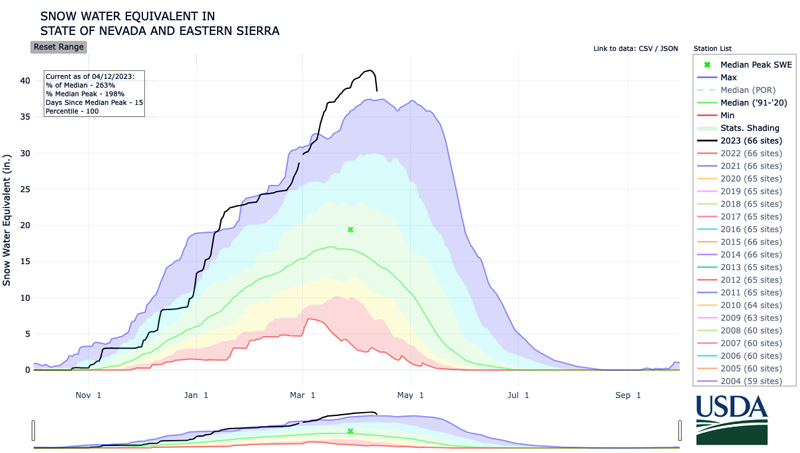
- Snowpack is still above 200% of normal for this time of year as a result of a wet, cold winter and early spring. Concerns have turned towards flooding in the Central Valley from the record precipitation and snowmelt.
- An El Niño Watch has been issued favoring a start this summer and continuing into winter, with 62% confidence despite typically less accurate spring forecasts.
The U.S. Drought Monitor (USDM) is updated each Thursday to show the location and intensity of drought across the country. Drought categories show experts’ assessments of conditions related to dryness and drought including observations of how much water is available in streams, lakes, and soils compared to usual for the same time of year.
California/Nevada conditions as of April 18, 2023:
- 8.79% of California is experiencing Moderate (D1) to Exceptional (D4) Drought (0% in D3, 0% in D4)
- California population in drought: 743,141
- 22.93% of Nevada is experiencing Moderate (D1) to Exceptional (D4) Drought (0% in D3, 0% in D4)
- Nevada population in drought: 1,814,717
U.S. Drought Monitor Categories
Abnormally Dry (D0)
Abnormally Dry (D0) indicates a region that is going into or coming out of drought. View typical impacts by state.
Moderate Drought (D1)
Moderate Drought (D1) is the first of four drought categories (D1–D4), according to the U.S. Drought Monitor. View typical impacts by state.
Severe Drought (D2)
Severe Drought (D2) is the second of four drought categories (D1–D4), according to the U.S. Drought Monitor. View typical impacts by state.
Extreme Drought (D3)
Extreme Drought (D3) is the third of four drought categories (D1–D4), according to the U.S. Drought Monitor. View typical impacts by state.
Exceptional Drought (D4)
Exceptional Drought (D4) is the most intense drought category, according to the U.S. Drought Monitor. View typical impacts by state.
The U.S. Drought Monitor (USDM) is updated each Thursday to show the location and intensity of drought across the country. Drought categories show experts’ assessments of conditions related to dryness and drought including observations of how much water is available in streams, lakes, and soils compared to usual for the same time of year.
California/Nevada conditions as of April 18, 2023:
- 8.79% of California is experiencing Moderate (D1) to Exceptional (D4) Drought (0% in D3, 0% in D4)
- California population in drought: 743,141
- 22.93% of Nevada is experiencing Moderate (D1) to Exceptional (D4) Drought (0% in D3, 0% in D4)
- Nevada population in drought: 1,814,717
Current Conditions
- According to the U.S. Drought Monitor, there is no extreme (D3) or exceptional drought (D4) in California-Nevada, and only 1.14% of the region, in Clark County, is in severe drought (D2). California has not seen D1/D0 only conditions since March 2020.
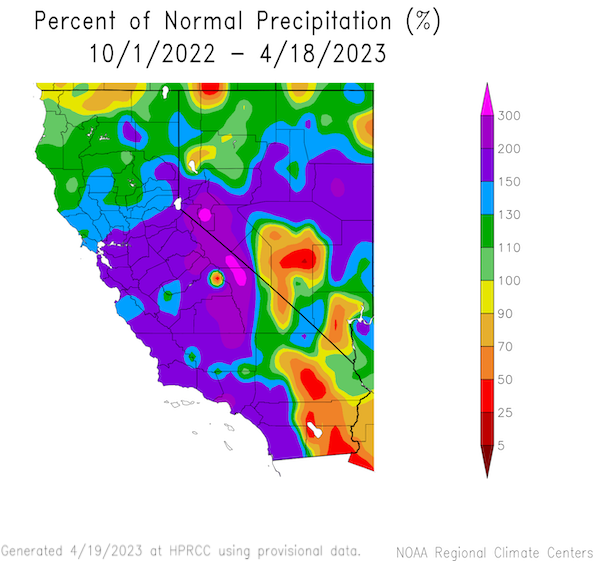
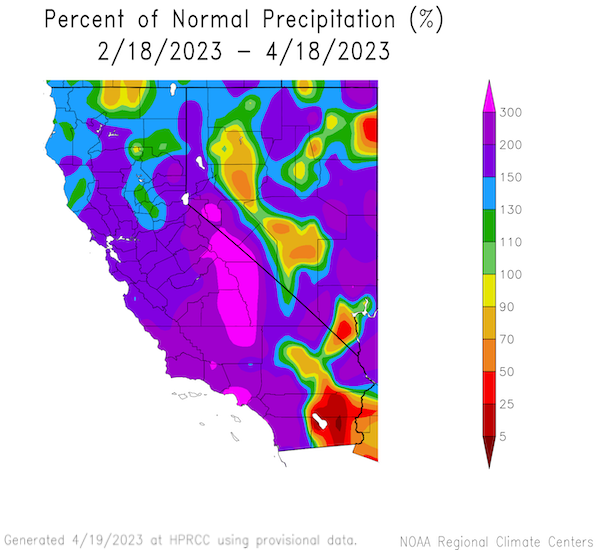
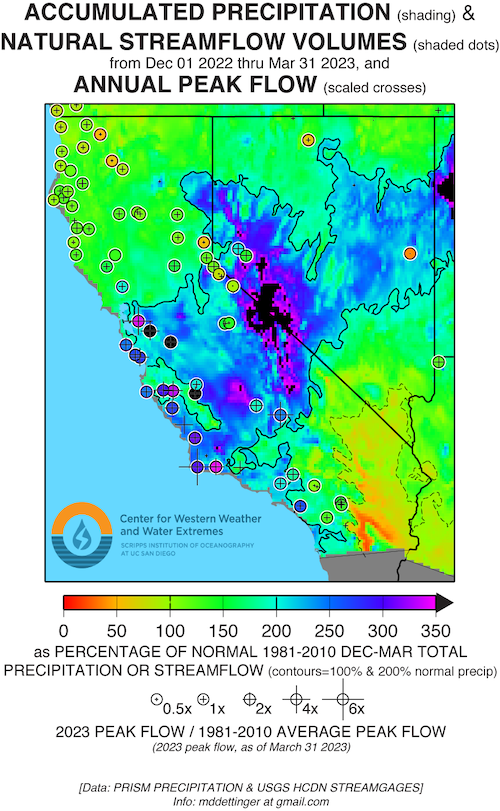
- California has experienced 31 atmospheric rivers (ARs) in Water Year (WY) 2023 through March, based on CW3E analysis, which have delivered between 1.5 to 2 water years' worth of precipitation in much of the state. These ARs have penetrated into Nevada, providing normal or much above normal precipitation for the northern two-thirds of the state.
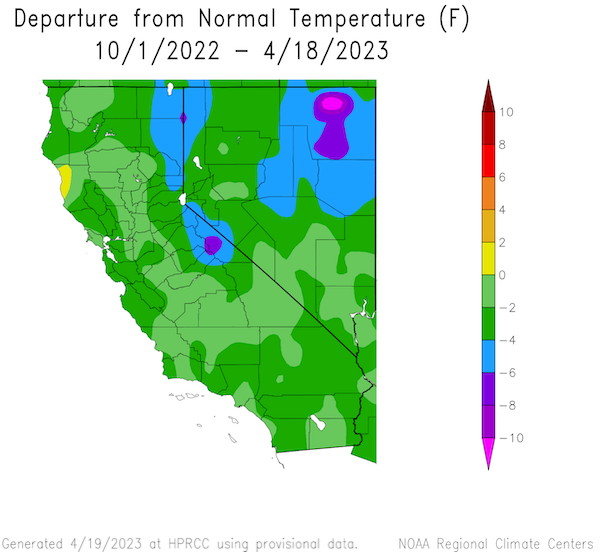
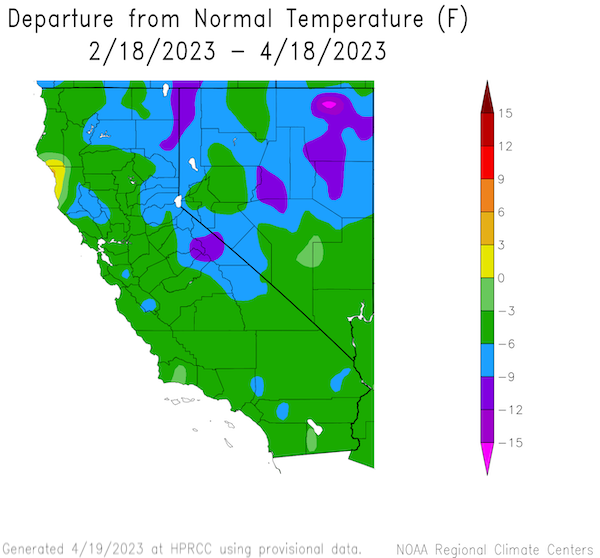
- The region has been extremely cool this WY, and in particular, much of the region in the last three months experienced temperatures 3–9 degrees below normal. This has helped to maintain the snowpack.
- Snowpack remains well above normal for this time of year—over 200% of normal in many parts of the region. Snowmelt is now underway as seen in satellite imagery.
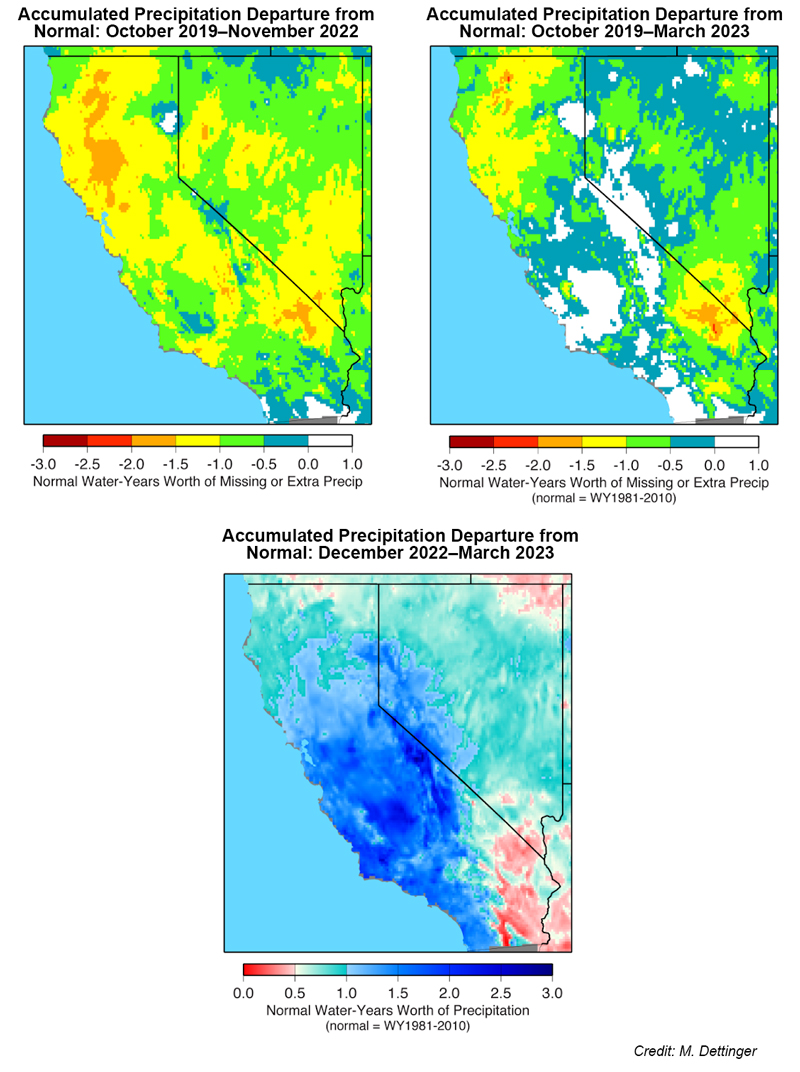
- The precipitation from December to March has alleviated much of the precipitation deficit in the California central and south coast region.
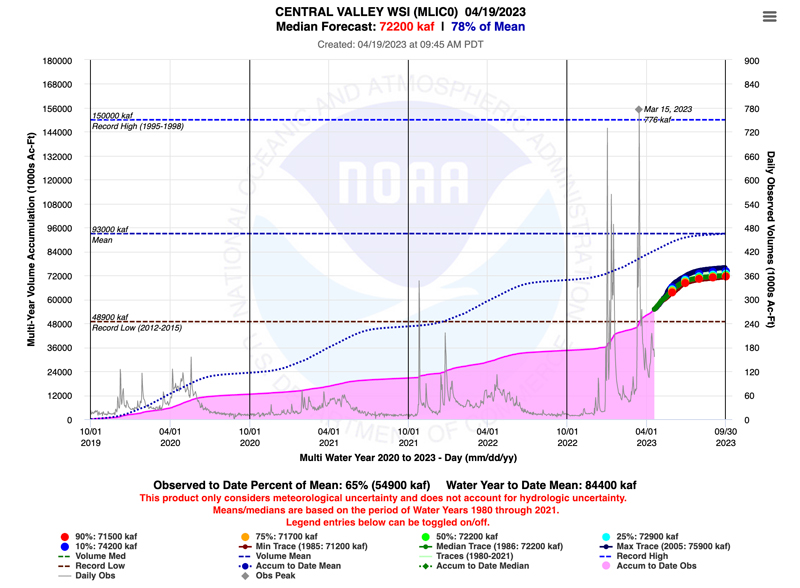
- The accumulated runoff for the San Joaquin Basin is still forecasted to be below the mean over the WY 2020–2023.
- Storage levels in many of California reservoirs are near the historical average for this time of year with Oroville and Shasta, the state’s two largest reservoirs, above the average. Lake Shasta has reached water levels not seen since 2019, which benefits hydropower generation.
- Given this winter’s severe winter storms, on April 3 President Biden on April 3 approved a California Disaster Declaration, making funding available to affected individuals in Kern, Mariposa, Monterey, San Benito, Sata Cruz, Tulare, and Tuolumne counties.
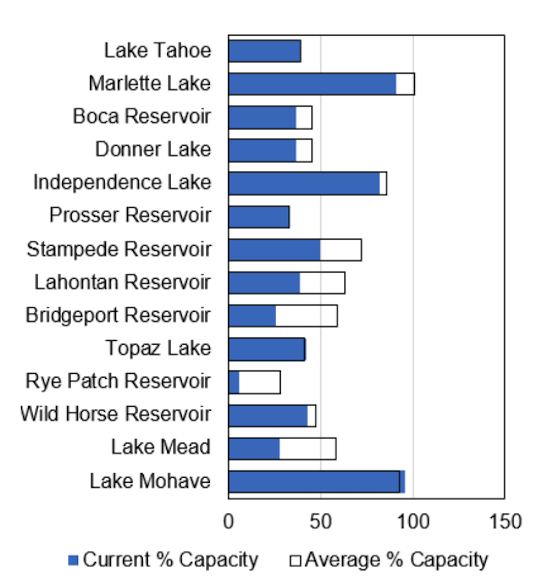
- In Nevada, reservoirs are at 35% of capacity, which is 77% of the median. Lake Tahoe is above the rim and at 39% of capacity, which is 100% of the median capacity for this time of year.
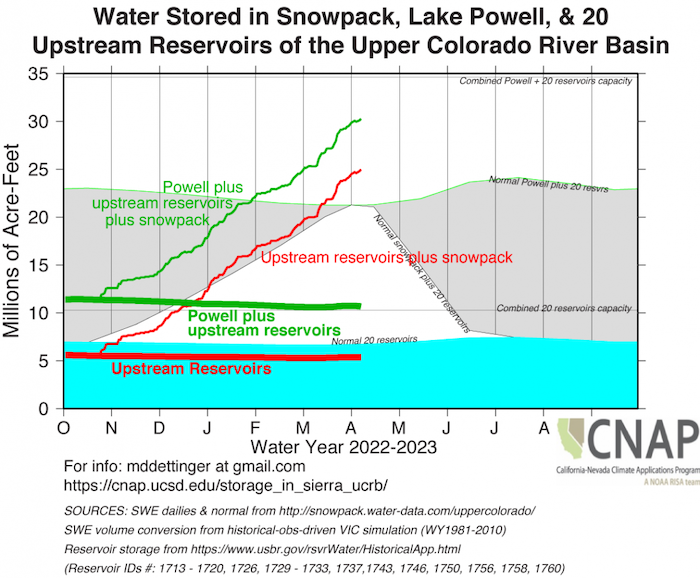
- In the Upper Colorado, the combined snowpack and storage of the 20 upstream reservoirs of Lake Powell is above normal for this time of year. The U.S. Bureau of Reclamation had released a draft Supplemental Environmental Impact Statement for Near-term Colorado River Operations with public comment open for 45 days.
- Long-term drought impacts remain. Dry wells continue to be reported in the Central Valley. Groundwater may not have fully recovered from the 2012–2016 drought before the start of the most recent drought, and the ability to recharge is yet to be seen. Recently, a west coast ban on salmon fishing was approved in part due to long-term drought. On April 13, The U.S. Bureau of Reclamation announced the 2023 Klamath Project water supply allocations, as well as a $13 million for drought resiliency, ecosystem enhancement, and groundwater monitoring in the Klamath Basin.
- For more information, check out Living with Drought in Nevada and the California Water Watch.
How is drought affecting your neighborhood? Click to see drought indicators, outlooks, and historical conditions by city, county, and state, as well as sign up for alerts.
View local drought information
U.S. Drought Monitor Water Year 2023 Change Map
Percent of Normal Precipitation: Water Year and Last 60 Days
Departure from Normal Temperature: Water Year and Last 60 Days
Snow Water Equivalent (SWE)
Accumulated Precipitation and Streamflow: December 2022–March 2023
Accumulated Precipitation Deficits for California-Nevada
Snow Water Equivalent in Nevada and the Eastern Sierra
Central Valley Water Resources Index: Streamflow
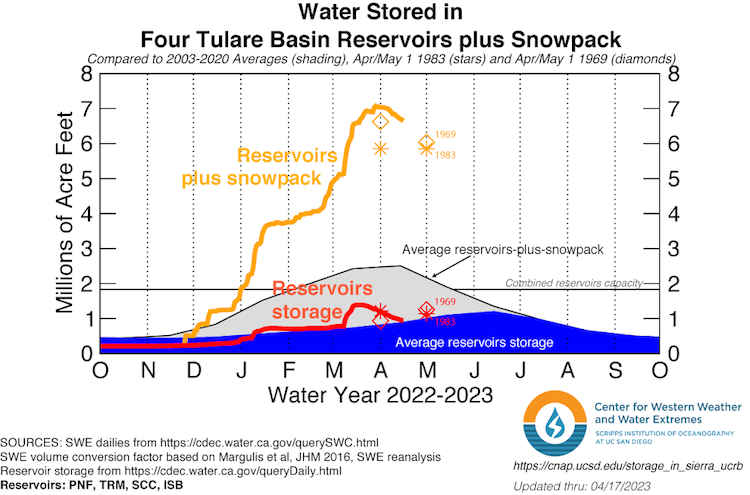
Water Storage + Snowpack in the Tulare Basin
Nevada Reservoir Storage
Upper Colorado River Basin Water Storage
Drought & Climate Outlook
El Niño–Southern Oscillation (ENSO)
NOAA’s ENSO alert system status is currently an El Niño Watch. ENSO-neutral conditions are forecasted to continue during the spring. In May–July 2023, there is a 62% chance of El Niño conditions developing. For more information, check out the NOAA ENSO blog or current status presentation.
Subseasonal to Seasonal Drought, Temperature, Precipitation, and Fire Outlooks
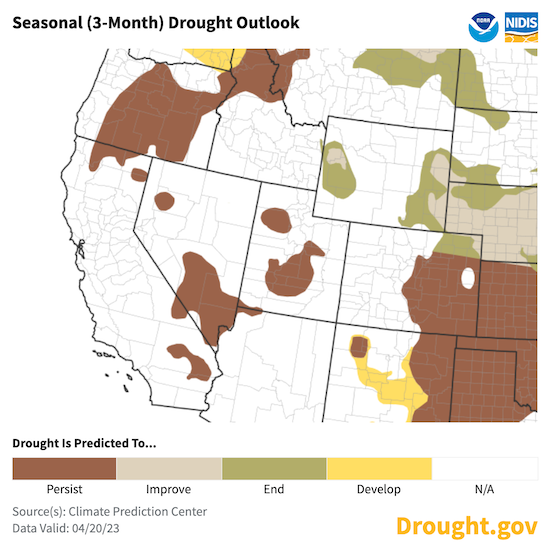
The May temperature and precipitation outlooks from the National Weather Service's Climate Prediction Center predict that California-Nevada will have primarily below-normal temperatures and equal chances of above-normal, normal, and below-normal precipitation. Subsequently, the seasonal forecast (May-June-July) shows equal chances in both temperature and precipitation. Given this, the next three-month drought outlook shows remaining drought persisting. Current fire outlooks from the National Interagency Fire Center (NIFC), given current and forecasted conditions, show normal to below-normal fire potential in California-Nevada through July.
Drought Outlook for April 20–July 31
May 2023 Temperature and Precipitation Outlooks
Drought Early Warning Resources
Prepared By
Amanda Sheffield
NOAA/NIDIS California-Nevada DEWS Regional Drought Information Coordinator, Cooperative Institute for Research in Environmental Sciences (CIRES)
Julie Kalansky
Program Manager, California-Nevada Adaptation Program (A NOAA CAP/RISA team)
This drought status update is issued in partnership between the National Oceanic and Atmospheric Administration (NOAA), the California-Nevada Adaptation Program (a NOAA CAP/RISA team), and the Western Regional Climate Center at the Desert Research Institute to communicate the current state of drought conditions in California-Nevada based on recent conditions and the upcoming forecast. NIDIS and its partners will issue future drought status updates as conditions evolve.
