California-Nevada Grapples with Third Year of Drought as Wet Season Ends
Register here for the June 2 Drought Update and Wildfire Outlook Webinar for California and the Southwest.
Key Points
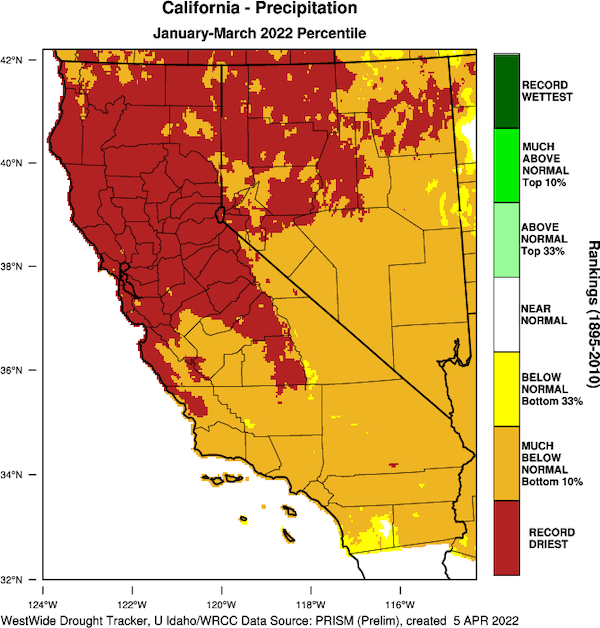
- January through March 2022 was the driest on record for these three months for much of California and Nevada. The dry end of the wet season leaves California and parts of Nevada in a third year of drought—with drought conditions worse in California than a year ago according to the U.S. Drought Monitor.
- Since October 2019, the beginning of the current drought, much of the region is missing over half a year's worth of normal precipitation. Some locations are missing as much as 1.25–1.75 years’ worth of precipitation.
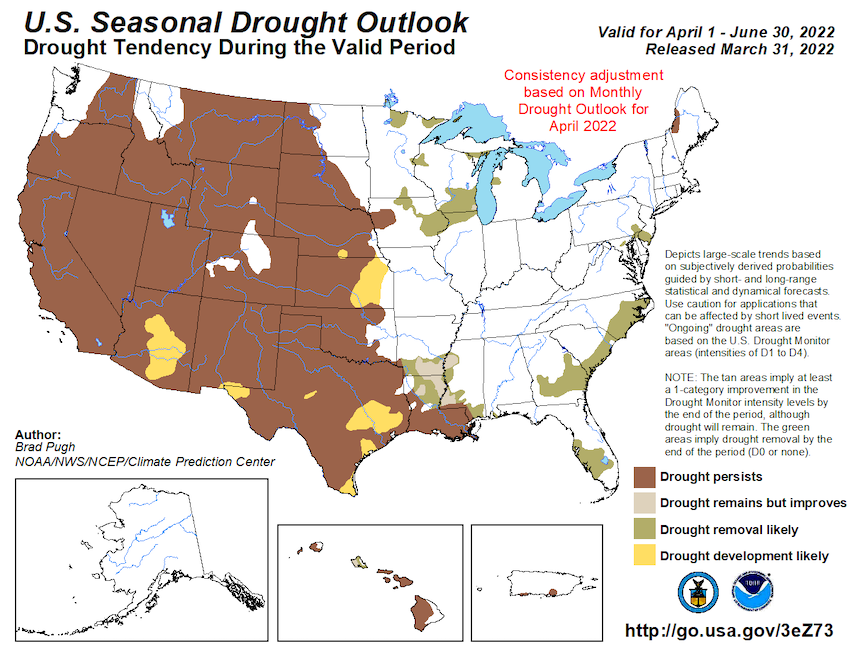
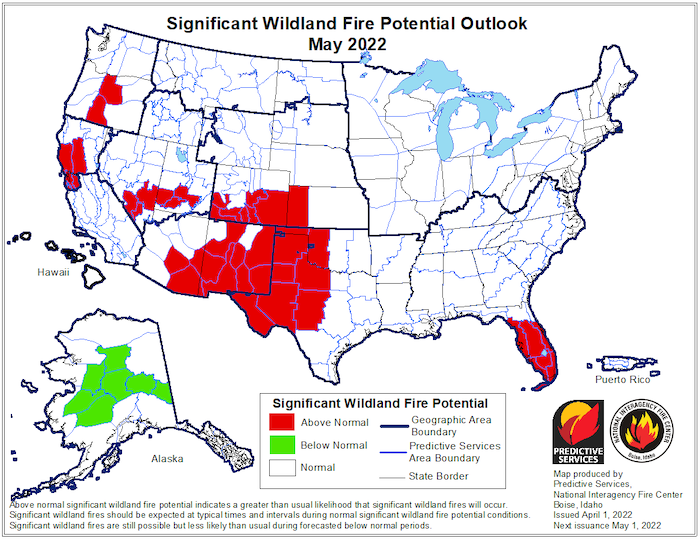
- In NOAA’s spring outlook, for the second year in a row forecasters predict prolonged, persistent drought in the West, including California and Nevada. Significant wildland fire potential is forecasted for parts of the region starting in May.
- Drought impacts will continue to intensify and expand given a third dry year. Applying lessons learned from past droughts and drought preparedness are key.
The U.S. Drought Monitor (USDM) is updated each Thursday to show the location and intensity of drought across the country. Drought categories show experts’ assessments of conditions related to dryness and drought including observations of how much water is available in streams, lakes, and soils compared to usual for the same time of year.
California/Nevada conditions as of April 5, 2022:
- 100% of California is experiencing Moderate (D1) to Exceptional (D4) Drought (40.67% in D3, 0% in D4)
- California population in drought: 37,223,956
- 100% of Nevada is experiencing Moderate (D1) to Exceptional (D4) Drought (32.57% in D3, 7.5% in D4)
- Nevada population in drought: 2,700,551
U.S. Drought Monitor Categories
The U.S. Drought Monitor (USDM) is updated each Thursday to show the location and intensity of drought across the country. Drought categories show experts’ assessments of conditions related to dryness and drought including observations of how much water is available in streams, lakes, and soils compared to usual for the same time of year.
California/Nevada conditions as of April 5, 2022:
- 100% of California is experiencing Moderate (D1) to Exceptional (D4) Drought (40.67% in D3, 0% in D4)
- California population in drought: 37,223,956
- 100% of Nevada is experiencing Moderate (D1) to Exceptional (D4) Drought (32.57% in D3, 7.5% in D4)
- Nevada population in drought: 2,700,551
Current Conditions
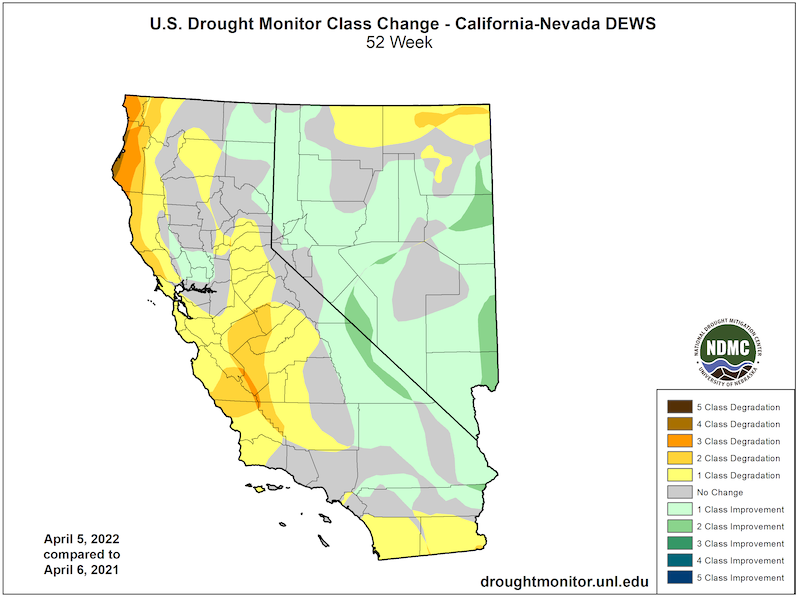
- The dry end of the wet season leaves California and Nevada in a third year of drought—with drought conditions worse in California than a year ago according to the U.S. Drought Monitor. The driest January through March on record for much of California and Nevada has reintensified drought, countering improvements made in late 2021.
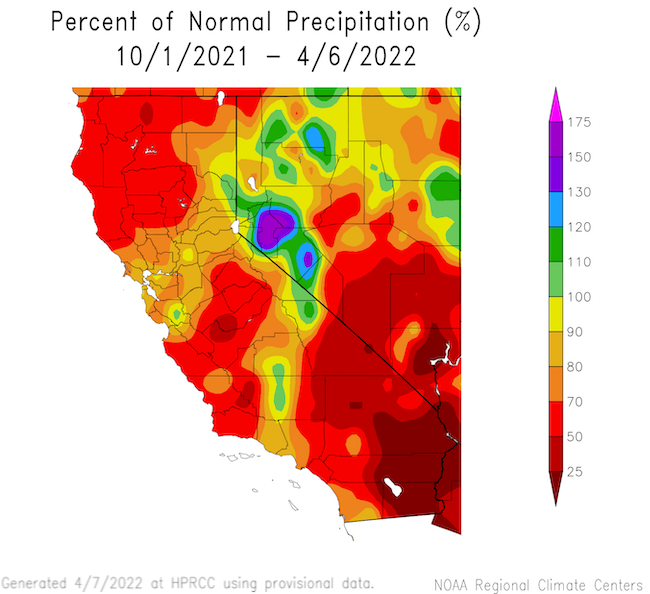
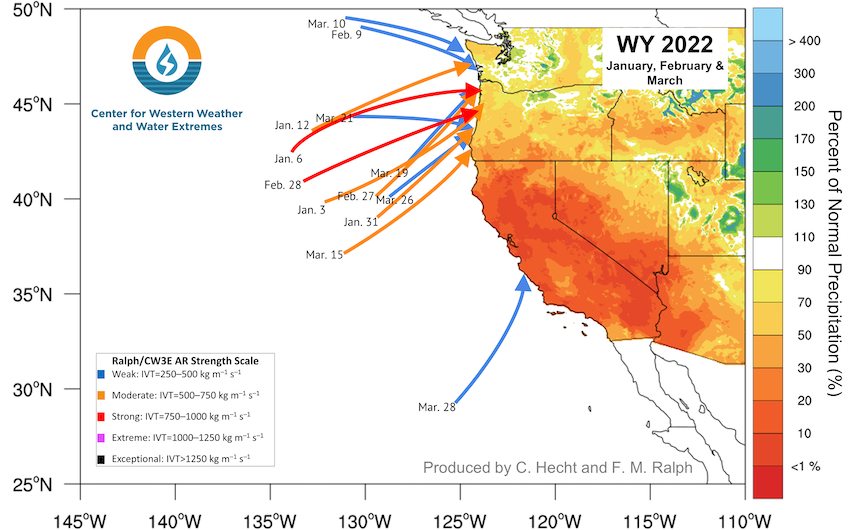
- Most of the region has received between 50%–90% of normal precipitation since the start of the water year (Oct. 1, 2021). The eastern side of the Sierra Nevada has received above-normal precipitation, while Southeastern California and Southern Nevada have received less than 50% of normal precipitation.
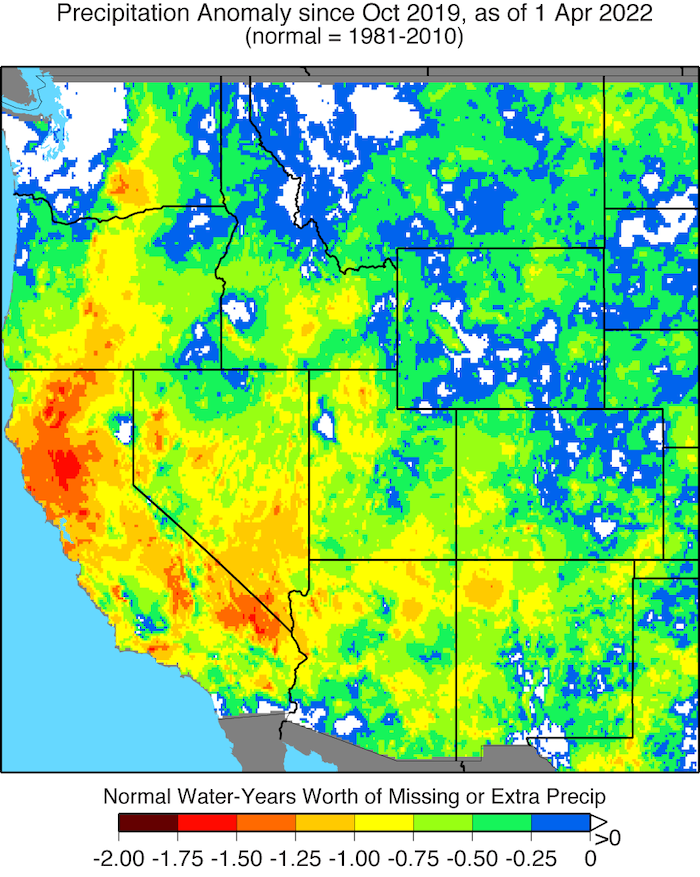
- Since October 2019, the beginning of the current drought, much of the region is missing over half a year's to a year’s worth of normal precipitation. Parts of Northern California and Southeastern California are missing between 1.25–1.75 years’ worth of precipitation.
- Whether a year is wet or dry in California and Nevada depends in large part on whether or not there are large storms, and especially their trajectory for Nevada. Only one weak atmospheric river made landfall along the California coasts between January and March, leading to the deepening of drought in the region.
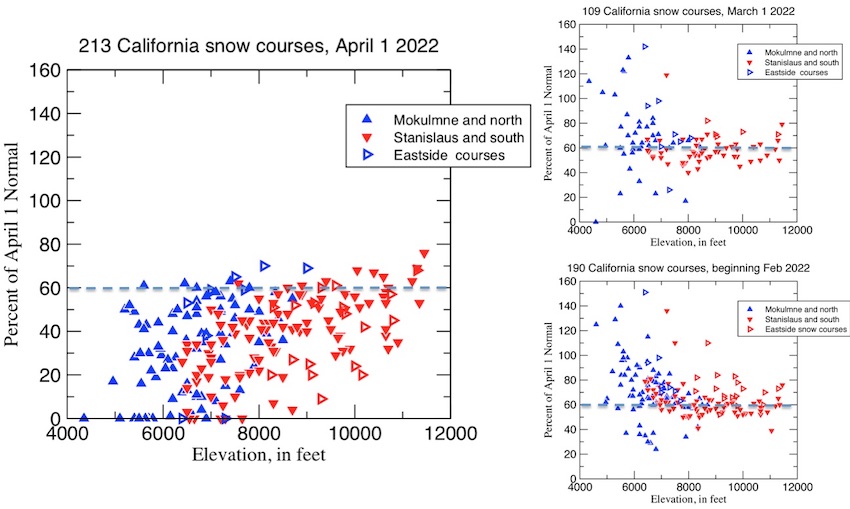
- Snow drought has continued to expand and intensify across the West, including California-Nevada. As of April 1, snow water equivalent (SWE) at almost all of the California snow course stations has decreased to below 60% of April 1 normal SWE with several at 0%. In Nevada, snow melt is 1.5 to 3.5 weeks ahead of the past two winters and a month ahead of normal in the Lake Tahoe, Truckee, Carson, and Walker basins.
- Recent high temperatures throughout the region have contributed to more rapid snowmelt.
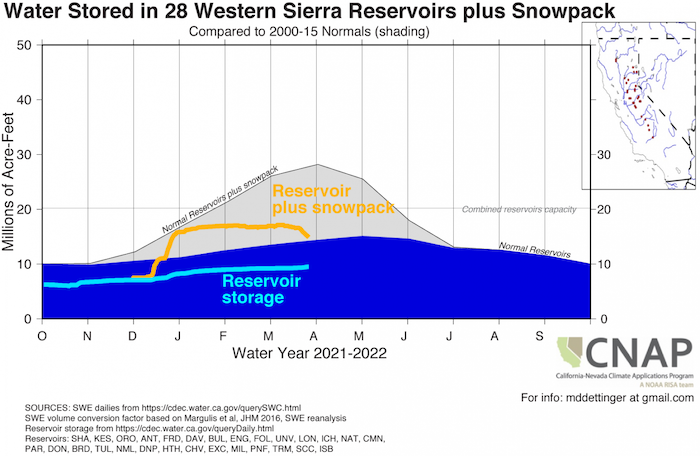
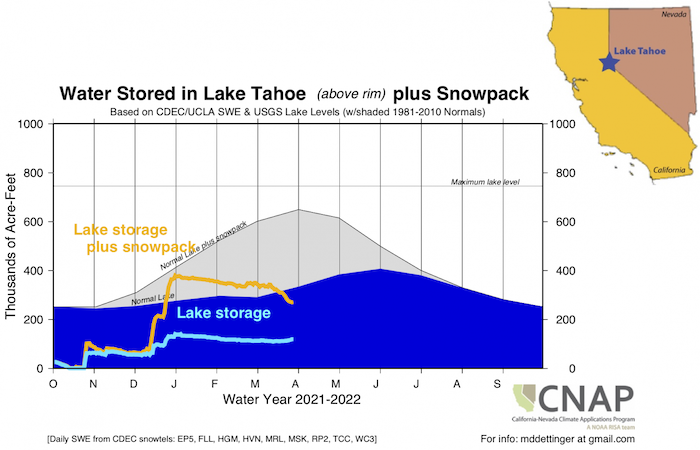
- Current water storage in the Western Sierras, represented here as reservoir plus snowpack, is about half of the normal snow plus reservoir storage for this time of year. Even though snow is melting, the inflow into several reservoirs remains low. For example, in the Lake Tahoe basin, snow melt has started, but the increase in lake level is minimal to date.
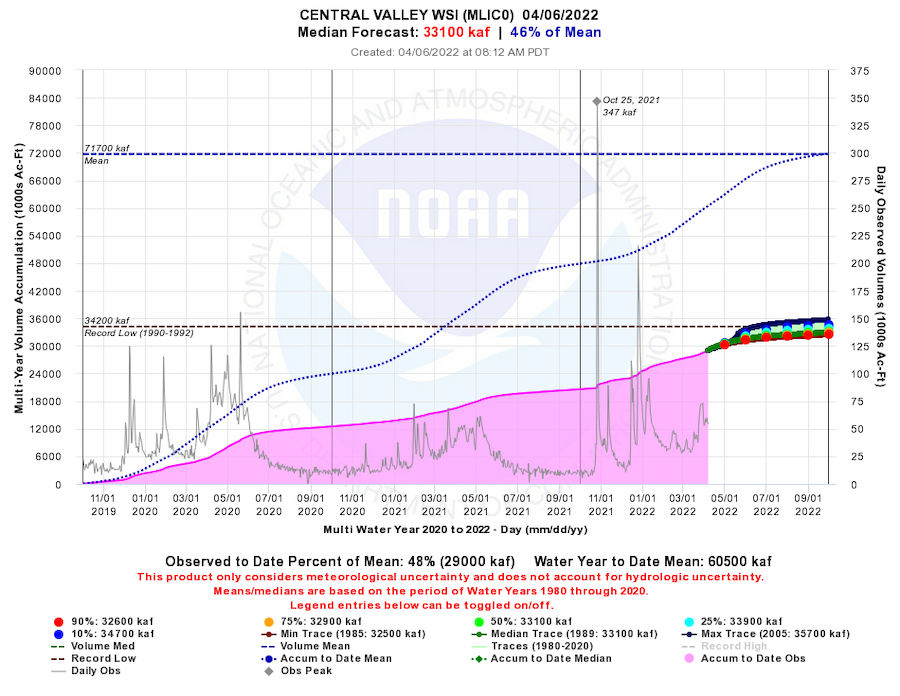
- The National Weather Service's California Nevada River Forecast Center is forecasting that the Central Valley Water Resource Index will be near a record low three-year accumulation total at the end of the water year.
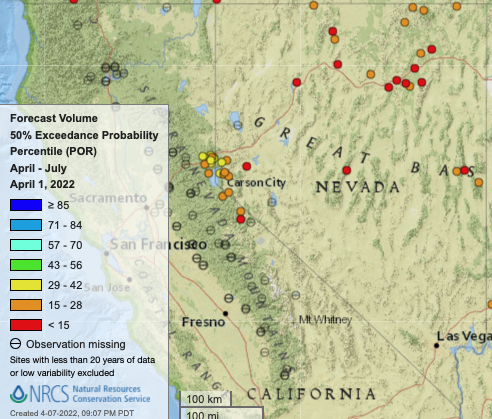
- Nevada April-July streamflow forecasts throughout much of Nevada are 30th percentile or lower.
- The Evaporative Demand Drought Index (EDDI)—or thirst of the atmosphere—and soil moisture continue to reflect drought in most of the region.
- Dead fuel moistures have generally remained at or near historical lows across northwestern, central, and southern California this spring. This, along with an early start to the fine fuel growing season and ongoing long-term drought, will create an early start to the main portion of the fire season.
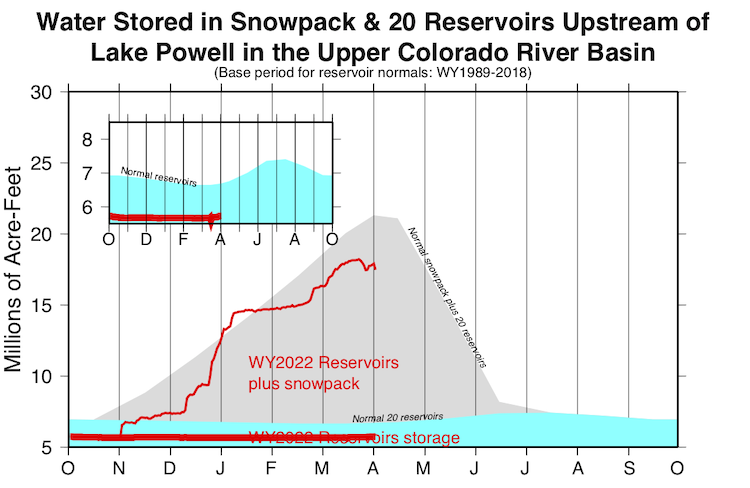
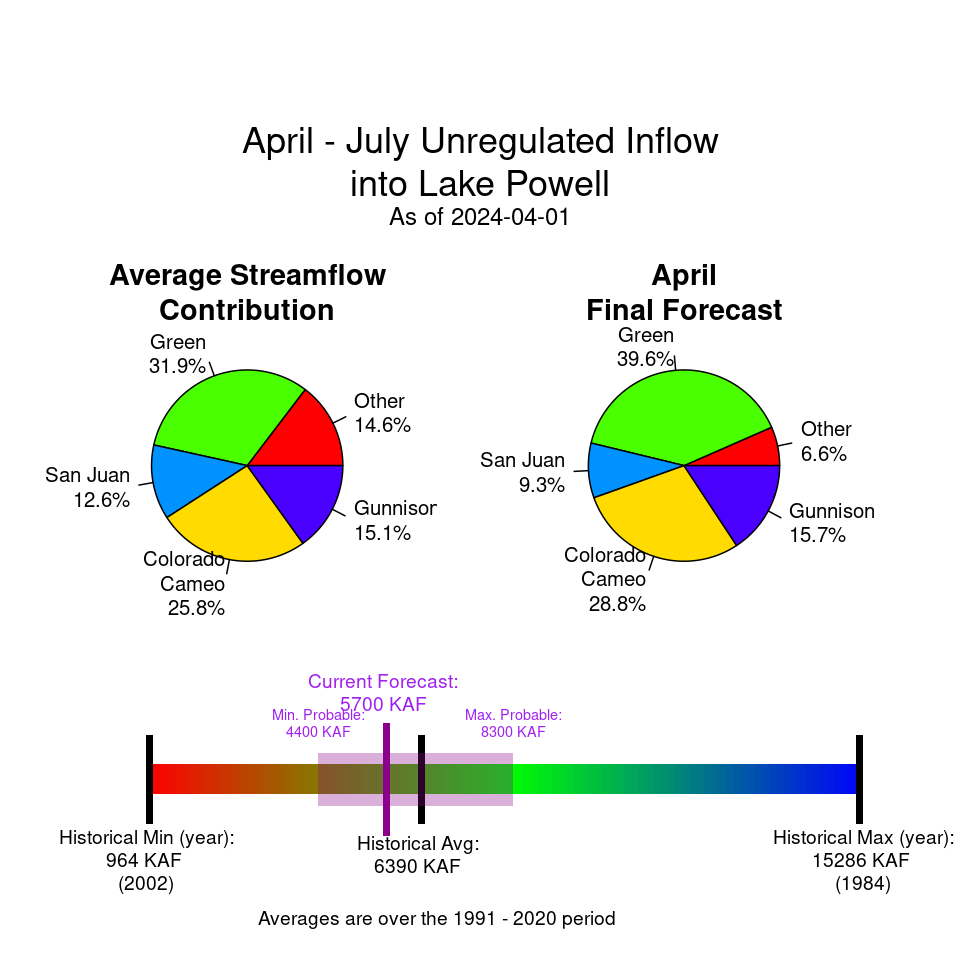
- The snow plus reservoir storage above Lake Powell in the Upper Colorado River Basin are 84% of normal for this time of year, although the National Weather Service's Colorado Basin River Forecast Center is only forecasting 3,100–6,500 KAF (near or below historical averages) of unregulated flow into Lake Powell now through July.
- For more information, check out Living with Drought in Nevada and the California Water Watch.
How is drought affecting your neighborhood? Click to see drought indicators, outlooks, and historical conditions by city, county, and state, as well as sign up for alerts.
U.S. Drought Monitor 52-Week Change Map
Percent of Normal Precipitation: Water Year 2022
Normal Water Years' Worth of Missing or Extra Precipitation
January–March 2022 Precipitation Percentile
Landfalling Atmospheric Rivers: January–March 2022
Water Storage + Snowpack for Western Sierra Nevada Reservoirs and Lake Tahoe
Snow Water Equivalent: Percent of April 1 Normal
Central Valley Water Resources Index
April–July Streamflow Forecast
Upper Colorado Reservoir Storage
Recent and Potential Drought Impacts
- Find additional impacts through the National Drought Mitigation Center’s Drought Impact Reporter.
- The economic impacts of the 2021 drought on California totaled an estimated $1.7 billion (UC Merced).
- At a NIDIS-hosted webinar, UC Cooperative Extension reported rangeland conditions across California of reduced foraged production, reduced streamflow, grasses maturing early (1–1.5 months), and some ranches selling/shipping livestock early.
- April 1: Due to critically dry hydrologic conditions, the U.S. Bureau of Reclamation updated water supply allocations for Central Valley Project municipal and industrial water service contractors. Effective April 1, water supply for all Central Valley Project M&I water service contractors will be reduced to Public Health and Safety.
- March 28: California Governor Newsom took steps to drive water conservation at the local level, calling on local water suppliers to move to Level 2 of their Water Shortage Contingency Plans and directing the State Water Resources Control Board to consider a ban on the watering of decorative grass at businesses and institutions.
- March 21: The California Department of Water Resources awarded $180 million to communities statewide for urban and multi-benefit drought relief projects.
- March 13: California Governor Gavin Newsom boosts state funding for drought emergency with additional $22.5 million.
- California recently proposed a $2.9 billion plan to pay farmers to reduce some of their planting in an effort to better manage water resources. The voluntary agreement negotiated between government officials and some of the state’s major water agencies, which was announced in late March, is also aimed at protecting salmon and other wildlife and ecosystems.
- Example Local Impacts:
- Los Angeles Department of Water and Power recently increased water conservation rebates.
- In March, Sonoma County Water Agency began the annual process of drawing from the Russian River weeks earlier than normal.
- The Fresno Irrigation District announced that it will conserve water by postponing the start of its water deliveries. No agricultural water deliveries will take place in March or April. The Merced Irrigation District will deliver water according to schedule, but less will be delivered, and the water will cost more than other years.
- The Bay Area commercial salmon season will start two months later than usual to protect fish stocks in Northern California, particularly Klamath River fall-run chinook salmon.
- Bear activity in the Truckee Meadows and Tahoe Basin is expected to be higher than normal given the drought.
California and Nevada are no strangers to drought. As the region enters its third year of drought, potential impacts reminiscent of the last multi-year drought are arising (See the California Department of Water Resources 2012–2016 Drought Overview [Table 1.2 and Chapter 4] and the 2015 Nevada Drought Forum). Through the remainder of the water year and beyond these impacts could include:
- Continued water supply issues, such as for small water systems and private wells. See the California Department of Water Resources (CA DWR) and Living with Drought in Nevada for resources.
- An early and active wildfire season, with an increased risk of catastrophic fires. See outlook information below, as well as how to Protect Yourself from Wildfire Smoke from the CDC.
- Intensifying impacts for both irrigated (e.g., fallowing fields, shorter irrigation seasons) and non-irrigated agriculture leading to increased economic impacts, including job losses.
- Public health effects, especially for at-risk and disadvantaged communities, such as from poor air quality, access to water and water quality, disease such as coccidioidomycosis (Valley Fever), and increased mental health stresses. Learn more here.
- Fish and wildlife impacts, such as on salmon. See how CA DWR is collaborating with partners to support the salmon population while supplying water.
- Drought compounding other stressors on ecosystems, such as leading to tree mortality. Read more via the U.S. Forest Service.
- Potential hydropower supply issues given reservoir levels, increasing reliance on alternative supplies that don’t align with greenhouse gas emission goals. See U.S. hydroelectric power plants in drought here.
Drought and Climate Outlook
El Niño–Southern Oscillation (ENSO)
NOAA’s ENSO alert system status is currently a La Niña Advisory. La Niña is favored to continue into the Northern Hemisphere summer (53% chance during June–August 2022), with a 40%–50% chance of La Niña or ENSO-neutral thereafter. For more information, please check out the NOAA ENSO blog.
Subseasonal to Seasonal Drought, Temperature, Precipitation, and Fire Outlooks
In NOAA’s spring outlook, for the second year in a row forecasters predict prolonged, persistent drought in the West, including California and Nevada, where below-average precipitation is most likely. The National Weather Service’s Climate Prediction Center is also forecasting above-average temperatures for most of the U.S. from the Desert Southwest to the East Coast and north through the Midwest to the Canadian border from April to June.
According to the National Interagency Fire Center, fire activity continued to increase in the Southwest, California, and across the plains of the Rocky Mountain area. Generally, periods of increased activity coincided with widespread dry and windy conditions.
Above-normal significant fire potential is forecast to increase across northern California from May into July, with rising potential likely along portions of the Sierra Front. In Southern California, significant fire potential will be near to a little below normal across the geographic area April through July. In the Great Basin, fire potential is expected to remain low (i.e., normal) through April but is expected to increase by May and June from south to north. This would be considered a normal progression at the onset of fire season. However, depending on the length of the warming and drying trend that is possible from late April through May, fire season may increase more quickly than normal or start earlier in the higher terrain over the southern half of the Great Basin. More details can be found here.
Seasonal Drought Outlook: April 1–June 30, 2022
Seasonal (3-Month) Temperature and Precipitation Outlooks
National Significant Wildland Fire Potential Outlook
Drought Early Warning Resources
Prepared By
Amanda Sheffield
California-Nevada DEWS Regional Drought Information Coordinator, NOAA/NIDIS, CIRES
Julie Kalansky
California Nevada Applications Program (CNAP), Scripps Institution of Oceanography
This drought status update is issued in partnership between the National Oceanic and Atmospheric Administration (NOAA), the California-Nevada Applications Program, a NOAA RISA team, and the Western Regional Climate Center at the Desert Research Institute to communicate the current state of drought conditions in California-Nevada based on recent conditions and the upcoming forecast. NIDIS and its partners will issue future drought status updates as conditions evolve.