Snow Drought Hits Most of the West for the Second Straight Year and California for the Third Straight Year
Key Points
- Snow drought conditions remain widespread across the West and have generally become more severe over the past month.
- A lack of precipitation was one of the main drivers, with March bringing only about 25%–50% of normal precipitation to the Sierra Nevada, northwestern California, southern and eastern Oregon, and the Great Basin.
- Except at the highest elevations, the start of April typically is associated with peak snowpack and the start of the snowmelt season, making recovery from snow drought difficult if not impossible at this point in the water year.
Snow Telemetry (SNOTEL) snow water equivalent (SWE) values for watersheds in the western U.S. as a percent of the USDA Natural Resources Conservation Service (NRCS) 1991–2020 median. Only stations with at least 20 years of data are included in the station averages.
The SWE percent of normal represents the current SWE at selected SNOTEL stations in or near the basin compared to the average value for those stations on this day. This map is valid as of April 4, 2022.
For an interactive version of this map, please visit NRCS.
Snow Telemetry (SNOTEL) snow water equivalent (SWE) values in watersheds in Alaska as a percent of the USDA Natural Resources Conservation Service (NRCS) 1991–2020 median. Only stations with at least 20 years of data are included in the station averages.
The SWE percent of normal represents the current SWE at selected SNOTEL stations and Snow Course sites in or near the basin compared to the average value for those sites on this day. This map is valid as of the end of March 2022.
For an interactive version of this map, please visit NRCS.
SWE Percent of NRCS 1991-2020 Median
Snow Telemetry (SNOTEL) snow water equivalent (SWE) values for watersheds in the western U.S. as a percent of the USDA Natural Resources Conservation Service (NRCS) 1991–2020 median. Only stations with at least 20 years of data are included in the station averages.
The SWE percent of normal represents the current SWE at selected SNOTEL stations in or near the basin compared to the average value for those stations on this day. This map is valid as of April 4, 2022.
For an interactive version of this map, please visit NRCS.
Snow Telemetry (SNOTEL) snow water equivalent (SWE) values in watersheds in Alaska as a percent of the USDA Natural Resources Conservation Service (NRCS) 1991–2020 median. Only stations with at least 20 years of data are included in the station averages.
The SWE percent of normal represents the current SWE at selected SNOTEL stations and Snow Course sites in or near the basin compared to the average value for those sites on this day. This map is valid as of the end of March 2022.
For an interactive version of this map, please visit NRCS.
Snow Drought Update for April 7, 2022
Snow drought conditions remain widespread across the West and have generally become more severe over the past month. Snow drought currently is most extreme in the Sierra Nevada, northwestern California, southern and eastern Oregon, and the Great Basin, where snow water equivalent (SWE) currently is around 30%–60% of median. SWE in the Rocky Mountains in Wyoming, southwestern Montana, and southeastern Idaho is currently around 65%–80% of median. SWE at many stations in the region is below the 10th percentile, and several stations are at record low SWE for this date. SWE in the Cascade Range in northern Oregon and Washington is below normal (75%–90% of median). The Upper Colorado River Basin is 86% of the median. However, SWE in the basin is not distributed evenly. SWE in the northwestern basin in Utah and Wyoming is well below normal, whereas SWE in the San Juan Mountains in the southeastern basin is closer to normal. Except at the highest elevations, the start of April is typically associated with peak snowpack and the start of the snowmelt season, making recovery from snow drought difficult if not impossible at this point in the year. In Oregon, in the majority of the major basins, snow drought will be characterized by well below normal SWE combined with very early melt-out.
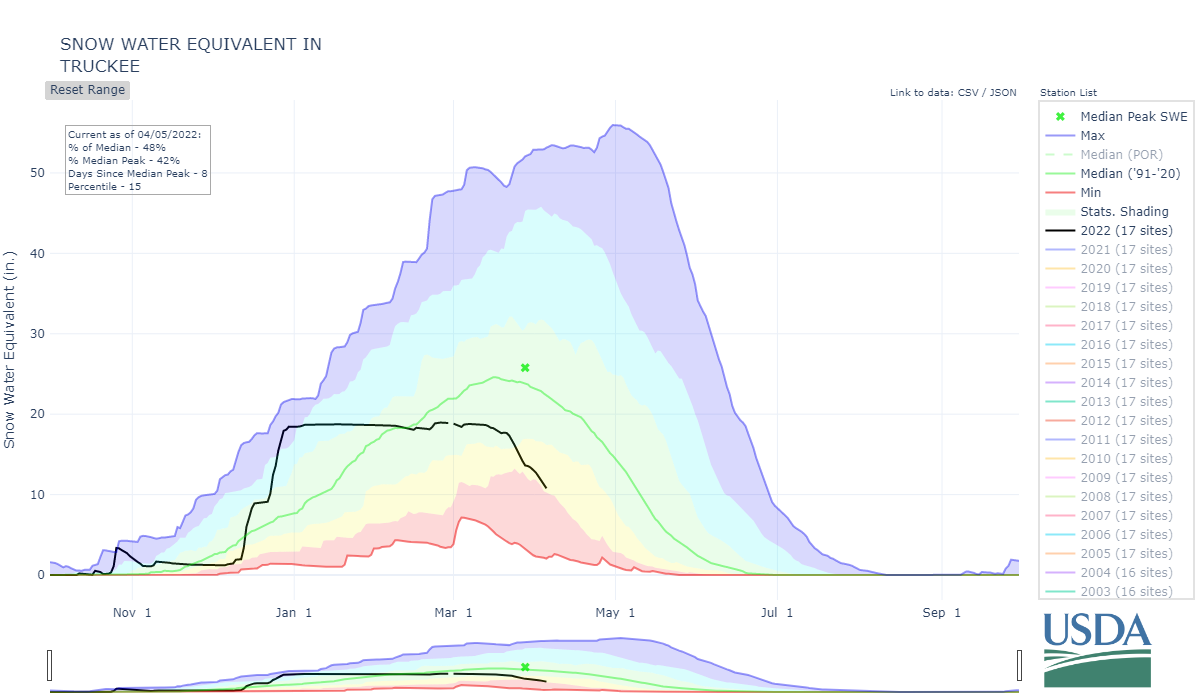
A lack of precipitation was one of the main drivers of the current snow drought. March precipitation was only about 25%–50% of normal in the Sierra Nevada, northwestern California, southern and eastern Oregon, and the Great Basin. This continued the trend of a dry calendar year and January–March cumulative precipitation at many SNOTEL sites in this region was record low. A prolonged heat wave across the West, but centered over California from March 22–27 accelerated early snowmelt and intensified snow drought conditions. For example, SWE in the Truckee River Basin, which drains Lake Tahoe and provides water to over a half million people, lost nearly six inches from March 22–27, and currently is just 48% of median.
Relative snow levels in Alaska are much better off than CONUS. Of the 149 sites reporting for the April 1 snow survey (SNOTEL and snow courses), only 9 were below 100% of median SWE, and only two were below 80% of median. This was one of the snowiest winters on record for parts of Alaska. 49 sites had record high April 1 SWE; these sites were concentrated in the Tanana River, Copper River, and Susitna River HUC6 basins. Tok Junction, in the Tanana River Basin, reported 8.8 inches of SWE on April 1 (259% of median), which was the highest since 1960 and shattered the previous high of 6 inches set in 1967.
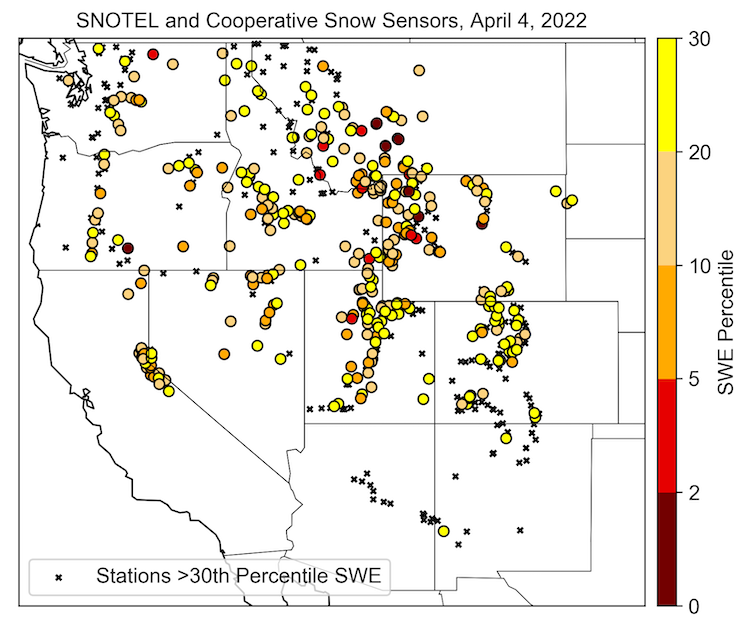
Stations with SWE Below the 30th Percentile
Water Year Accumulated Snow Water Equivalent in the Truckee Basin
* Quantifying snow drought values is an ongoing research effort. Here we have used the 30th percentile as a starting point based on partner expertise. Get more information on the current definition of snow drought here.
For More Information, Please Contact:
Daniel McEvoy
Western Regional Climate Center
Daniel.McEvoy@dri.edu
Amanda Sheffield
NOAA/NIDIS California-Nevada Regional Drought Information Coordinator
Amanda.Sheffield@noaa.gov
Britt Parker
NOAA/NIDIS Pacific Northwest and Missouri River Basin Regional Drought Information Coordinator
Britt.Parker@noaa.gov
NIDIS and its partners launched this snow drought effort in 2018 to provide data, maps, and tools for monitoring snow drought and its impacts as well as communicating the status of snow drought across the United States, including Alaska. Thank you to our partners for your continued support of this effort and review of these updates. If you would like to report snow drought impacts, please use the link below. Information collected will be shared with the states affected to help us better understand the short term, long term, and cumulative impacts of snow drought to the citizens and the economy of the regions reliant on snowpack.
Report Your Snow Drought Impacts Data and Maps | Snow Drought Research and Learn | Snow Drought

