Drought Conditions Continue To Expand and Worsen Across Southeast Region, Especially in the Carolinas.
Key Points
- Despite significant rainfall over the summer, precipitation this fall was much below normal for much of the region. This continued lack of precipitation is leading to soil moisture deficits and low streamflows, even as we enter the climatological winter.
- Based on the U.S. Drought Monitor released on December 9, drought remains and currently covers 26% of the region, with 13% in severe drought (D2). These drought areas are currently in Georgia, South Carolina, North Carolina, and Virginia, with the Carolinas most impacted. Abnormally dry conditions (D0) cover 41% of the region, and are found in the above states as well as Alabama and the Florida Panhandle.
- Current impacts include observed low streamflow and reduced soil moisture. Fortunately, drought impacts are less pronounced this time of year because water demand is lower this time of year for vegetation use, irrigation of agriculture and lawns, and other uses. Also, climatologically, the October/November time period is one of the drier times of the year across most of the region.
- One concern is the potential for moisture deficits across portions of the region heading into the next growing season and the cold season recharge for reservoirs.
- Except for northern portions of Alabama, no appreciable rainfall is expected over the next week. Week 2 will more likely than not see above-average rainfall over most of the region, except for Florida and southeast Georgia, where rainfall should remain sparse.
- The winter outlook (December 2021–February 2022) shows a higher chance for below-normal precipitation and above-normal temperatures across much of the Southeast region, which is typical of the existing La Niña pattern.
- Wildfire threats have increased due to low humidity and dry fuel loads. There are reports that winter wheat is being irrigated in the Pee Dee region of South Carolina, which is highly unusual. Some water systems are considering or implementing conservation practices. South Carolina has declared ‘incipient’ drought conditions in 34 counties, and North Carolina issued a Drought Advisory.
Current U.S. Drought Monitor map for the Southeast, as of December 7, 2021. The U.S. Drought Monitor (USDM) is updated each Thursday to show the location and intensity of drought across the country. Drought categories show experts’ assessments of conditions related to dryness and drought including observations of how much water is available in streams, lakes, and soils compared to usual for the same time of year.
U.S. Drought Monitor Categories
Current U.S. Drought Monitor map for the Southeast, as of December 7, 2021. The U.S. Drought Monitor (USDM) is updated each Thursday to show the location and intensity of drought across the country. Drought categories show experts’ assessments of conditions related to dryness and drought including observations of how much water is available in streams, lakes, and soils compared to usual for the same time of year.
Current Conditions
- After a very wet first half of the year and summer, precipitation this fall declined dramatically, in line with the rapid decrease in tropical cyclone activity in the Atlantic Basin. At the end of September, only 2% of the region was considered to be abnormally dry (D0). Precipitation totals less than 50% of normal across nearly the entire region (except for Florida) in October and November have ramped up drought conditions across the Southeast. Based on the U.S. Drought Monitor, 26% of the region now has moderate or severe drought (D1, D2), with 41% of the region classified as abnormally dry (Figure 1).
- Oddly, Florida has escaped the drought conditions thus far, with above-normal rainfall in October and November. However, the ongoing La Niña conditions have a strong correlation with dryness across Florida during the winter and spring months. As a result, the winter outlook shows a strong tilt for below-normal rainfall across Florida. In time, drought conditions are expected to spread into Florida by the first of the year.
- Over the past 90 days, the driest parts of the region have been eastern North Carolina, and the area around Charlotte, NC and the adjacent South Carolina border counties. Figure 2 shows the 90-day observed rainfall across the Carolinas. The lightest shade of green represents the driest totals, with only 2–4 inches. Some of the driest totals for the 90-day period from September 13 to December 12 include only 3.40 inches at Gastonia, NC, 3.40 inches at York, SC, and 3.55 inches at Lincolnton, NC. For example, the 4.01 inches at Charlotte, NC in the past 90 days is only 40% of normal and the 4th driest such period in over 130 years of data. All of these values are between 30% and 40% of normal, and are the driest such period at all locations since at least 2012.
Figure 1. 12-Week Change Map for the U.S. Drought Monitor
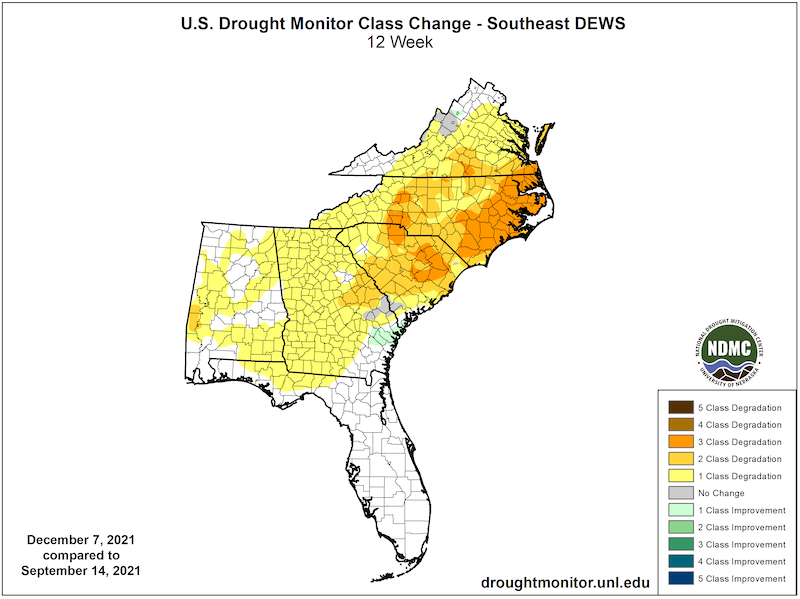
Figure 2. 90-day Observed Rainfall Across the Carolinas (December 12)
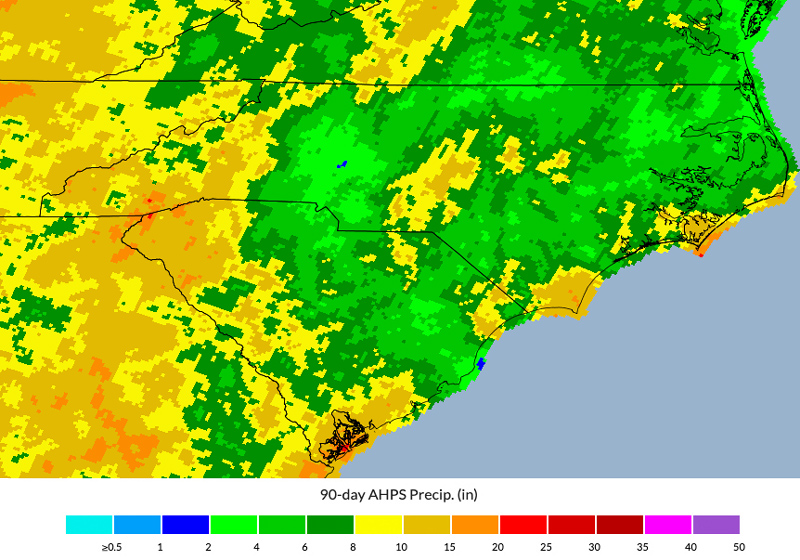
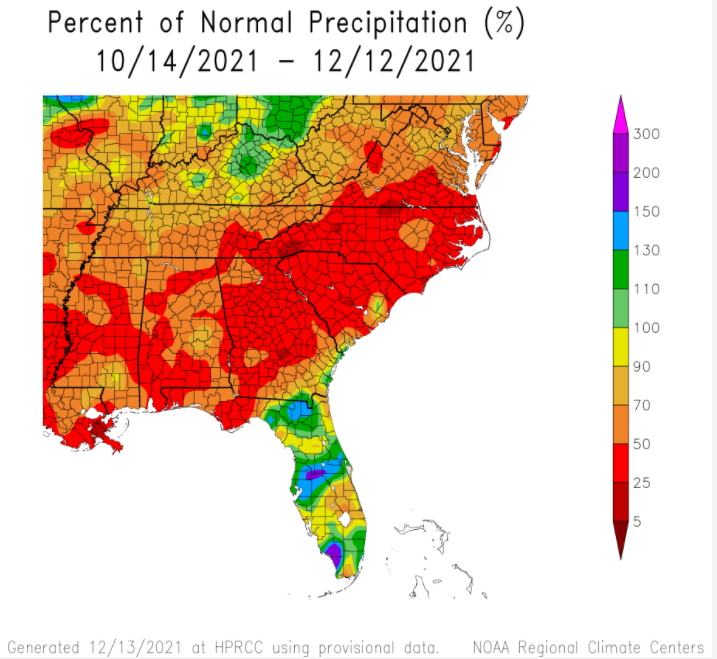
Figure 3. 60-Day Percent of Normal Precipitation (%) (October 14–December 12, 2021)
Impacts
- Surface streamflow is below to much-below normal across most of North Carolina and South Carolina, with most streamflows below the historical 25th percentile for this time of year across the area and some locations in the bottom 10% (Figure 4).
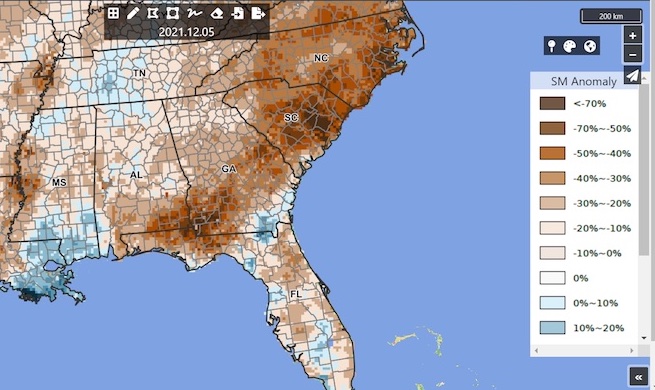
- The concern with the current impacts of low streamflow and reduced soil moisture (Figure 5) in some areas is the potential for issues next growing season. If winter does not bring enough precipitation to recharge the streams and soils, portions of the region could begin the next growing season with moisture deficits. Similarly, the recharge of reservoirs during the cold season must be monitored.
- Ongoing dry conditions in South Carolina have led to higher-than-normal wildfires across the entire state, with the number of wildfires in November almost twice the 10-year average. On December 9, the South Carolina Drought Response Committee upgraded the drought status to Incipient Drought for 34 South Carolina counties. As designated by the South Carolina Drought Response Act, Incipient is the first level of drought, followed by Moderate, Severe, and Extreme. The concern over wildfires was the primary driving factor leading to the drought declaration.
Figure 4. U.S. Geological Survey Streamflow Percentiles - December 8, 2021
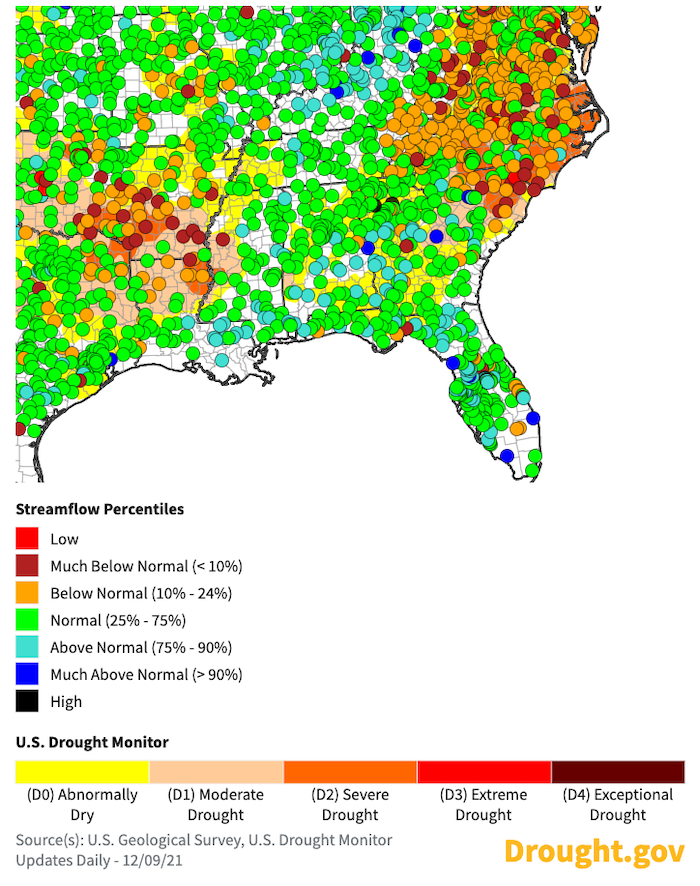
Figure 5. CROP-CASMA (Crop Condition and Soil Moisture Analytics) (December 5, 2021)
Outlook and Potential Impacts
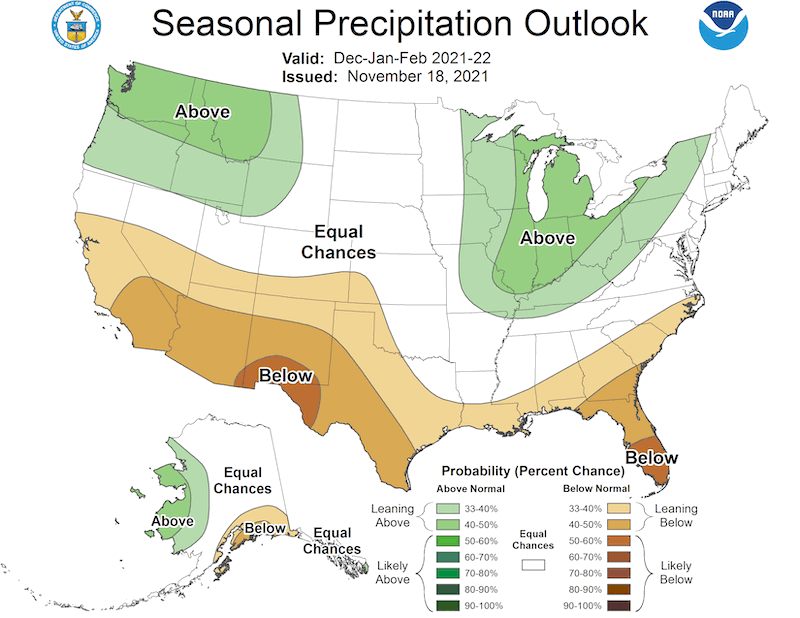
- Looking at the National Weather Service Climate Prediction Center’s Monthly and Seasonal Drought Outlook (Figures 6 and 7), existing drought conditions are expected to continue and persist across the Carolinas. Normal winter precipitation (Figure 8) across Georgia and Alabama will keep longer-term drought conditions at bay there. Florida remains a cause of concern starting in January.
- Although short-term precipitation may begin to replenish near-surface water supply, it can take much longer to percolate into deeper soils and groundwater. Winter rainfall is important for recharging surface and groundwater resources when evaporation and demand are low. It will be important to monitor winter precipitation to fully understand soil moisture conditions heading into next year’s growing season.
Figure 6. U.S. Monthly Drought Outlook (Valid December 2021)
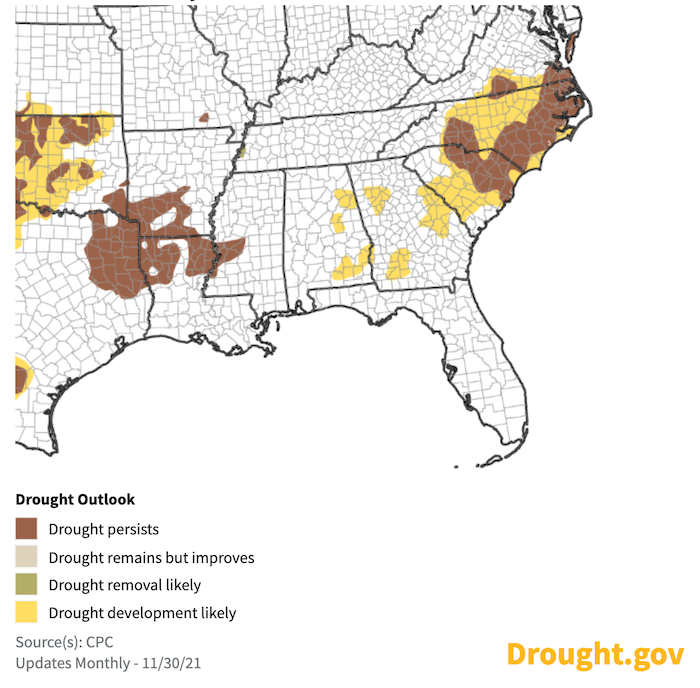
Figure 7. U.S. Seasonal Drought Outlook (Valid December/January/February)
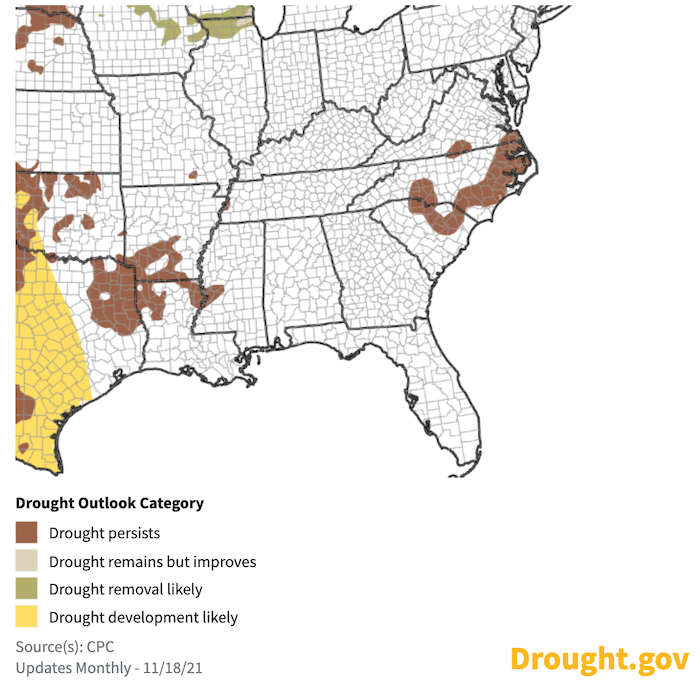
Figure 8. U.S. Precipitation Outlook for December 2021–February 2022
For More Information
- NIDIS, the National Weather Service, and its partners will issue future updates as conditions evolve.
- For questions about drought in your state, contact your State Climatologist or visit the State Drought Pages (see below):
- Alabama: Office of the AL State Climatologist; ADECA Drought Planning and Management
- Florida: Florida Climate Center
- Georgia: Office of the GA State Climatologist; GA EPD Drought Management
- North Carolina: NC State Climate Office; NC Drought Management Advisory Council
- South Carolina: SC State Climatology Office; SC Drought Page
- Virginia: DEQ Drought Page
- More local information is available from the following resources:
- Your local National Weather Service office
- County and city level information on the U.S. Drought Portal (drought.gov)
- Get email alerts when local drought conditions change
- The upcoming Southeast Monthly Climate Webinar on December 14, 2021 at 10:00–11:00 ET will offer updated information about regional conditions, impacts, and outlooks, along with a special presentation on the winter La Niña outlook.
- Sign up for the Southeast Drought Early Warning System (SE DEWS) listserv to receive updates about the region, ongoing drought conditions, and upcoming events and webinars.
Prepared By
Meredith Muth
NOAA/National Integrated Drought Information System (NIDIS)
Victor Murphy
NOAA/National Weather Service
Christopher Stachelski
NOAA/National Weather Service
Corey Davis
North Carolina State Climate Office
Elliot Wickham
South Carolina State Climatology Office
This drought status update is issued to communicate a potential area of concern for drought expansion and/or development within the Southeast U.S. based on recent conditions and the upcoming forecast. NIDIS and its partners will issue future drought status updates as conditions evolve.

