Drought Relief Arrives to Western Kansas and the Oklahoma/Texas Panhandles
Key Points
- May is usually the wettest month of the year for the Southern Plains. May 2023 did not disappoint.
- All Southern Plains states had near-average to above average precipitation for May.
- Amarillo, Texas, had the third wettest May on record and wettest since 2015.
- The area in exceptional (D4) drought has decreased since April.
- Kansas: 20.9% area reduction
- Oklahoma: 13.8% area reduction
- Texas: 3.9% area reduction
- The two largest reservoirs along the Rio Grande, Falcon Lake and Lake Amistad, have seen a small increase since the end of March and are currently at 22% and 38% full, respectively.
- Winter wheat conditions as of June 4:
The U.S. Drought Monitor depicts the location and intensity of drought across the country. The map uses 5 classifications: Abnormally Dry (D0), showing areas that may be going into or are coming out of drought, and four levels of drought (D1–D4).
This map shows drought conditions across the Southern Plains Drought Early Warning System as of June 6, 2023.
U.S. Drought Monitor Categories
Abnormally Dry (D0)
Abnormally Dry (D0) indicates a region that is going into or coming out of drought. View typical impacts by state.
Moderate Drought (D1)
Moderate Drought (D1) is the first of four drought categories (D1–D4), according to the U.S. Drought Monitor. View typical impacts by state.
Severe Drought (D2)
Severe Drought (D2) is the second of four drought categories (D1–D4), according to the U.S. Drought Monitor. View typical impacts by state.
Extreme Drought (D3)
Extreme Drought (D3) is the third of four drought categories (D1–D4), according to the U.S. Drought Monitor. View typical impacts by state.
Exceptional Drought (D4)
Exceptional Drought (D4) is the most intense drought category, according to the U.S. Drought Monitor. View typical impacts by state.
The U.S. Drought Monitor depicts the location and intensity of drought across the country. The map uses 5 classifications: Abnormally Dry (D0), showing areas that may be going into or are coming out of drought, and four levels of drought (D1–D4).
This map shows drought conditions across the Southern Plains Drought Early Warning System as of June 6, 2023.
The U.S. Drought Monitor is updated weekly on Thursday mornings, with data valid through the previous Tuesday at 7 a.m. Eastern.
U.S. Drought Monitor
- 41% of the region is in drought (D1 or worse), a 24% decrease from 3 months ago
- 8% of the region is experiencing Extreme (D3) drought or worse:
- Kansas—46% of the state
- New Mexico—0%
- Oklahoma—9%
- Texas—2%
- 2% of the region is experiencing Exceptional (D4) drought
- 17% of Kansas is now in D4 status and is currently the largest percentage in D4 of any U.S. state.
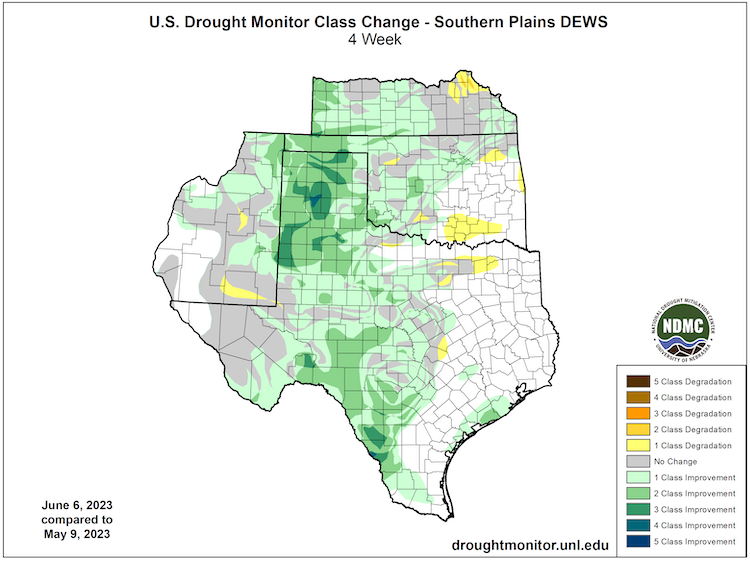
- In a 4-week span, parts of the Texas Panhandle region experienced a 3-class improvement in drought category based on the U.S. Drought Monitor.
- Extreme (D3) drought conditions have been in place in this region since August 2019.
- Moderate (D1) or worse drought has been in the region since June 2016.
4-Week U.S. Drought Monitor Change Map
Recent Conditions
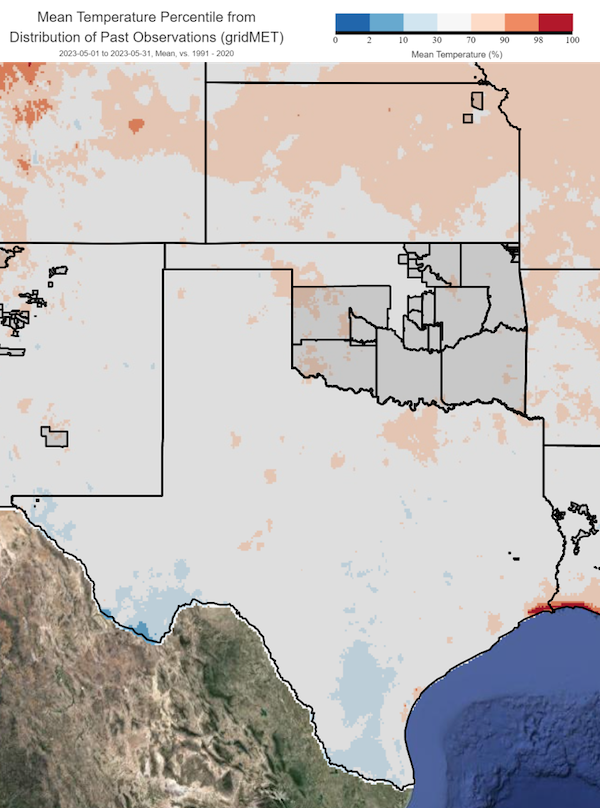
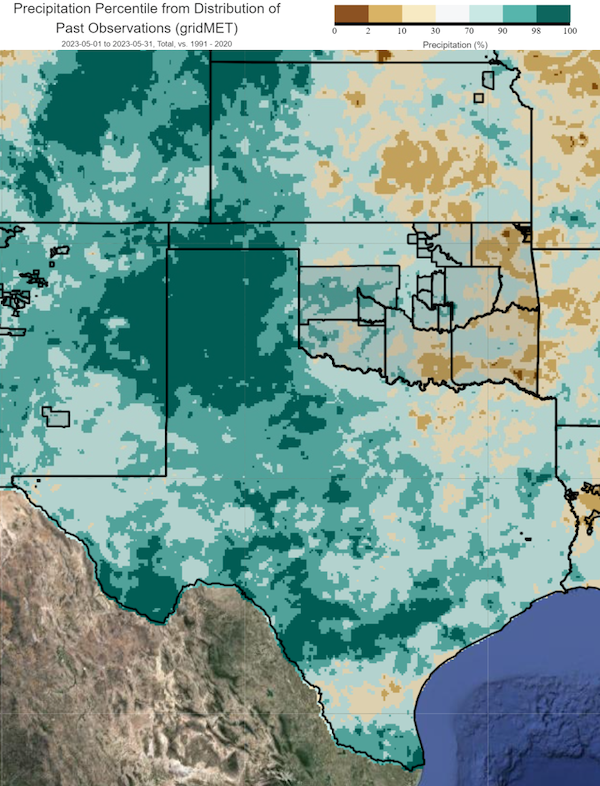
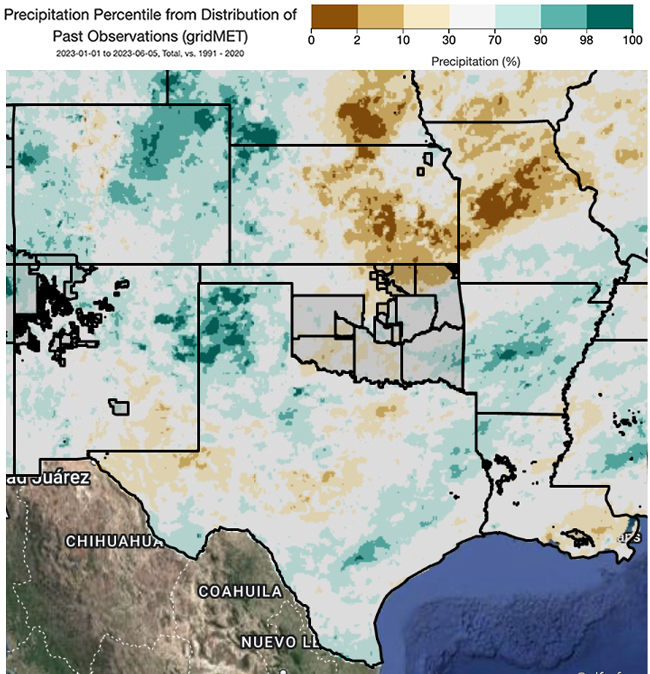
May Temperature and Precipitation Percentiles
- Much of the region, including northern Texas, western Oklahoma, northeastern New Mexico, and southwestern Kansas, has received monthly precipitation above the 90th percentile for May.
- Amarillo, Texas, had its third wettest May on record and wettest since 2015.
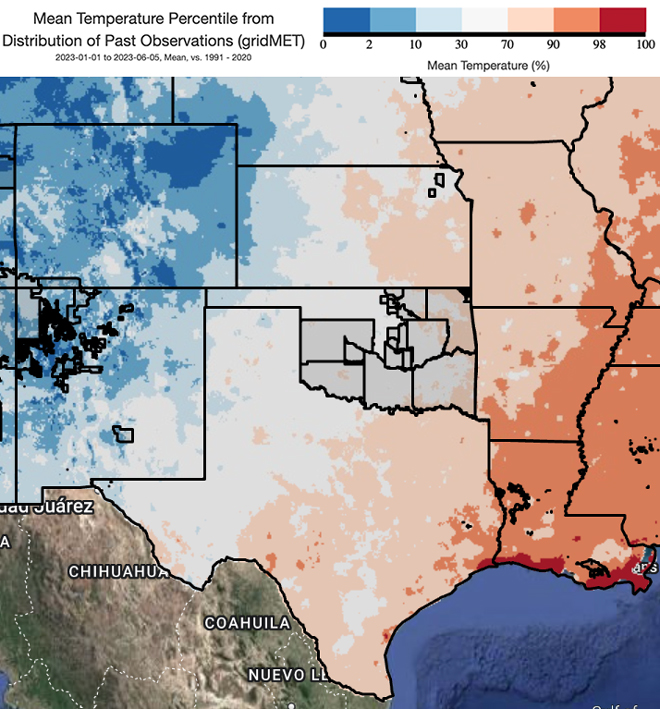
Calendar Year to Date Temperature and Precipitation Percentiles
- 2023 began very dry across most of the Southern Plains with parts of southwestern Kansas and the Texas and Oklahoma panhandles seeing precipitation within the bottom 10% of historical records by the end of March. Precipitation through May was large enough that these same regions are now seeing precipitation totals within the top 90% of historical records.
- The prolonged dry spell over Central Texas, around the Edwards Plateau region, has experienced some relief, but year-to-date precipitation remains within the bottom 30% of historical records.
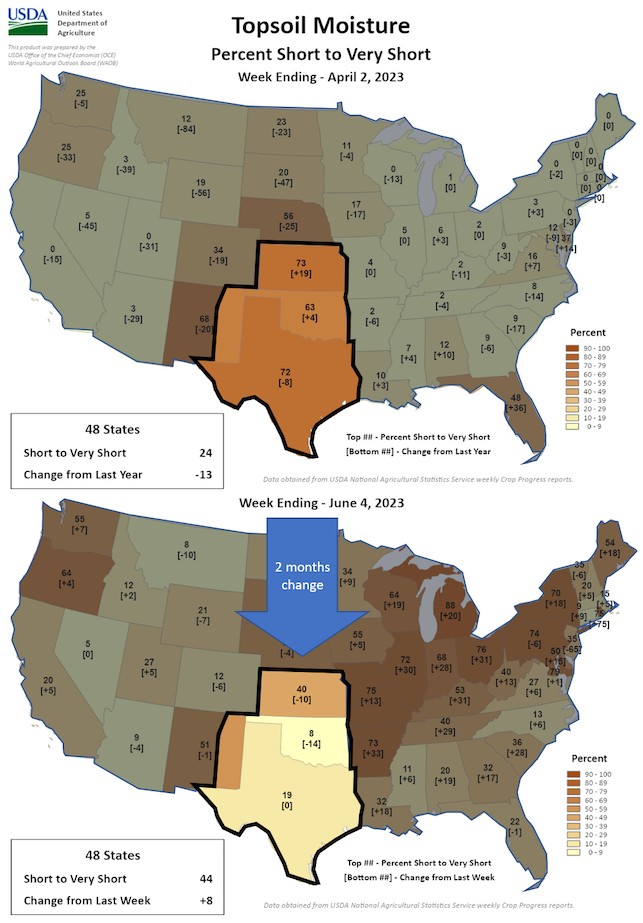
Topsoil Moisture Conditions: April 2 vs. June 4
Southern Plains Drought in the News
- KUCR: The high plains drought is so bad that Kansas is importing wheat from Europe
- DRG News: Drought Monitor: Southern Plains see some drought relief
- AccuWeather via Yahoo News: Heavy rainfall bringing needed drought relief to central, southern Plains
- Progressive Farmer by DTN: Heavy Rain for Southern Plains Drought Areas: Will it Make a Difference?
- The Wichita Eagle: Wichita continues to experience ‘exceptional drought.’ When can Kansas expect relief?
- KSN.com: Rain helped, but the Kansas drought remains a problem
- Kansas Reflector: With only weeks until winter wheat harvest, drought still plagues Kansas
- KWCH: Kansas drought: Spring so far, the driest since Dust Bowl for Wichita
Usual Summer Precipitation
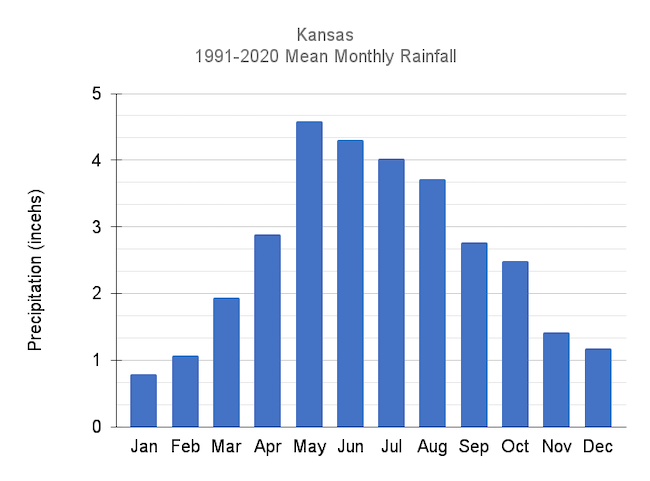
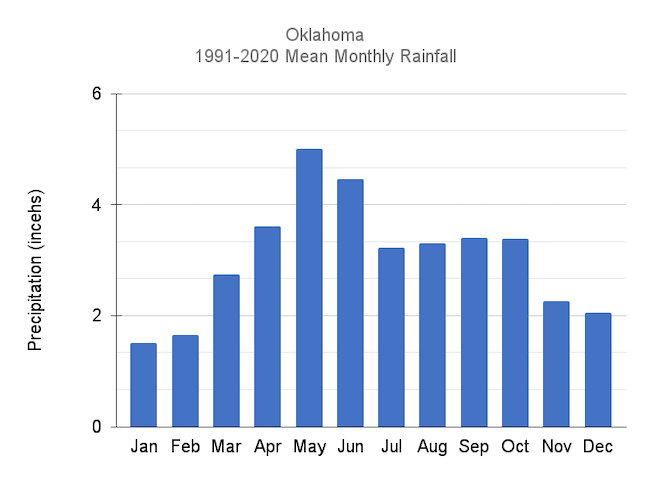
Late Spring and Early Summer Usually See the Most Rain
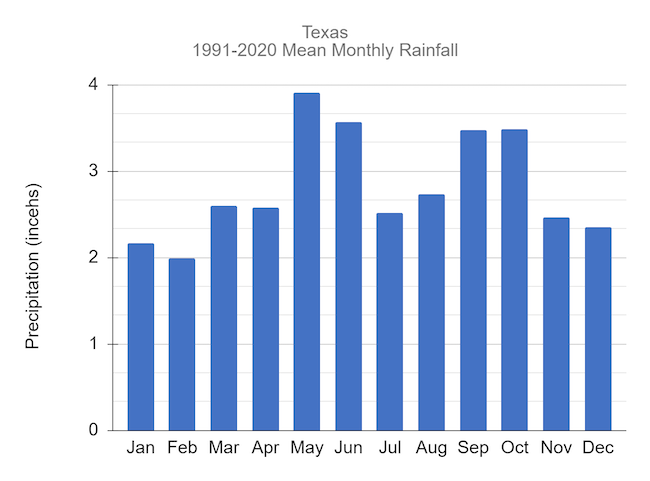
- May and June are usually the wettest months of the year for Kansas, Oklahoma, and Texas.
- Summer months can act as a “reset” on drought conditions in average to above-average seasons.
Kansas Monthly Average Precipitation
Oklahoma Monthly Average Precipitation
Texas Monthly Average Precipitation
Forecasts and Seasonal Outlooks
June 2023 Outlook
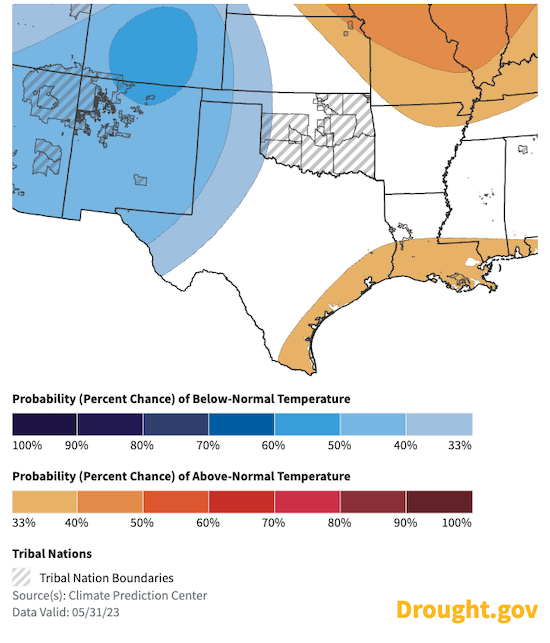
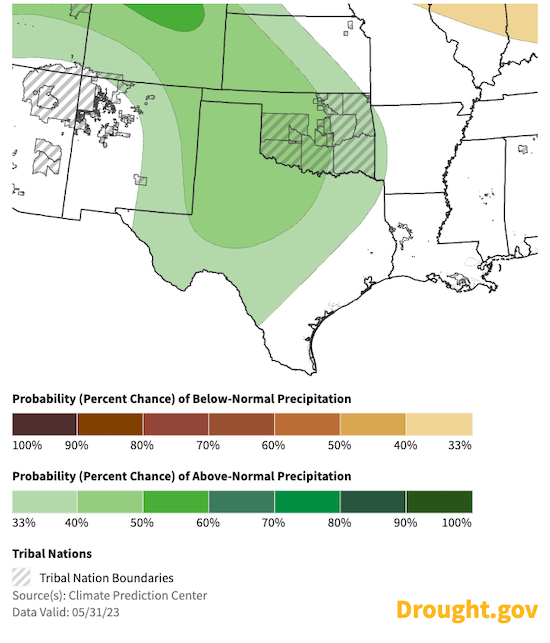
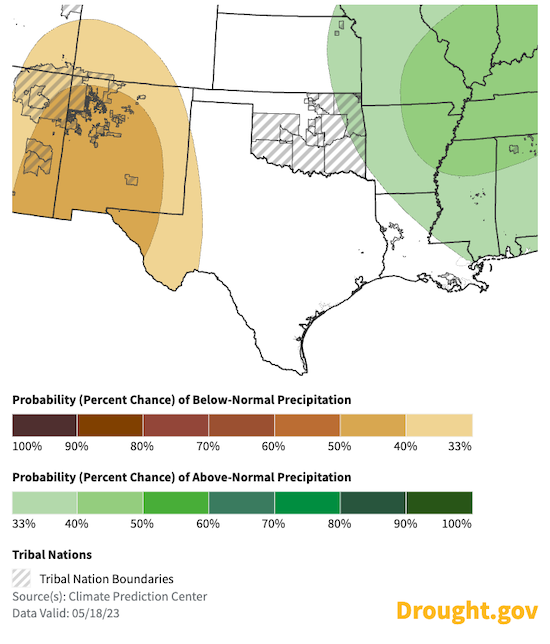
The Climate Prediction Center's monthly outlook for June shows:
- Temperature: There are equal odds of above- or below-normal temperatures for June for most of the Southern Plains.
- Precipitation: Odds favor a wet month for western Texas, Oklahoma, Kansas, and eastern New Mexico for June.
June 2023 Temperature Outlook
June 2023 Precipitation Outlook
3-Month Outlook for June–August 2023
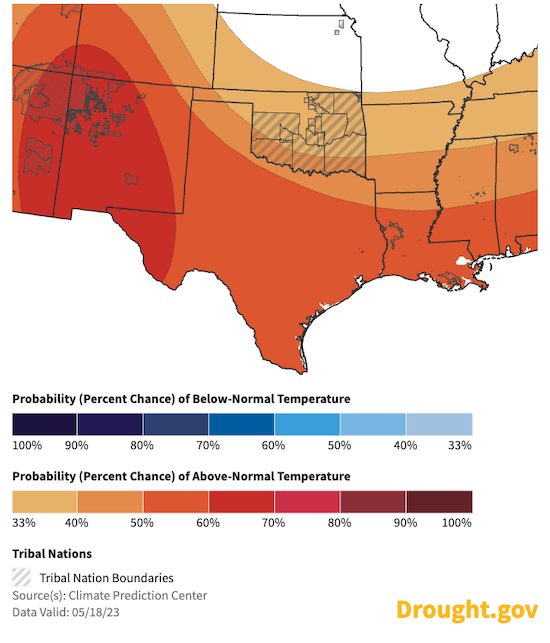
Seasonal outlooks for June–August 2023 show a warmer-than-normal season ahead for the Southern Plains region. There is an equal chance of above- or below-normal precipitation for the season.
Seasonal Temperature Outlook: June–August 2023
Seasonal Precipitation Outlook: June–August 2023
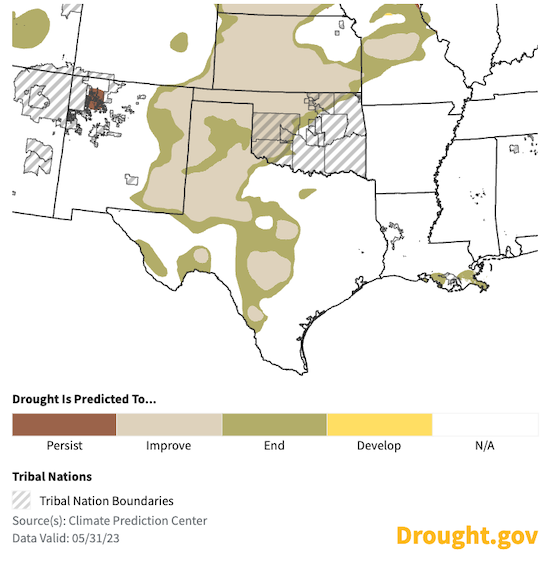
Seasonal Drought Outlook for June–August 2023
Drought in western Kansas, Oklahoma, and Texas is forecast to improve through summer with some complete removal of drought around the fringes of the current drought-affected areas of the Southern Plains.
3-Month U.S. Drought Outlook
Long-Range Climate Guidance: Fall & Winter 2023
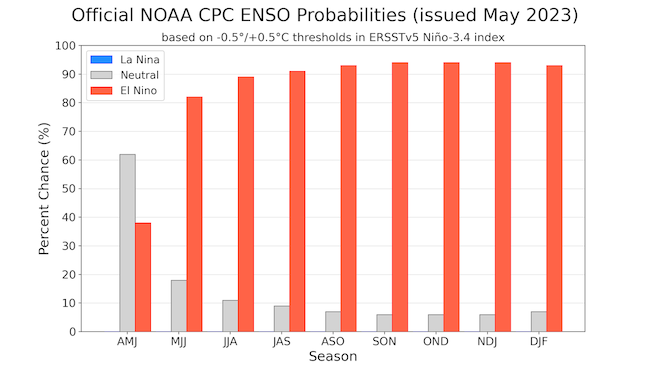
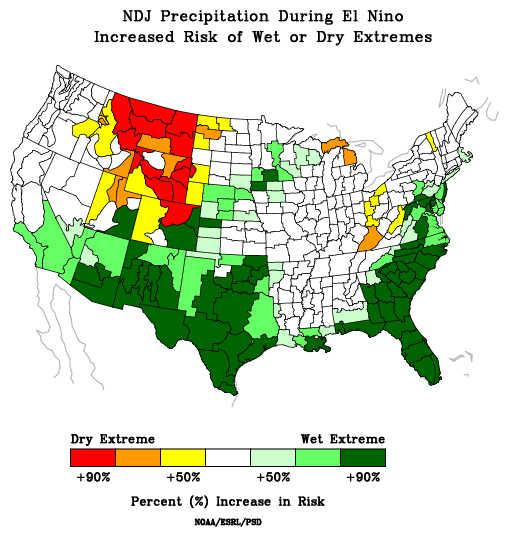
- El Niño conditions are present in the tropical Pacific Ocean and are expected to gradually strengthen into the winter.
- Each El Niño has impacted the Southern Plains weather differently, but on average, El Niño usually means a-wetter than-normal summer for western Kansas, and a cooler and wetter fall and winter for Oklahoma and Texas.
State-Based Conditions and Impacts
Kansas
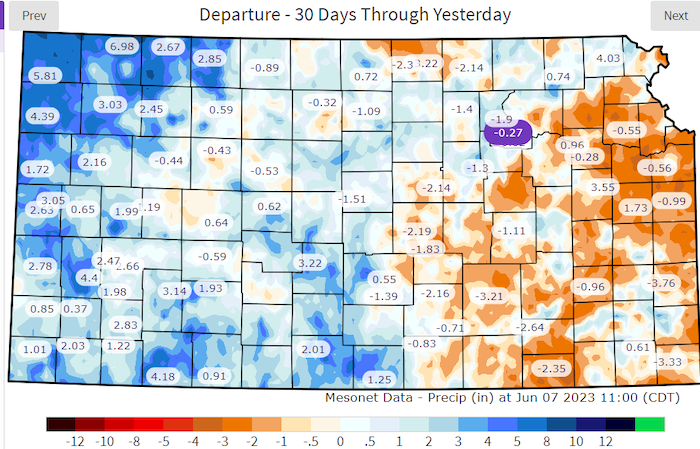
- Recent rainfall has led to improving conditions across the state, but many areas are still below normal for the growing season and year thanks to drier-than-normal conditions in early spring. As of June 6, only two of the nine climate divisions are running above normal for the year (northwest and southwest). Annual precipitation for the state is at 82% of normal, and 89% since the start of the growing season (April 1).
- As of the June 8 U.S. Drought Monitor update, 17% of Kansas remains in D4 status, the most severe drought category. This number was as high as 46% in late April. Only 9% of the state is drought-free. he composite Drought Severity and Coverage Index has been over 300 for 38 consecutive weeks, the longest stretch in a decade.
Oklahoma
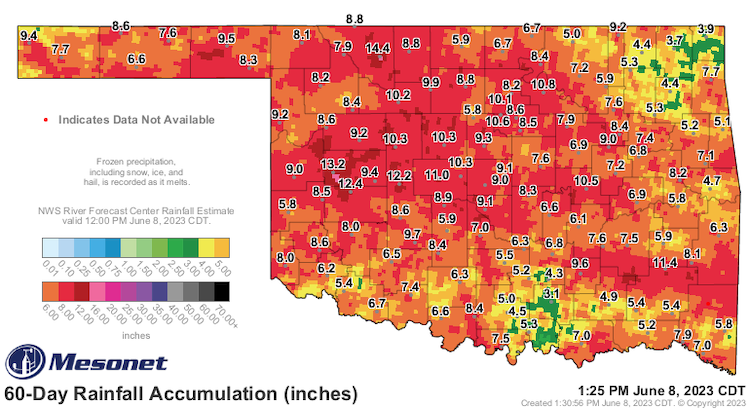
- Heavy rains across much of western Oklahoma over the last 60 days has led to significant drought reduction, especially in short-term drought impacts.
- Much of western Oklahoma has seen surpluses of 3–5 inches, with some isolated surplus amounts exceeding 6 inches, through the last 60 days.
- Eastern Oklahoma has not fared as well, with deficits of 3–5 inches across much of that region of the state.
- Northeastern Oklahoma has seen deficits exceeding 7 inches since early April.
Texas
- Wildfire activity was suppressed in western Texas by the May rains. The upcoming summer wildfire season typically has more ignitions but smaller fires.
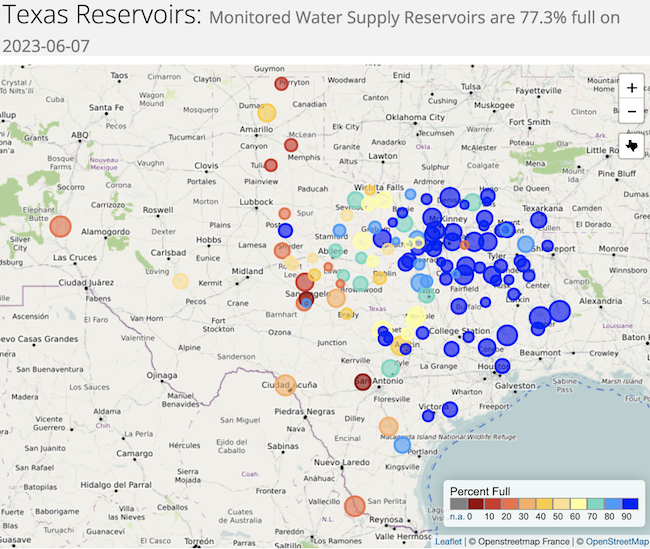
- Water storage for South Texas and the Rio Grande Valley has inched upward. Both Amistad and Falcon have more water than this time last year.
- The extended wet weather in the Panhandle and High Plains made field work difficult in many areas. Many farmers lost their window of opportunity to plant insurable cotton.
- Statewide, reservoirs across Texas are 77.3% full. This is about seven percentage points below the long-term average. Climatologically, reservoir levels are expected to begin declining over the next month.
For More Information
- NIDIS and its partners will issue future drought status updates as conditions evolve.
- More local information is available from the following resources:
Prepared By
Joel Lisonbee
NOAA’s National Integrated Drought Information System, Southern Plains Drought Early Warning System; CIRES/CU Boulder
Gary McManus
Oklahoma State Climatologist, Oklahoma Mesonet, Oklahoma Climatological Survey
Matt Sittel
Kansas Assistant State Climatologist, Kansas State University
John Nielsen-Gammon
Texas State Climatologist, Texas State Climate Office, Texas A&M University
Southern Regional Climate Center
Alison Tarter
Texas State Climate Office, Texas A&M University
Southern Regional Climate Center
William (BJ) Baule
Texas State Climate Office, Texas A&M University
Southern Regional Climate Center
Victor Murphy
National Weather Service
This drought status update is issued in partnership between the National Oceanic and Atmospheric Administration (NOAA) and the offices of the state climatologist for Texas, Oklahoma, New Mexico, and Kansas. The purpose of the update is to communicate a potential area of concern for drought expansion and/or development within the Southern Plains based on recent conditions and the upcoming forecast. NIDIS and its partners will issue future drought updates as conditions evolve.
