NIDIS & MAPP Launch “Story Map” Telling the Story of the Historic California Drought
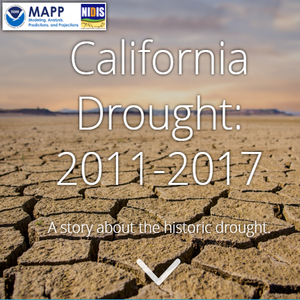 NIDIS and NOAA’s Modeling, Analysis, Predictions and Projections program (MAPP) have just launched an interactive presentation that analyzes and explains the historic drought that impacted California from 2011 to 2017. This presentation, called a “Story Map” takes users through a visual history of the drought, using images and graphs to provide an interactive and engaging experience.
“This way of storytelling is changing the game in science communication – it’s an evolution in how we communicate complex science and data, making science more accessible and engaging for a broader audience,”said Christina Stone, Communications Coordinator for NIDIS.
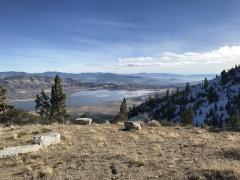
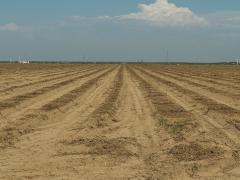
The California Drought was historic in its severity and longevity, causing over $5 billion in damage to agriculture alone, as well as substantial impacts to fisheries, soil health and infrastructure, depleting water reservoir storage, and drying out vegetation which increased wildfire danger. In the 30 months leading up to December 2013, California had only received 33 inches of precipitation, rather than the typical 53 inches over the same 30-month timeframe.
By mid-January 2014, over 60% of California was experiencing extreme drought (class D3 drought on the U.S. Drought Monitor). In response to the expected impacts of the exceptionally dry winter to date and depletion of reservoir storage from prior dry years, Governor Jerry Brown, Jr. proclaimed a statewide emergency due to drought on January 17, 2014, which was not lifted until April 7, 2017. In May 2014, a snow survey reported snowpack at only 18 percent of average; by the end of the month, the snowpack water equivalent had decreased to almost zero. By August 2014, most of the state's reservoirs were below 50% of their total capacity. The drought finally began to recede once rain finally returned to Northern California in 2016, and all of California in the beginning of 2017.
The MAPP-NIDIS California Story Map gives readers context for this drought by first explaining California's history with drought and the standard water and resource management practices that have been put in place to mitigate and manage the dry season. With this context, readers then are taken through the development and evolution of the 2011-2017 drought, and presented with data and figures that highlight the extraordinary nature of this drought, including the culmination of the driving forces of snowpack, reservoir storage, rainfall, and soil moisture.
Once readers have made it through the timeline of the drought, they then can read about lessons learned and how the 2011-2017 drought changed how drought is managed in the state. The story map also highlights some of the research that MAPP is supporting to better monitor, understand, and predict drought.
Highlighted throughout the story map are the data and resources used for water resource and drought monitoring before, during and after the California drought. Some of the resources include NASA’s Gravity Recovery and Climate Experiment (GRACE) and Jet Propulsion Laboratory, NOAA's Southwest Fisheries Science Center, the NASA-NOAA GOES-16 satellite, and the Water Resources Application, a collaborative effort between California Department of Water Resources, NASA, the U.S. Geological Survey, and the U.S. Department of Agriculture.
Tune in on May 29 to the California-Nevada Drought and Climate Outlook Webinar to learn more and watch as MAPP-supported scientists walk through the story map.