
Quarterly Climate Impacts and Outlook for the Southeast Region for December 2019 – February 2020. Dated March 2020.
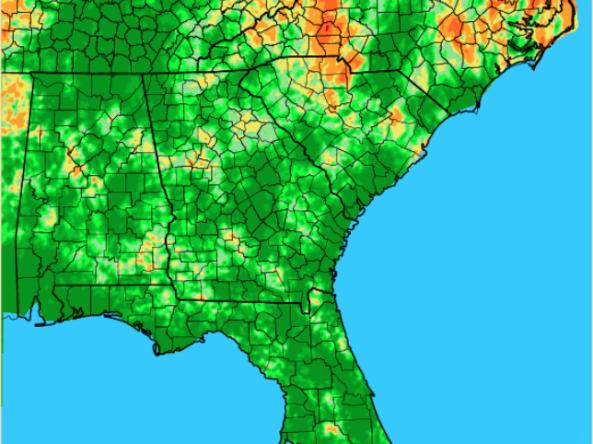
Above-average temperatures were recorded over most of the Southeast. Maximum temperatures were generally near normal, but minimum temperatures were 3-6 F above normal due to high humidity and cloud cover. Precipitation ranged from slightly below normal in the Florida peninsula to over 10 inches above normal in northern Alabama.

Quarterly Climate Impacts and Outlook for the Southeast Region for September – November 2019. Dated December 2019.
Above-average temperatures were recorded over most of the Southeast. Mean temperatures were in the top five warmest at 35 long-term stations. Autumn precipitation was below normal for most of the Southeast region. None of the long-term stations ranked within the top 10 wettest for the season.

Quarterly Climate Impacts and Outlook for the Southeast Region for June – August 2019. Dated September 2019.
Above-average temperatures were recorded over most of the Southeast. Summer precipitation was highly variable across the Southeast, as departures ranged from less than 75% to more than 200% of normal.

Quarterly Climate Impacts and Outlook for the Southeast Region for March – May 2019. Dated June 2019.
Above-average temperatures were recorded over most of the Southeast. Mean temperatures were 2-4 F above normal for most of the region. Spring precipitation was around 50% to 90% of normal across much of the Southeast, except in western NC, and parts of central NC and AL, where it went up to 130% of normal.

Quarterly Climate Impacts and Outlook for the Southeast Region for December 2018 – February 2019. Dated March 2019.

Quarterly Climate Impacts and Outlook for the Southeast Region for March – May 2020. Dated June 2020.
Above-average temperatures were observed across the Southeast this spring. Precipitation varied across the region, however two tropical storms and a slow-moving upper level low observed throughout the spring, caused flooding in local areas of the Southeast.

Quarterly Climate Impacts and Outlook for the Southeast Region for September – November 2018. Dated December 2018.
Above-average temperatures were observed over almost all of the Southeast. Precipitation ranged from less than 50% of normal on the East Coast of Florida to over 300% of normal along the border between North and South Carolinas.