For the latest forecasts and critical weather information, visit weather.gov.
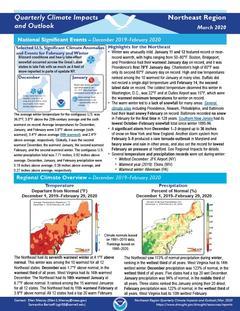
Quarterly Climate Impacts and Outlook for the Northeast Region for December 2019 – February 2020. Dated March 2020.
The Northeast had its seventh warmest winter at 4.1°F above normal. This winter was among the 10 warmest for all 12 Northeast states. The Northeast saw 113% of normal precipitation during winter, ranking in the wettest third of all years.
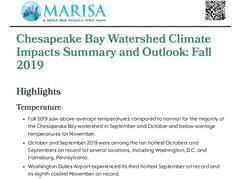
Quarterly Climate Impacts and Outlook for the Chesapeake Bay Region for September – November 2019. Dated December 2019.
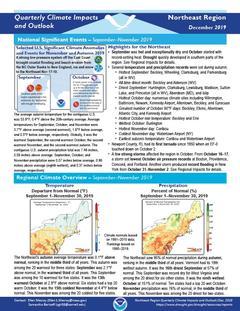
Quarterly Climate Impacts and Outlook for the Northeast Region for September – November 2019. Dated December 2019.
The Northeast's autumn average temperature was 0.1°F above normal, ranking in the middle third of all years. The Northeast saw 95% of normal precipitation during autumn, ranking in the middle third of all years.
Quarterly Climate Impacts and Outlook for the Chesapeake Bay Region for June – August 2019. Dated September 2019.
Temperature was above normal for much of the region throughout the summer months, and July ranked as one of the ten all-time warmest months on record for several locations. High intensity rainfall events occurred throughout the Chesapeake Bay watershed, resulting in two rare National Weather Service Flash Flood Emergencies.
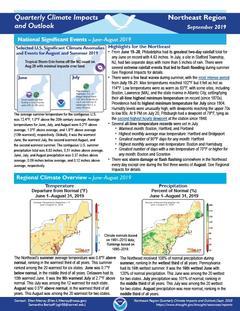
Quarterly Climate Impacts and Outlook for the Northeast Region for June – August 2019. Dated September 2019.
The Northeast's summer average temperature was 0.8°F above normal, ranking in the warmest third of all years. The Northeast received 108% of normal precipitation during summer, ranking in the wettest third of all years.
Quarterly Climate Impacts and Outlook for the Chesapeake Bay Region for March – May 2019. Dated June 2019.
Spring temperature was above average for most of the Chesapeake Bay watershed. Spring precipitation was up to double historical averages in the northern Chesapeake Bay.
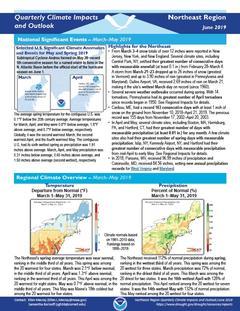
Quarterly Climate Impacts and Outlook for the Northeast Region for March – May 2019. Dated June 2019.
The Northeast's spring average temperature was near normal, ranking in the middle third of all years. The Northeast received 112% of normal precipitation during spring, ranking in the wettest third of all years.
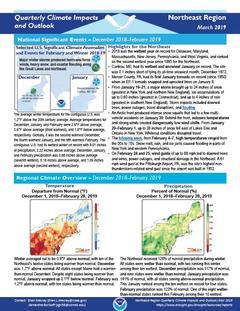
Quarterly Climate Impacts and Outlook for the Northeast Region for December 2018 – February 2019. Dated March 2019.
Winter averaged out to be 0.9°F above normal, with ten of the Northeast's twelve states being warmer than normal. The Northeast received 128% of normal precipitation during winter. All states were wetter than normal, with two ranking this winter among their ten wettest.
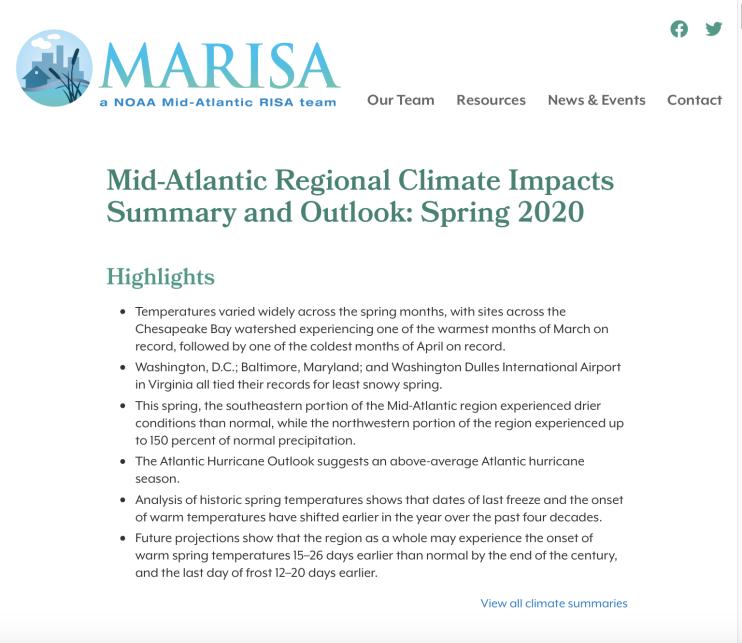
Quarterly Climate Impacts and Outlook for the Chesapeake Bay Region for March – May 2020. Dated June 2020.
Temperatures varied widely across the spring months, with sites across the Chesapeake Bay watershed experiencing one of the warmest months of March on record, followed by one of the coldest months of April on record. The southeastern portion of the Mid-Atlantic region experienced drier conditions than normal, while the northwestern portion of the region experienced up to 150 percent of normal precipitation.
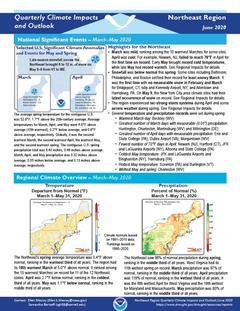
Quarterly Climate Impacts and Outlook for the Northeast Region for March – May 2020. Dated June 2020.
The Northeast's spring average temperature was 0.4°F above normal, ranking in the warmest third of all years. The Northeast saw 98% of normal precipitation during spring, ranking in the middle third of all years.


