U.S. flag

An official website of the United States government

DATA & MAPS

Select categories to browse data

Looking to Download Data? The Drought.gov team reformats data from multiple partners into web- and GIS-ready formats, which we use throughout Drought.gov. These data are free for all to download.
Search Results(21)

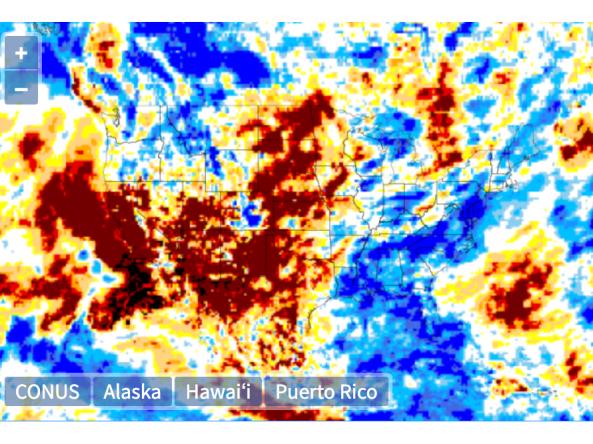
The Global Gridded Standardized Precipitation Index (SPI) is derived from the CMORPH daily dataset and includes timescales of 1, 3, 6 and 9 months.  The NOAA CMORPH precipitatio

The National Agricultural Statistics Service (NASS) conducts hundreds of surveys every year and prepares reports covering virtually every aspect of U.S. agriculture.

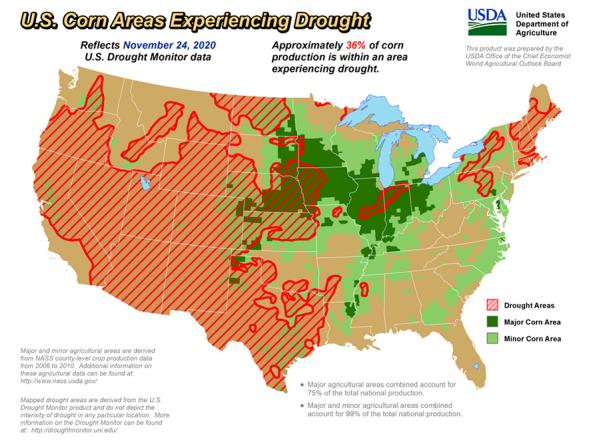
The U.S. Department of Agriculture produces weekly maps and charts displaying locations and percentages of drought-affected areas corn, soybeans, hay, cattle, and winter wheat. 

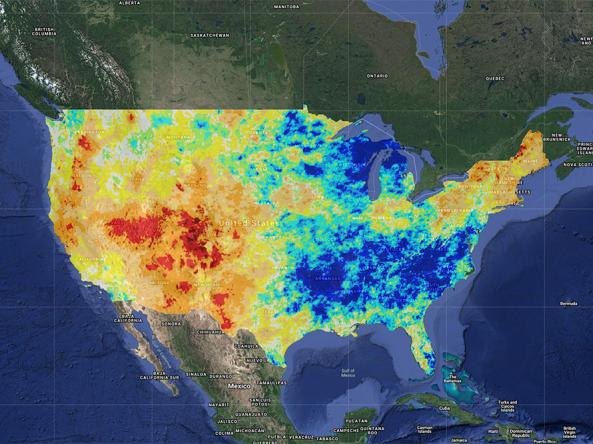
This new experimental implementation of the Palmer Drought Severity Index (PDSI) updates every 5 days using the high-resolution gridMET gridded research dataset and USDA STATSGO soil