U.S. flag

An official website of the United States government

The U.S. government is closed. This site will not be updated; however, NOAA websites and social media channels necessary to protect lives and property will be maintained. To learn more, visit commerce.gov.

For the latest forecasts and critical weather information, visit weather.gov.
DATA & MAPS

Select categories to browse data

Looking to Download Data? The Drought.gov team reformats data from multiple partners into web- and GIS-ready formats, which we use throughout Drought.gov. These data are free for all to download.
Search Results(26)

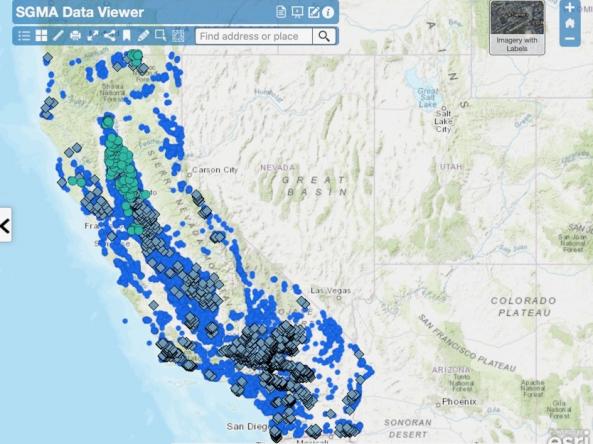
This interactive tool shows California groundwater level data, including depth below ground surface, groundwater elevation, and groundwater change in elevation. 

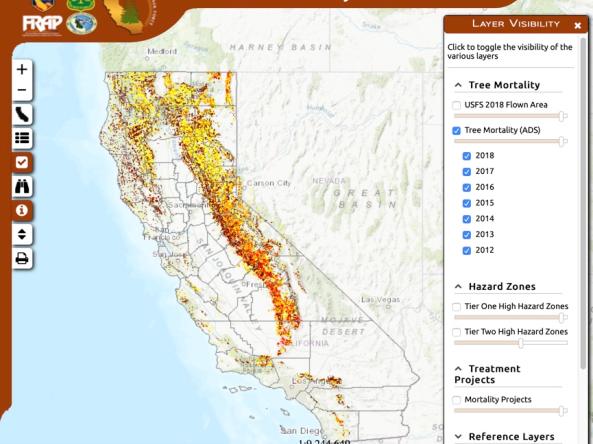
Interactive map shows results of 2012-2018 aerial tree-mortality surveys: numbers of dead trees per acre, high hazard zones, asset locations and more information related to drought-caused tree mortality and subsequent bark beetle infestations.

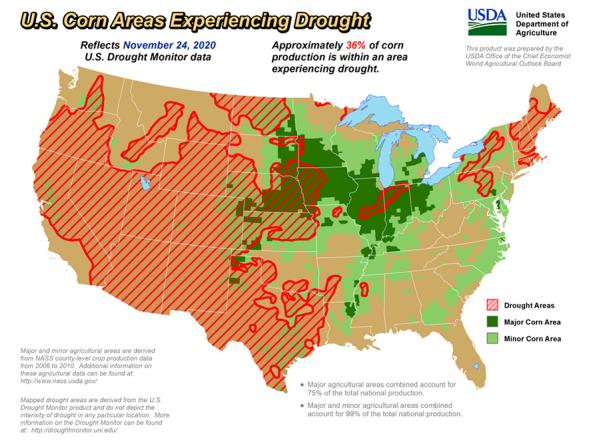
The U.S. Department of Agriculture produces weekly maps and charts displaying locations and percentages of drought-affected areas corn, soybeans, hay, cattle, and winter wheat. 

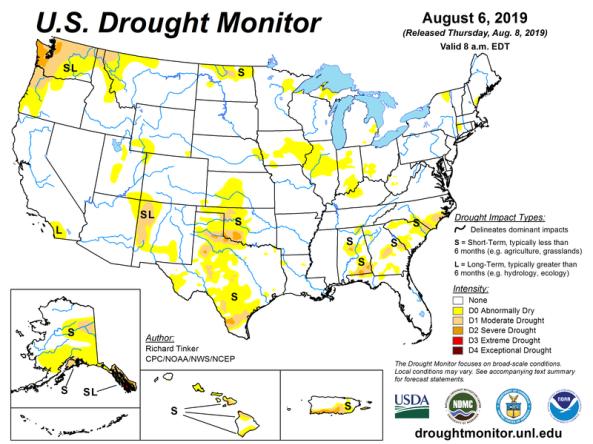
NOAA and its partners publish regional reports each quarter, summarizing weather, impacts and predictions.