Water Year 2022 Closes Third Year of Drought as Fourth Year Looms.
Register here for the November 28 California-Nevada Drought & Climate Outlook Webinar.
Key Points
- Water Year 2022 started wet with a strong atmospheric river and ended in continued drought due to almost no precipitation during January through March.
- The past 3 Water Years have been the driest in the California record. Both California and Nevada remain in almost 100% moderate-to-exceptional drought.
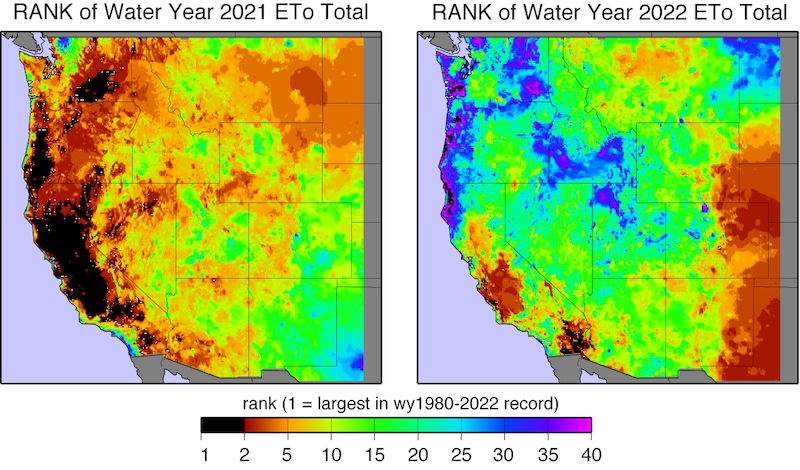
- Both evaporative demand and lack of precipitation are drivers of the current drought since it began in October of 2019. Water Year 2022 had much lower evaporative demand than Water Year 2021, which limited the drying of the landscapes and helped mitigate fire risk.
- Drought impacts (e.g., pasture conditions, ecosystem health, water supply, recreation, fire potential) have intensified and expanded given back-to-back dry years. Drought preparedness is key.
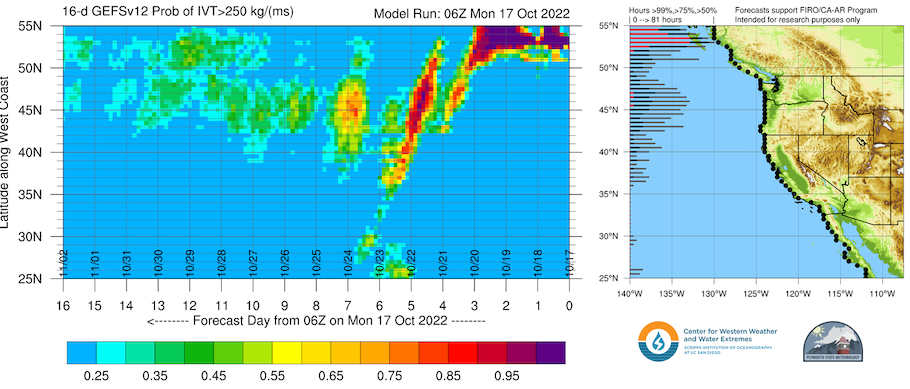
- A ‘three-peat’ La Niña winter is forecasted for Water Year 2023, suggesting continued dry conditions in southern regions of California and Nevada. Extended range forecasts indicate the first atmospheric river of the Water Year will hit the west coast in the next 7 days.
The U.S. Drought Monitor (USDM) is updated each Thursday to show the location and intensity of drought across the country. Drought categories show experts’ assessments of conditions related to dryness and drought including observations of how much water is available in streams, lakes, and soils compared to usual for the same time of year.
California/Nevada conditions as of October 11, 2022:
- 99.77% of California is experiencing Moderate (D1) to Exceptional (D4) Drought (23.34% in D3, 16.57% in D4)
- California population in drought: 37,243,577
- 100% of Nevada is experiencing Moderate (D1) to Exceptional (D4) Drought (44.61% in D3, 0% in D4)
- Nevada population in drought: 2,700,551
U.S. Drought Monitor Categories
The U.S. Drought Monitor (USDM) is updated each Thursday to show the location and intensity of drought across the country. Drought categories show experts’ assessments of conditions related to dryness and drought including observations of how much water is available in streams, lakes, and soils compared to usual for the same time of year.
California/Nevada conditions as of October 11, 2022:
- 99.77% of California is experiencing Moderate (D1) to Exceptional (D4) Drought (23.34% in D3, 16.57% in D4)
- California population in drought: 37,243,577
- 100% of Nevada is experiencing Moderate (D1) to Exceptional (D4) Drought (44.61% in D3, 0% in D4)
- Nevada population in drought: 2,700,551
Current Conditions
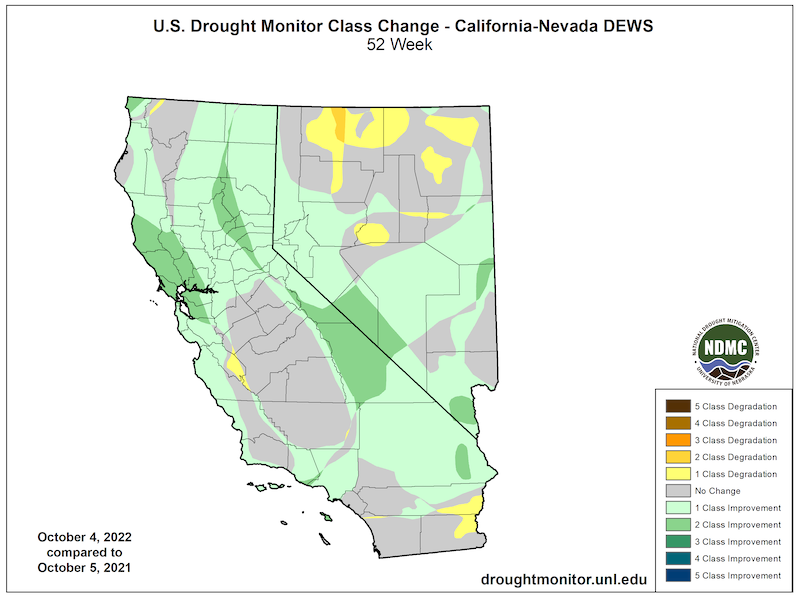
- Over this last water year, drought has improved by one class in many parts of California and Nevada. Nonetheless, both states remain nearly 100% in drought, according to the U.S. Drought Monitor.
- The past 3 years have been the driest on record in California and the third driest in Nevada, according to NOAA's National Centers for Environmental Information.
- While Nevada currently has no exceptional drought (D4), partly due to the Southwest Monsoon, more than 99% of the region remains in severe drought (D2) or worse.
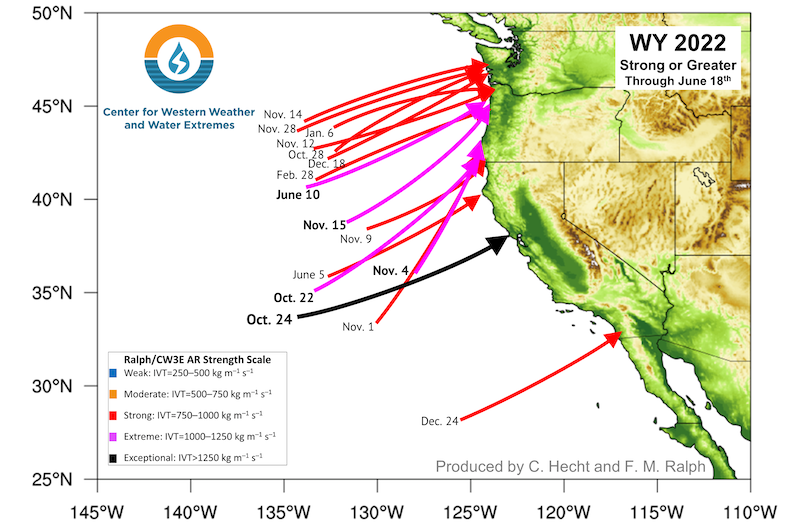
- The 2022 Water Year began with an exceptionally strong atmospheric river, AR 5, bringing record-breaking rain to the region. A wet December was followed by the driest 3-month start to a calendar year in the over 100-year record—ushering in a return of snow drought—for both California and Nevada with only one weak atmospheric river making landfall.
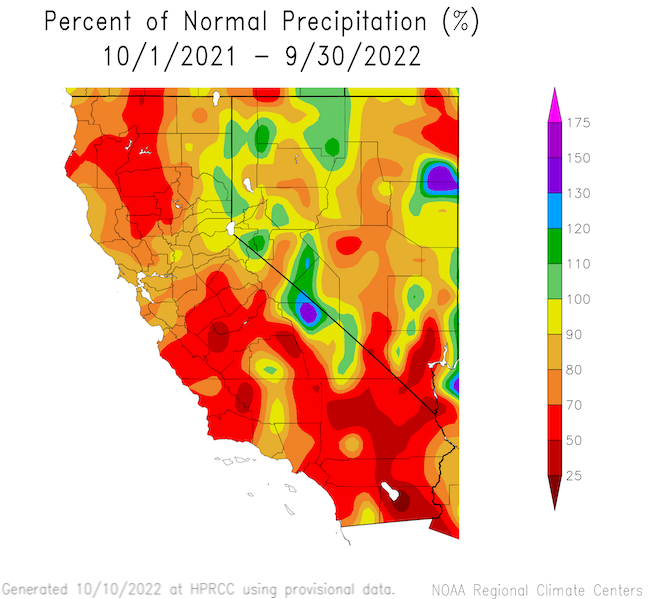
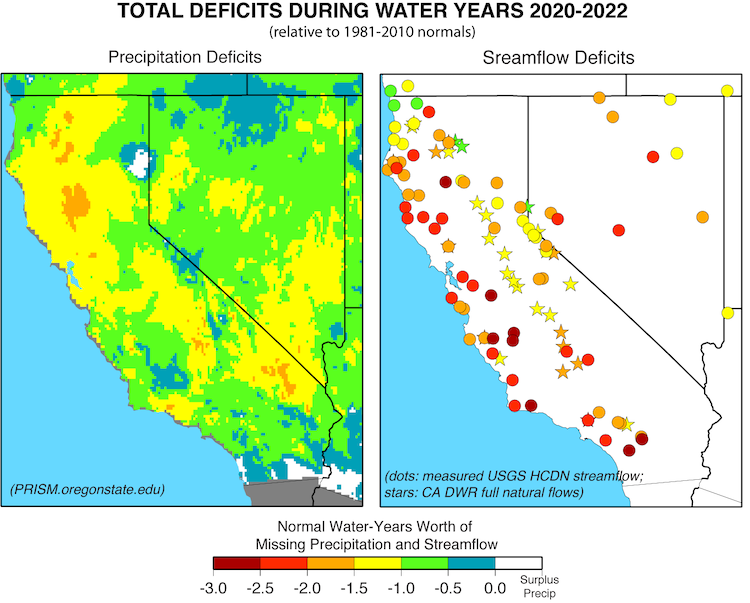
- Much of the region is missing between 0.5 to 1.5 years of precipitation, but streamflow deficits in many regions are even greater.
- Water Year 2022 had much lower evaporative demand than Water Year 2021, which limited the drying of the landscapes and helped mitigate fire risk. California year-to-date acreage burned is less than 20% of the 5-year average.
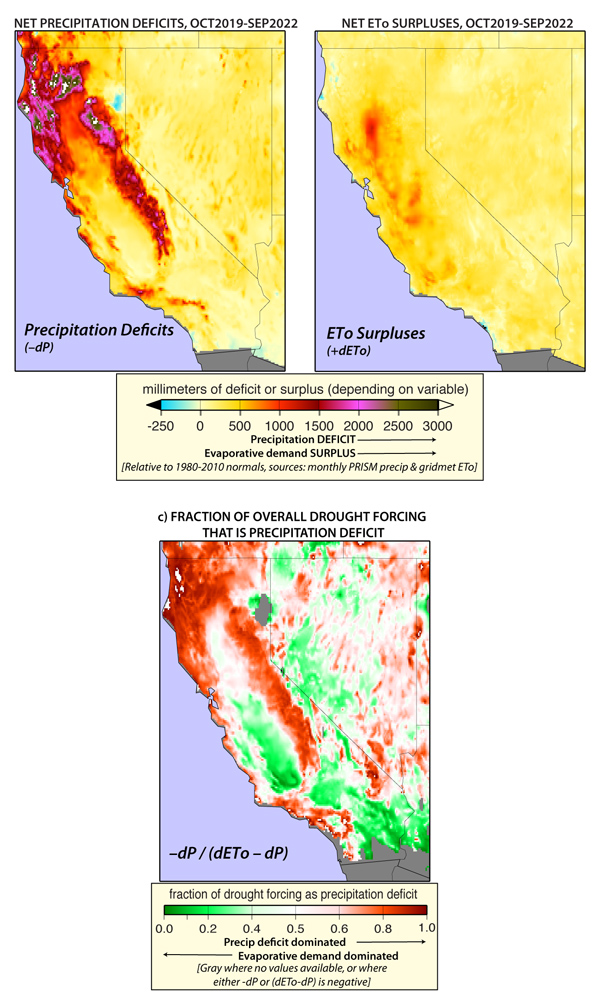
- Both evaporative demand and lack of precipitation are drivers of the current drought since it began in October of 2019. Evaporative demand is the primary driver in much of the Central Valley and the eastern slopes of the Sierras into Nevada, while lack of precipitation has been the primary driver in northern California and the Sierras.
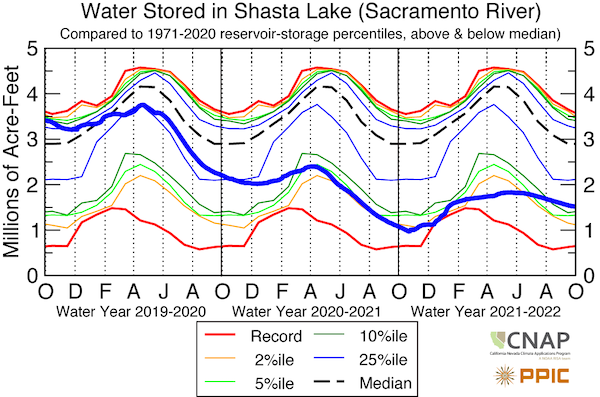
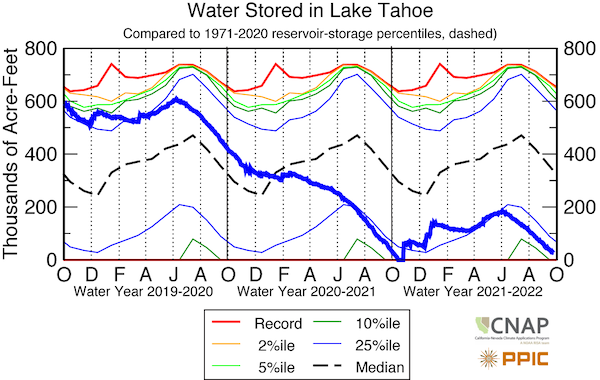
- The Western Sierra reservoirs are starting the 2023 Water Year with 7.7 million acre-feet, about 1.5 million acre-feet more than at the start of Water Year 2022. In California, Lake Shasta reached near record low levels in December of last year, while Lake Orville recovered from a record low in Water Year 2021 to slightly above the 10th percentile storage level. Lake Tahoe is slightly above the rim, similar to where it was at the start of Water Year 2022.
- Extended range forecasts indicate the first atmospheric river of the Water Year will hit the West Coast in the next 7 days.
- For more information, check out Living with Drought in Nevada and the California Water Watch.
How is drought affecting your neighborhood? Click to see drought indicators, outlooks, and historical conditions by city, county, and state, as well as sign up for alerts.
U.S. Drought Monitor 52-Week Change Map
Water Year 2022 Percent of Normal Precipitation
Strong or Greater Atmospheric Rivers (AR): Water Year 2022
Precipitation and Streamflow Deficits: Water Years 2020–2022
Evaporative Demand Rankings for Water Year 2021–2022
Relative Contributions of Precipitation Deficit and Surplus Evaporative Demand
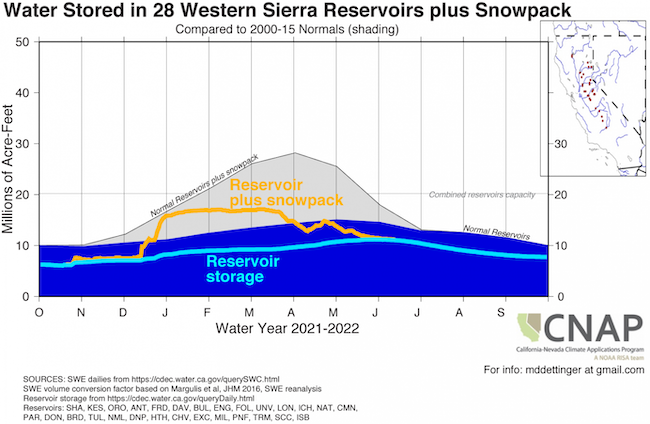
Water Storage in Shasta Lake and Lake Tahoe
Water Year 2022 Drought Impact Summary
Drought intensification or development on top of a multi-year drought hampers water supply replenishment and perpetuates dry soils and vegetation, all of which continue to stress water storage and water supply management. Over the past year, the region has enacted additional drought response actions, including California Governor Newsom’s Water Strategy, Nevada Governor Sisolak’s ‘Climate Change Threatens Nevada with Aridification’ proclamation, a resolution by the Metropolitan Water District of Southern California, funding, and emergency regulations by the California State Water Board. Lakes Powell and Mead also saw historically low water levels and forecasts, instigating action, including modified operations and funding.
Impacts continue to amass as the drought continues, including impacts on water supply and costs leading to water restrictions (e.g., southern California started June 1) and reduced water allocations (e.g., Central Valley Project). The drought has also impacted energy (e.g., hydropower); agriculture (see CMOR and USDA drought declarations); recreation (e.g., skiing, fishing, hunting, park closures, water sports); and ecosystems (e.g., fuels for wildfire, harmful algal blooms, fisheries, and wildlife, such as migrating birds). The economic impacts of the 2021 drought on California totaled an estimated $1.7 billion (UC Merced), and 2022 estimates are in progress.
Recent and Potential Drought Impacts
- Find additional impacts through the National Drought Mitigation Center’s Drought Impact Reporter.
Water Supply Impacts
- In early October, California water agencies proposed to take voluntary action to reduce their water use by 1/10th starting in 2023 (AP).
- The Bureau of Reclamation’s Central Valley Project began Water Year 2023 with 3.6 million acre-feet of water in storage—one of the lowest starting points in recent years.
- In September, Department of the Interior officials at the Colorado River Symposium announced new steps to address the Colorado River Basin drought crisis. They also recently announced new drought mitigation funding opportunities.
- In August, 618 water waste complaints came into the MyLA311 (Los Angeles) system, marking a fifth month of a record number of calls. Sacramento also saw an uptick in complaints.
- Coalinga, California may run out of water by December, prompting discussions of costly purchased water.
- More than 1,200 wells have run dry this year in California, a ~50% increase over the same period last year.
Agricultural Impacts
- A recent Condition Monitoring Observer Report (CMOR) from Contra Costa County, California said ranchers are feeding cattle almost year round or downsizing/selling.
- Drought impacts on California produce such as tomatoes, onions, and winter leafy greens are adding pressure to grocery prices. Tomato forecasts were recently cut 10% from earlier forecasts by the USDA.
- USDA crop acreage data from August reported the number of unplanted crop acres in California—land where farmers had intended to plant a crop but were prevented from doing so by a natural disaster—as 532,000 acres (7% of the state’s cropland), an increase of 112,000 from 2021. Mostly acres came from cotton and rice, and the acreage is yet lower than the height of the previous drought in 2014–2015.
Wildlife and Ecosystem Impacts
- Supplemental water has been provided for Tule elk at Point Reyes National Seashore for the second straight year.
- Fir trees are perishing in greater numbers and faster in the Lake Tahoe Basin due to drought stress (Newsweek). In September, Napa County, California declared a local state of emergency due to high tree mortality from drought.
- The Mosquito Fire, which began in early September and is California's largest wildfire this year, is 95% contained and has burned 76,788 acres. Lake Tahoe and nearby areas were engulfed in smoke, and locals have nicknamed September ‘smoke season’ with notable impacts on tourism (WSJ).
Other Impacts
- Drought revealed a World War II-era boat at Shasta Lake, but how the boat came to be in Shasta Lake and sank is a mystery.
- Temecula, California's annual Big Horse Corn Maze was canceled due to heat- and drought-stunted corn growth.
Drought and Climate Outlook
El Niño–Southern Oscillation (ENSO)
NOAA’s ENSO alert system status is currently a La Niña Advisory. There is a 75% chance of La Niña during the Northern Hemisphere winter (December–February) 2022–23, with a 54% chance for ENSO-neutral in February–April 2023. For more information, check out the NOAA ENSO blog and how La Niña impacts the Western U.S.
Subseasonal to Seasonal Drought, Temperature, Precipitation, and Fire Outlooks
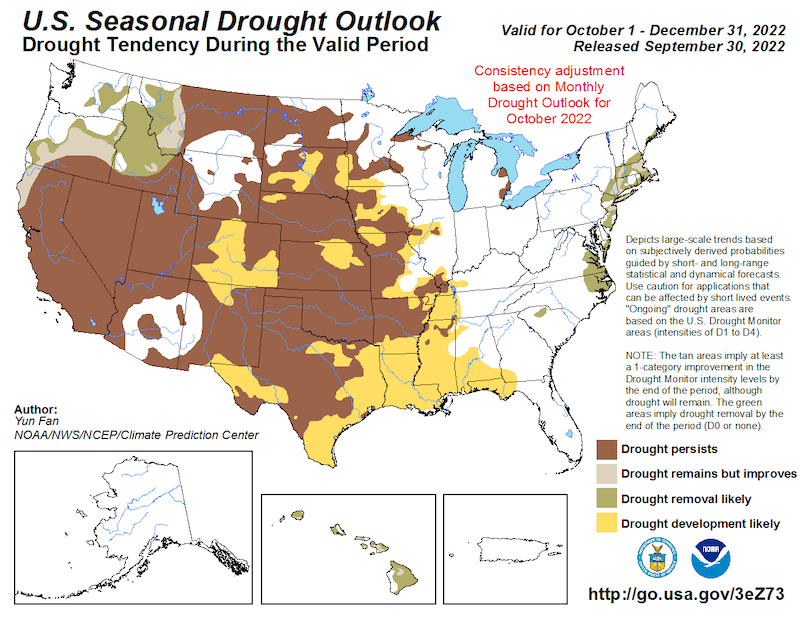
The late autumn and early winter months are a highly transitional time of year, as the wet season begins to ramp up along the West Coast. The next one-to-three month forecast shows drought persisting across California and the Great Basin, given the La Niña advisory. However, an increasingly wet climatology through the late fall and early winter favors improvement across parts of Oregon, Washington, and coastal northern California. Historically, La Niña is associated with dry to normal conditions in the southern part of California and Nevada. The September-October-November outlook from the National Weather Service's Climate Prediction Center also favors above-normal temperatures for the region. In the near term (1–2 weeks), there is likely landfalling atmospheric river, but strength and landfall location is unknown.
Seasonal Drought Outlook: October 1–December 31, 2022
Seasonal (3-Month) Temperature and Precipitation Outlooks
Likelihood and Timing of Atmospheric River Conditions
Drought Early Warning Resources
Prepared By
Amanda Sheffield
California-Nevada DEWS Regional Drought Information Coordinator, NOAA's National Integrated Drought Information System (NIDIS), Cooperative Institute for Research in Environmental Sciences (CIRES)
Julie Kalansky
Program Manager, California-Nevada Applications Program (A NOAA CAP/RISA team)
This drought status update is issued in partnership between the National Oceanic and Atmospheric Administration (NOAA), the California-Nevada Adaptation Program, a NOAA CAP/RISA team, and the Western Regional Climate Center at the Desert Research Institute to communicate the current state of drought conditions in California-Nevada based on recent conditions and the upcoming forecast. NIDIS and its partners will issue future drought status updates as conditions evolve.