A Bomb Cyclone and Powerful Atmospheric River Just Hit Parts of the West. What Does This Mean for Drought?
View the October 25 Pacific Northwest Drought and Climate Outlook Webinar.
Register for the November 22 CA-NV Drought and Climate Outlook Webinar.
Key Points
- An exceptional (AR 5) atmospheric river (AR) recently brought rain, snow, and wind to the western U.S. While October ARs occur routinely, this early storm was unusually strong.
- This AR and recent storms improved drought conditions but did not come close to ending the drought for the region. The current drought developed over many months to years, leaving soils parched. Greater than normal winter precipitation will be needed to replenish this soil moisture deficit and deliver normal spring streamflows.
- Despite the possibility of alleviating drought, intense storms, like the recent AR, can also trigger flooding, dangerous travel conditions, and debris flows, especially in areas burned by recent large and severe fires.
- Recent storms, including this exceptional AR, were much needed. However, autumn storms do not necessarily mean that the rest of the winter will be wet. Continued precipitation throughout the upcoming winter months will be critical to drought relief.
The U.S. Drought Monitor (USDM) is updated each Thursday to show the location and intensity of drought across the country. Drought categories show experts’ assessments of conditions related to dryness and drought including observations of how much water is available in streams, lakes, and soils compared to usual for the same time of year.
California/Nevada conditions as of October 26, 2021:
- 100% of California is experiencing Moderate (D1) to Exceptional (D4) Drought (44.59% in D3, 38.74% in D4)
- California population in drought: 37,253,956
- 100% of Nevada is experiencing Moderate (D1) to Exceptional (D4) Drought (33.01% in D3, 25.02% in D4)
- Nevada population in drought: 2,700,551
The U.S. Drought Monitor (USDM) is updated each Thursday to show the location and intensity of drought across the country. Drought categories show experts’ assessments of conditions related to dryness and drought including observations of how much water is available in streams, lakes, and soils compared to usual for the same time of year.
Pacific Northwest conditions as of October 26, 2021:
- 98.66% of Oregon is experiencing Moderate to Exceptional Drought (D1-D4) (46.77% in D3, 25.34% in D4)
- Oregon population in drought: 3,785,390
- 64.84% of Washington is experiencing Moderate to Exceptional Drought (D1-D4) (15.41% in D3, 18.29% in D4)
- Washington population in drought: 2,007,135
- 100% of Idaho is experiencing Moderate to Exceptional Drought (D1-D4) (39.86% in D3, 14.57% in D4)
- Idaho population in drought: 1,567,582
The U.S. Drought Monitor (USDM) is updated each Thursday to show the location and intensity of drought across the country using a five-category system, from Abnormally Dry (D0) conditions to Exceptional Drought (D4).
This map shows where drought has improved, remained the same, or worsened across the West from October 19 to October 26, 2021. Learn more.
U.S. Drought Monitor Categories
U.S. Drought Monitor Categories
Classes Drought Has Degraded/Improved Since Last Week
The U.S. Drought Monitor (USDM) is updated each Thursday to show the location and intensity of drought across the country. Drought categories show experts’ assessments of conditions related to dryness and drought including observations of how much water is available in streams, lakes, and soils compared to usual for the same time of year.
California/Nevada conditions as of October 26, 2021:
- 100% of California is experiencing Moderate (D1) to Exceptional (D4) Drought (44.59% in D3, 38.74% in D4)
- California population in drought: 37,253,956
- 100% of Nevada is experiencing Moderate (D1) to Exceptional (D4) Drought (33.01% in D3, 25.02% in D4)
- Nevada population in drought: 2,700,551
The U.S. Drought Monitor (USDM) is updated each Thursday to show the location and intensity of drought across the country. Drought categories show experts’ assessments of conditions related to dryness and drought including observations of how much water is available in streams, lakes, and soils compared to usual for the same time of year.
Pacific Northwest conditions as of October 26, 2021:
- 98.66% of Oregon is experiencing Moderate to Exceptional Drought (D1-D4) (46.77% in D3, 25.34% in D4)
- Oregon population in drought: 3,785,390
- 64.84% of Washington is experiencing Moderate to Exceptional Drought (D1-D4) (15.41% in D3, 18.29% in D4)
- Washington population in drought: 2,007,135
- 100% of Idaho is experiencing Moderate to Exceptional Drought (D1-D4) (39.86% in D3, 14.57% in D4)
- Idaho population in drought: 1,567,582
The U.S. Drought Monitor (USDM) is updated each Thursday to show the location and intensity of drought across the country using a five-category system, from Abnormally Dry (D0) conditions to Exceptional Drought (D4).
This map shows where drought has improved, remained the same, or worsened across the West from October 19 to October 26, 2021. Learn more.
NOAA GOES17 Satellite Images of Record Pacific Cyclone

Recent atmospheric rivers (NOAA: What is an atmospheric river?) have brought precipitation to the western U.S. Most of the precipitation was beneficial, helping to alleviate fire weather and improve existing drought conditions. The historically strong low-pressure system off the coast of Washington and associated atmospheric river (AR) delivered record amounts of precipitation to parts of California and Nevada. In this special edition drought status update, we provide a brief overview of the event and answer what it might mean for drought.
How Much Precipitation Has Fallen and Where?
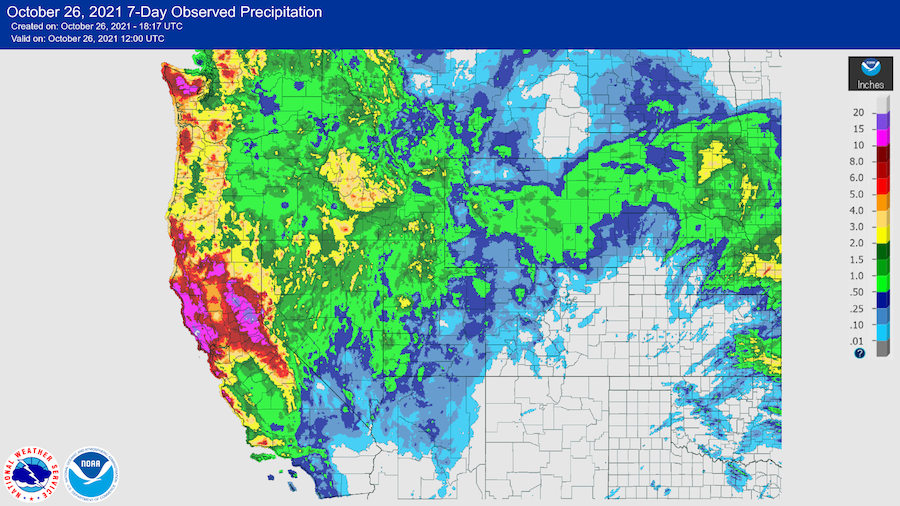
The recent exceptional atmospheric river (AR 5) brought rain, snow, and wind to parts of the western U.S., from the California coast inland into Idaho and Nevada. The Center for Western Weather and Water Extremes has published a full summary of the AR event (October 19–26). Local CoCoRaHS precipitation observations can be found here. While October ARs occur routinely, this early storm was unusually strong. This AR temporarily increased local runoff and streamflow while wetting soils, which can make future runoff more efficient this winter and help increase runoff next spring. While snowpack is well above average in parts of the West, it is very early in the water year, and snow needs to continue to accumulate during the winter to contribute to spring and summer runoff.
Notable Records:
- October 24: Washington coast Pacific cyclone low pressure record of 942 mb.
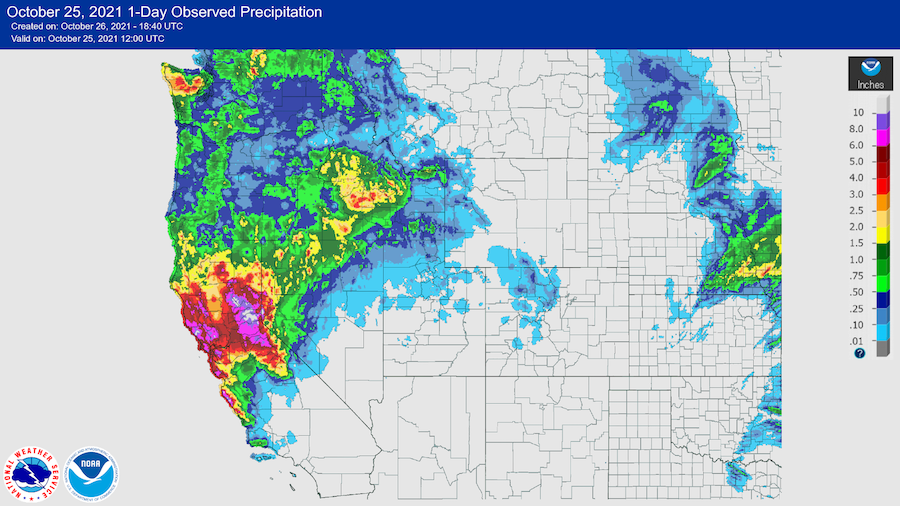
- October 25: Several 24-hour rainfall records were broken. For example, downtown Sacramento set an all-time 24-hour rainfall total of 5.44 inches, breaking the old record of 5.28 inches set back in 1880. This amount of precipitation was >69% of the 2021 Water Year total for this location.
- October 24-25: The Reno airport's 2-day rainfall total of 2.92 inches was the highest ever for October, and just shy of the 2021 Water Year total (3.01 inches).
- Lake Tahoe rose 6 inches in one day from this event, which has never occurred in the records back to 1958, bringing the water level back above the natural lake rim.
1-Day Observed Precipitation Totals: October 25, 2021
7-Day Observed Precipitation Totals: October 26, 2021
What Does This Mean for Drought?
While this AR and recent smaller storms improved drought conditions, they did not come close to ending the drought. The current drought developed over many months to years and has persisted, in some parts of the West, since early 2020.
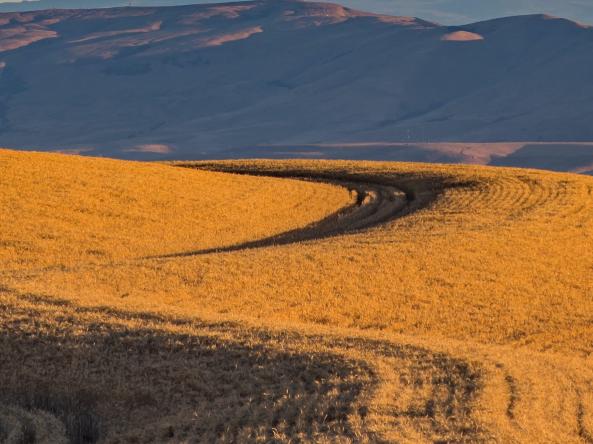
In the short term, the benefits from these extraordinary storms include a reduction of fire weather and wetting of soils. Additionally, the early timing relative to winter may benefit crops like winter wheat. Wetting soils prior to snowpack accumulation can lock in moisture for next spring if the ground freezes. In the past two years, the lack of autumn wetting contributed to the limited spring runoff in the Sierra Nevada.
The impacts of long-term drought are often slow to build and recover, and can vary by location and type of drought. Severe hydrologic and ecological drought indicators such as depleted groundwater aquifers and reservoirs and changes in the condition of plants (like trees), ecosystem processes, and wildlife can take months to years of normal to above-normal precipitation to recover. There is no one-size-fits-all drought ending or recovery process.
Despite the possibility of alleviating drought, intense storms, like the recent AR, can also trigger flooding, dangerous travel conditions, and debris flows, especially in areas burned by recent large and severe fires.
Why Isn’t the Drought Over?
Much of the drought across the West has developed over months to years. While this AR provided beneficial precipitation, groundwater levels across the western U.S. remain low, and storage in many reservoirs remains below normal. In California, most reservoirs are below historical averages. Lake Oroville, for example, rose ~170,000 acre-feet from these storms, but to get to median levels for this time of year, when reservoirs are typically at the lowest levels for the year, it needs yet another million acre-feet. Although short-term rain events replenish soil moisture near the surface, it can take months or years for that water to percolate into deep groundwater aquifers. Large precipitation deficits remain. In addition, whether precipitation arrives as rain or snow (due to temperature) influences how much water can be stored for the coming dry season. Although evaporative demand (i.e., the thirst of the atmosphere) is lower during the cooler winter months, warm spells can start to dry out soils and evaporate water from reservoirs, streams, and the snowpack. Additionally, the recent drought is stacked on top of the impacts of warming and dryness that have occurred over the last decade and longer.
After this exceptional AR, large amounts of precipitation are still needed to end the drought in this region. Parts of California and Nevada are missing one-half to a full water year’s worth of precipitation (some places are missing as much as 1.5 years' worth). At the start of the water year, the State of California Department of Water Resources reported that 140% of average annual statewide precipitation would be needed to achieve average statewide runoff, according to the U.S. Geological Survey Basin Characterization Model, reflecting the moisture deficit in the climate system.
Could This Be the Start of a Wet Winter?
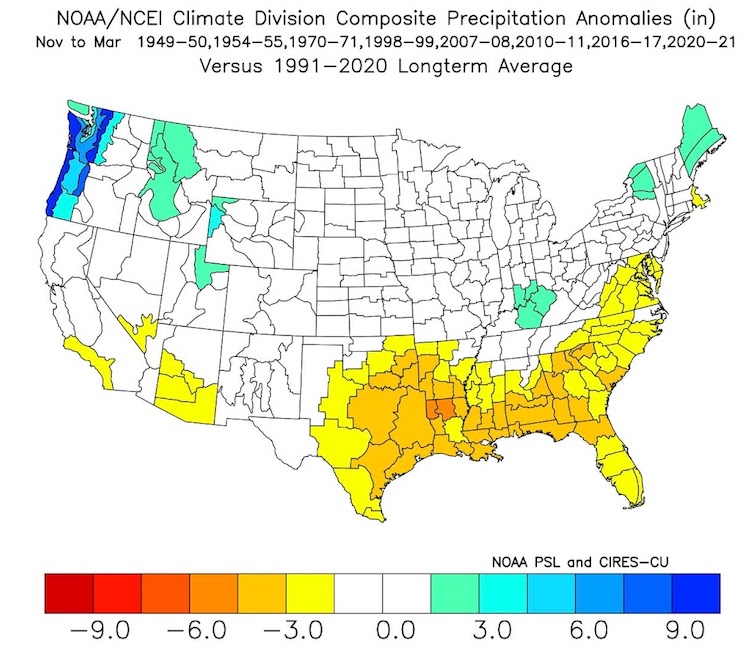
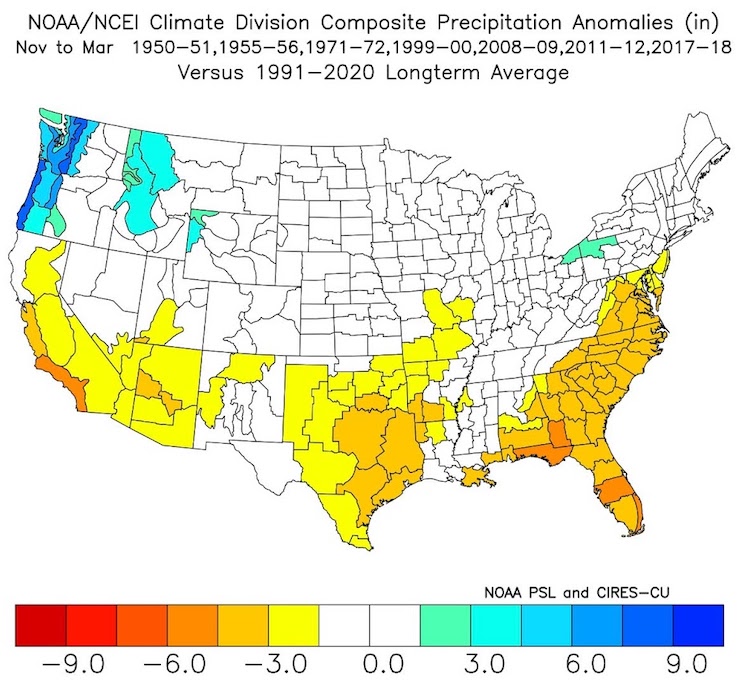
Recent storms, including this exceptional AR, were much needed. Storminess this early in the water year is not indicative of the amount of precipitation that accumulates over the winter storm season. A second year of La Niña is here, which, more often than not, means below-normal precipitation in the southern tier of the Southwest and above-normal precipitation in some of the Pacific Northwest. But the expected effects on the western U.S. are not guaranteed. Historical composites from the seven back-to-back La Niña events on record illustrate that during a second La Niña year, the areas that benefitted the most from increased precipitation are those that are already showing some recovery from the current drought (the Pacific Northwest on the western side of the Cascades and Rocky Mountains).
The typically wettest winter months are yet to come, and precipitation during those months is necessary to help relieve the drought. Seasonal forecast skill for this crucial period at this time is low and reflects a typical La Niña pattern. More forecast data and maps can be found here. Relief or intensification of drought along the West Coast and inland will depend on the frequency, strength, and trajectory of storms such as ARs, as well as on whether a robust snowpack develops.
November–March Precipitation Anomalies from 7 Back-to-Back La Niña years
Drought Early Warning Resources
Prepared By
Amanda Sheffield
California-Nevada DEWS Regional Drought Information Coordinator, NOAA/NIDIS, CIRES
Britt Parker
Pacific Northwest DEWS Regional Drought Information Coordinator, NOAA/NIDIS, CIRES
Adam Lang
Communications Coordinator, NOAA/NIDIS, CIRES
Elizabeth Ossowski
Program Coordinator, NOAA/NIDIS, CIRES
Andrea Bair, Alan Haynes, and Jonathan Rutz
National Weather Service
Dan Cayan and Michael Dettinger
California Nevada Applications Program (CNAP), Scripps Institution of Oceanography
David Hoekema
Idaho Department of Water Resources
Erica Fleishman
Oregon Climate Change Research Institute (OSU)
Holly Prendeville
USDA Northwest Climate Hub
Jeff Marti
Washington Department of Ecology
Karin Bumbaco and Nicholas Bond
Office of the Washington State Climatologist
Michael Anderson
California State Climatologist, California Department of Water Resources
Roger Gorke
U.S. Environmental Protection Agency
Russell Qualls
University of Idaho
Russell Vose
NOAA National Centers for Environmental Information
Ryan Andrews
Oregon Department of Water Resources
Steph McAfee
Nevada State Climatologist, University of Nevada, Reno
This special edition drought status update is issued with partners from across the Pacific Northwest and California-Nevada Drought Early Warning Systems to communicate the current state of drought conditions in the five most western CONUS states based on recent conditions and the upcoming forecast. NIDIS and its partners will issue future drought updates as conditions evolve.