Low Precipitation and High Evaporative Demand Hammered the Region that was Already Reeling from Intense Drought.
Register here for the November 22 California–Nevada Drought and Climate Outlook Webinar.
Key Points
- After 2 water years of dry conditions, both California and Nevada remain 100% in moderate-to-exceptional drought.
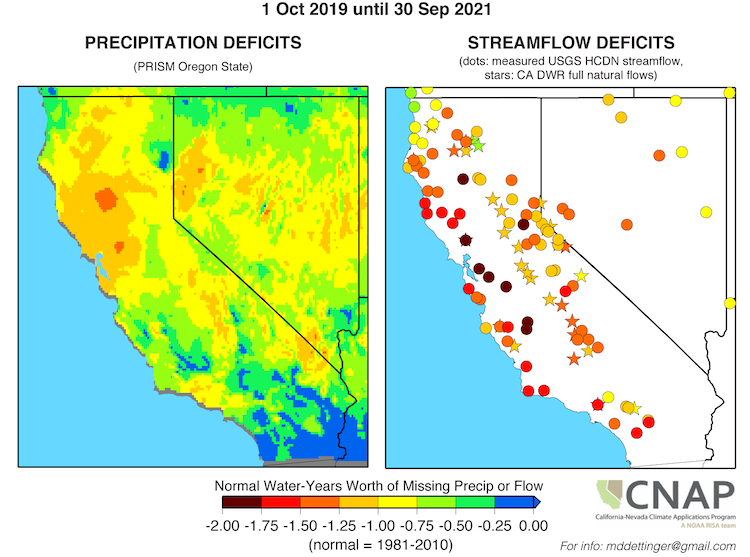
- Over much of California and Nevada, the precipitation deficit—from a lack of large storms such as atmospheric rivers—for these past two years is between 0.5 to 1 water year's worth of precipitation.
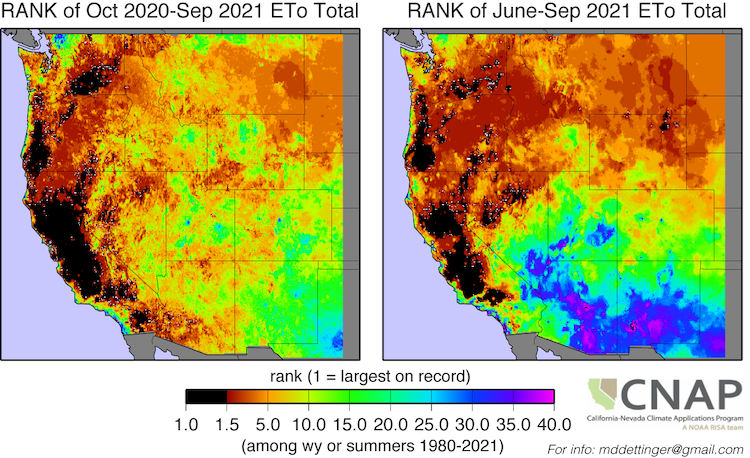
- Excess and near-record evaporative demand occurred in Water Year 2021. Since the beginning of the current drought in Water Year 2020, evaporative demand is greater or nearly equal to the precipitation deficit for 60% of the region.
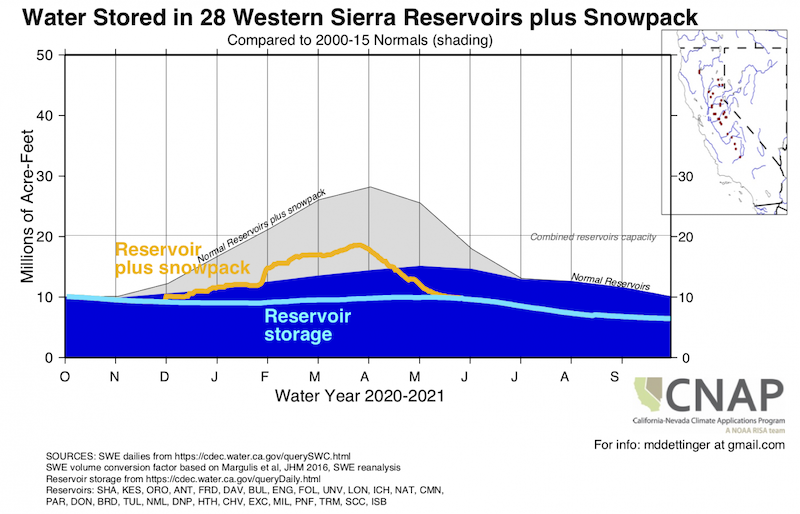
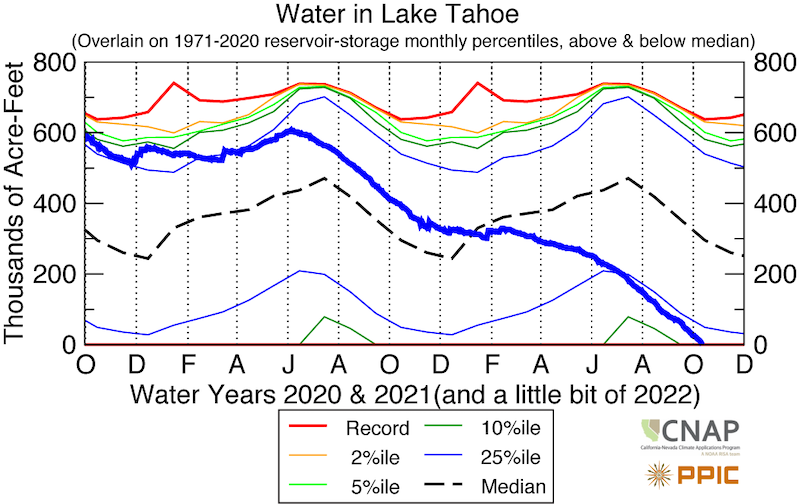
- Reservoirs throughout California and Nevada remain low. During Water Year 2021, the combined storage in 28 Western Sierra reservoirs declined from 9.91 million acre-feet to 6.44 million acre-feet. Lake Tahoe recently dropped below the rim limiting outflow.
- Approximately 2.5 million acres have burned this year in California as of mid-October—a vast majority of which occurred in forested portions of northern California.
- La Niña has developed and is expected to continue into the winter. Historically, La Niña is associated with dry to normal conditions in the southern part of California and Nevada.
- Drought impacts (e.g., pasture conditions, ecosystem health, water supply, recreation, fire potential) have intensified and expanded given back-to-back dry years. Drought preparedness is key.
The U.S. Drought Monitor (USDM) is updated each Thursday to show the location and intensity of drought across the country. Drought categories show experts’ assessments of conditions related to dryness and drought including observations of how much water is available in streams, lakes, and soils compared to usual for the same time of year.
California/Nevada conditions as of October 12, 2021:
- 100% of California is experiencing Moderate (D1) to Exceptional (D4) Drought (41.52% in D3, 45.66% in D4)
- California population in drought: 37,253,956
- 100% of Nevada is experiencing Moderate (D1) to Exceptional (D4) Drought (42.58% in D3, 25.02% in D4)
- Nevada population in drought: 2,700,551
U.S. Drought Monitor Categories
The U.S. Drought Monitor (USDM) is updated each Thursday to show the location and intensity of drought across the country. Drought categories show experts’ assessments of conditions related to dryness and drought including observations of how much water is available in streams, lakes, and soils compared to usual for the same time of year.
California/Nevada conditions as of October 12, 2021:
- 100% of California is experiencing Moderate (D1) to Exceptional (D4) Drought (41.52% in D3, 45.66% in D4)
- California population in drought: 37,253,956
- 100% of Nevada is experiencing Moderate (D1) to Exceptional (D4) Drought (42.58% in D3, 25.02% in D4)
- Nevada population in drought: 2,700,551
Current Conditions
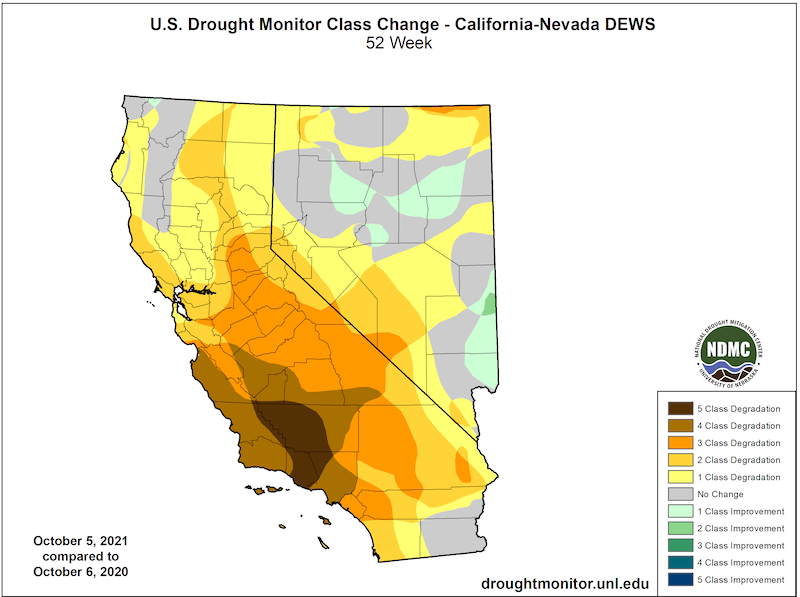
- According to the U.S. Drought Monitor, drought in California-Nevada hasn’t changed in the last 4 weeks. The region continues to be 100% in drought, compared to ~80% this time last year and ~3% at the start of Water Year 2020 (October 1, 2019).
- Drought has deepened throughout the region during Water Year 2021, with central California experiencing the greatest intensification of drought.
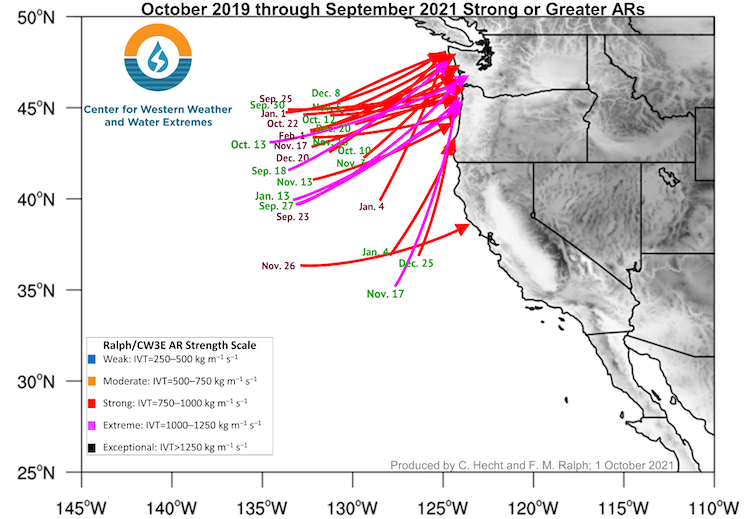
- The drought over the last two years has been caused by the lack of large storms, particularly atmospheric rivers. Through September, NOAA's National Centers for Environmental Information ranks the last 12 and 24 months as the driest in California since 1977 and in Nevada since 1960. Both states have had the driest 18 months on record.
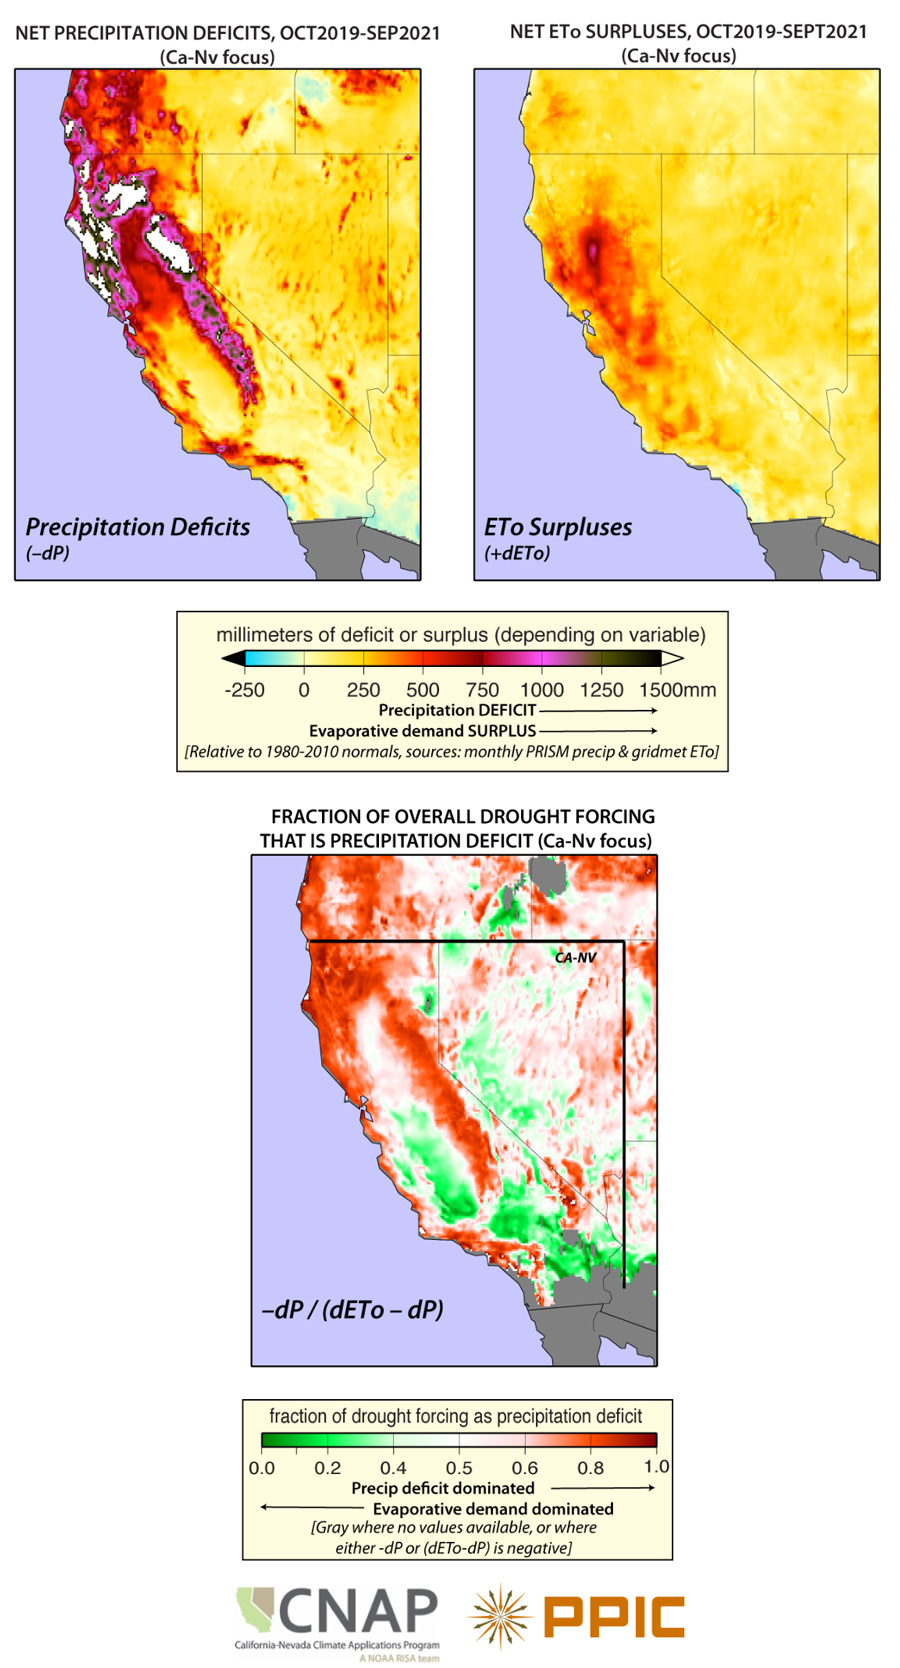
- The current drought is a combination of a precipitation deficit (0.5 to 1 water year's worth of precipitation) and a surplus of evaporative demand (the atmospheric conditions leading to the drying of the landscape). Since October 2019, the start of the current drought, in California and Nevada evaporative demand has dominated the drought over 21% of the region, and is about equal to the precipitation deficit in 39% of the region. For much of California, the 2021 Water Year has had the highest evaporative demand in the last 40 years.
- Water Year 2021’s snow drought was intensified by rapid melt out and low runoff efficiencies, challenging water and fire management, ecosystems, recreation and tourism, and more.
- As of October 12, more than 2.5 million acres have burned in California, By contrast, around 120 thousand acres have burned in Nevada so far this year, well below recent averages.
- Reservoirs remain low throughout the region, and low soil moisture is causing vegetative stress. The Central Valley Project began the 2022 Water Year with 3.21 million acre-feet of storage, one of the lowest starting points in recent years.
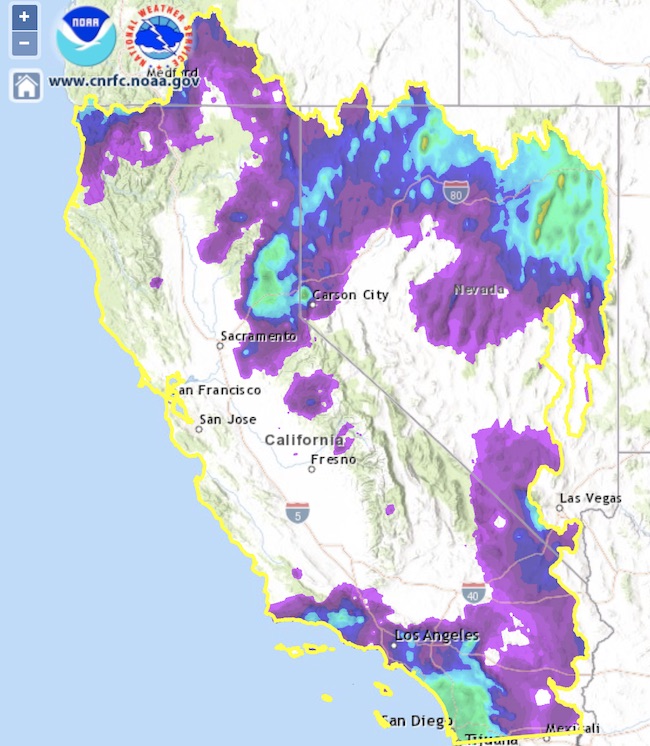
- Recent storms brought some fire relief to and moistened fuels near Truckee and in San Diego.
- For more detailed information, check out the Nevada Drought Update from the Nevada State Climatologist and the California Department of Water Resources’ Water Year 2021 brochure.
How Is Drought Affecting Your Neighborhood?
Click to see drought indicators, outlooks, and historical conditions by city, county, and state, and to sign up for U.S. Drought Monitor alert emails.
U.S. Drought Monitor Change Map: Water Year 2021
Strong or Greater Atmospheric Rivers: Water Years 2020–2021
Precipitation and Streamflow Deficits: Water Years 2020–2021
Evaporative Demand Rankings: 2021 Summer and Water Year
Precipitation Deficit and Surplus Evaporative Demand
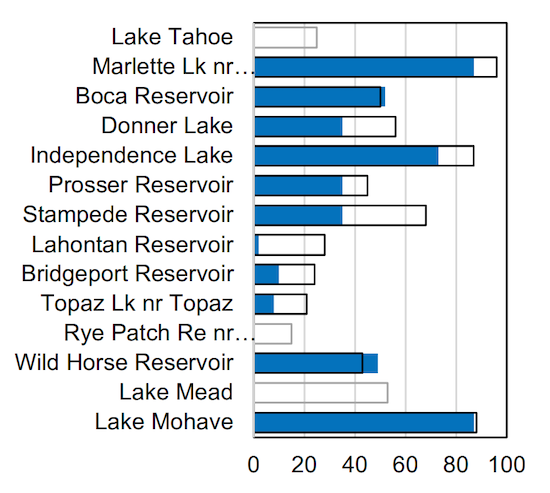
Nevada Reservoir Conditions
Western Sierra Water Storage + Snowpack
Lake Tahoe Water Storage: Water Years 2020–2021
Precipitation Totals: October 1–8, 2021
Water Year 2021 Drought Impact Summary
Over the past year, the region has enacted drought response actions, including funding, an emergency drought salinity barrier, curtailments in California, and a ban on non-functional grass in Nevada. Impacts accelerated as drought progressed, such as on water supply and cost, energy (e.g., hydropower); agriculture (see CMOR and USDA drought declaration); recreation (e.g., skiing, fishing, hunting, park closures, water sports); and ecologically (e.g., fuels for wildfire, harmful algal blooms, fisheries and wildlife support). A full assessment of impacts, including economical impacts, is yet to be calculated.
Recent Drought Impacts
- Find additional impacts at the National Drought Mitigation Center's Drought Impact Reporter.
- Condition Monitoring Observer Reports (CMOR) over the past few weeks highlight less water for irrigation, reduced yield, plant stress, reduced pasture and forage and grazing, supplemental feeding, animal stress, reduced stock weights, and sold livestock.
Water Supply Impacts
- October 12: Low water levels triggered curtailments of water right holders in Mill and Deer Creeks.
- There is a potential for 0% State Water Project allocations in 2022.
- The California Department of Water Resources awarded $28 million in small community drought relief funding to 15 communities.
- Due to dry wells in California, water filling stations are being opened, as well as bottled water supplies.
- Some Pt. Reyes residents are getting alternative water due to elevated levels of salt in tap water.
- The Klamath Project Drought Response Agency announced a second Drought Relief Program in late September.
- Low levels of Shasta Reservoir are revealing 112-year-old freight train derailment wreckage.
Agricultural Impacts
- Alhambra Valley pear producers reported just 25% of the usual amount.
- Some pumpkin farmers are reporting reduced crops due to low water supplies, potentially limiting variety and increasing prices.
- California’s rice growers in the Sacramento Valley planted 20% less rice, or 100,000 acres, this spring because they did not anticipate having enough water.
- Kings County dairy farmers are reporting increased feed and operations costs due to the drought, such as for imported feed from other states, which are having drought problems of their own.
Wildlife & Ecosystem Impacts
- Millions of gallons of water were transported by helicopter in Anza Borrego Desert State Park to keep endangered Peninsular Bighorn Sheep and other desert wildlife alive as water sources dried.
- 80% of endangered winter-run Chinook salmon in the Sacramento River could die this year.
- Bear sightings are up in Carson City, Nevada and nearby valleys.
- The Lake Tahoe Kokanee Salmon Festival was cancelled as low water levels are expected to prevent the salmon from spawning.
- More sequoias may have been damaged than originally thought due to recent wildfires, but the full extent of the damage won’t be known for months.
Energy Impacts
- So far this year, California’s hydropower generation has been on the lower end of its 10-year average. Overall U.S. hydropower is expected to decline 14% due to drought (U.S. Energy Information Administration).
- Drought in the Bay Area allowed dust and dirt to accumulate on power lines and transformers, which combined with recent light showers to form mud and cause power outages.
- Temporary power generators are now online as of the end of September to support California’s electricity grids (California Department of Water Resources).
Report Your Drought Impacts
Drought and Climate Outlook
El Niño/Southern Oscillation (ENSO)
NOAA’s ENSO alert system status is currently a La Niña Advisory. La Niña conditions have developed and are expected to continue with an 87% chance of La Niña in December 2021–February 2022. For more information, please check out the NOAA ENSO blog.
Subseasonal to Seasonal Drought, Temperature, and Precipitation Outlooks
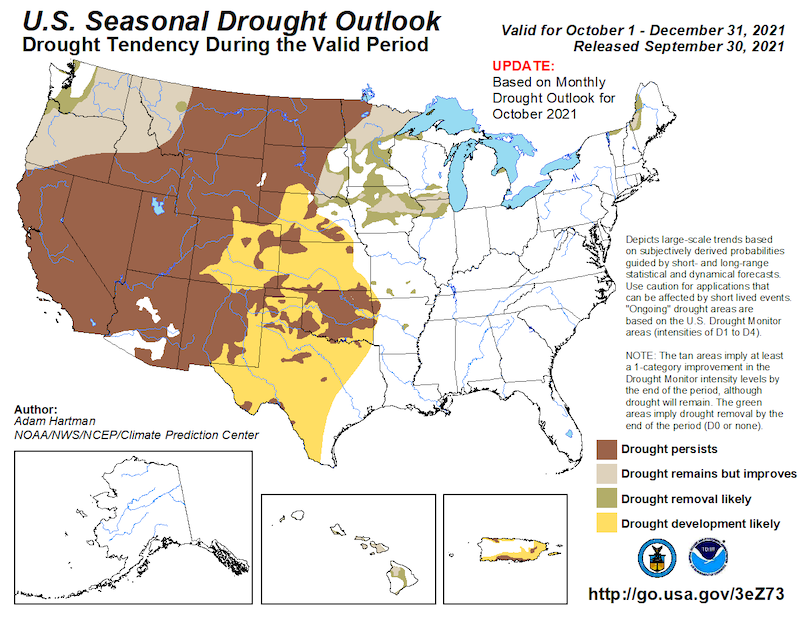
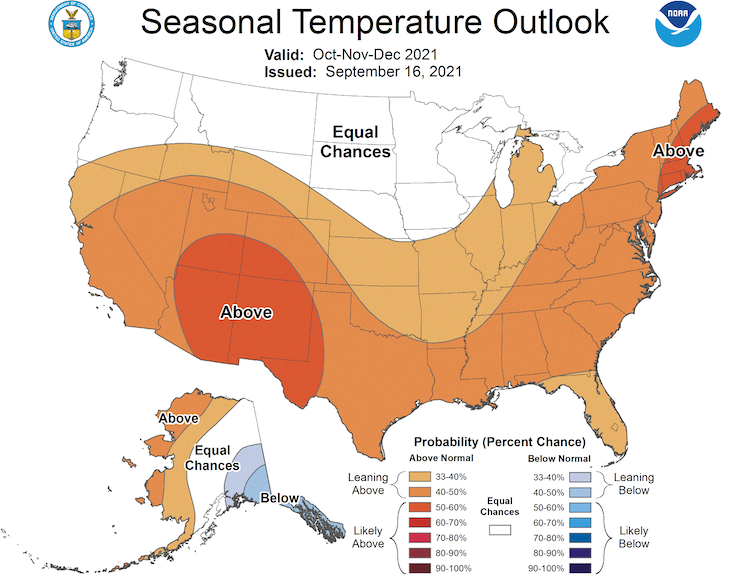
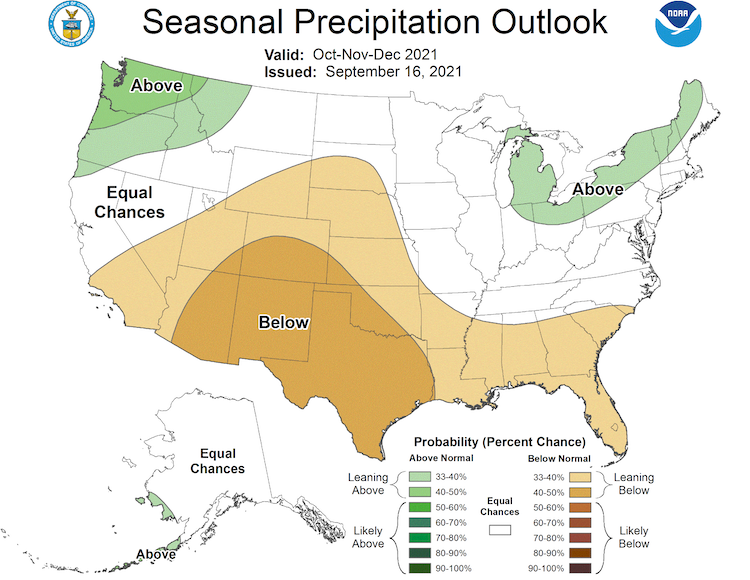
The next one-to-three month forecast shows drought persisting across California and the Great Basin, as forecasts increasingly reflect the potential for La Niña development into the fall and winter. Historically, La Niña is associated with dry to normal conditions in the southern part of California and Nevada. The October-November-December outlook from the National Weather Service's Climate Prediction Center also favors above-normal temperatures for the region. Check out the Western Regional Climate Center handout on La Niña impacts for the West.
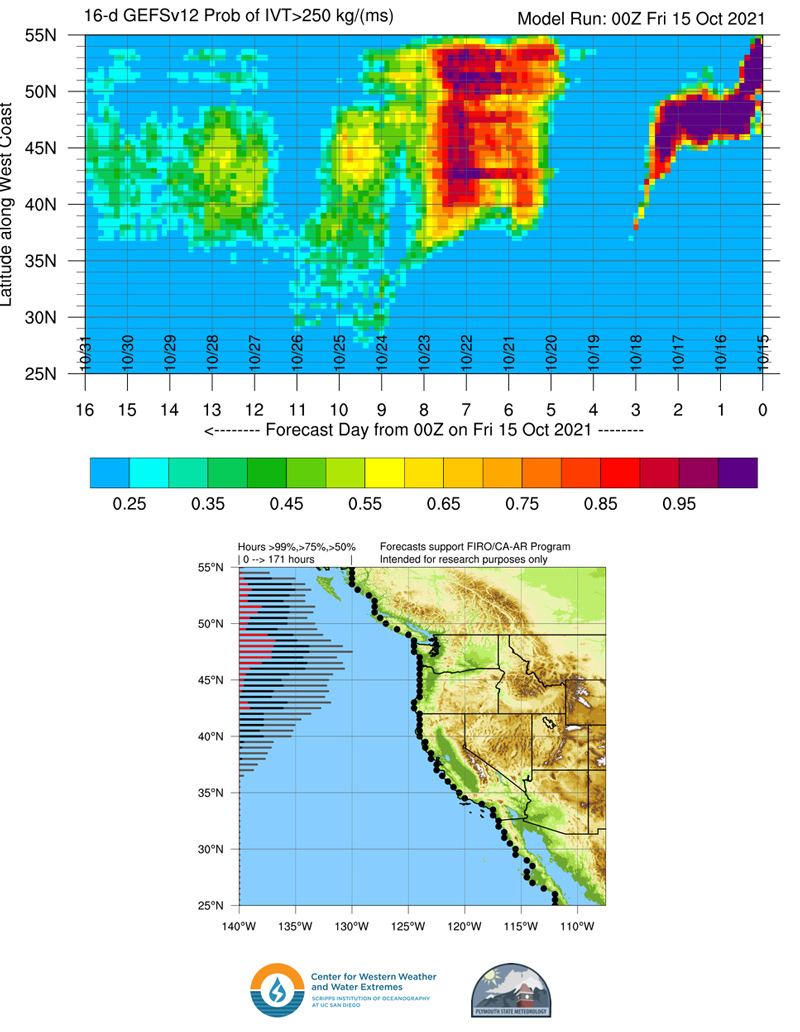
In the near term, a period of very active weather is forecasted to impact the U.S. West Coast (Northern California and the Pacific Northwest), with a series of landfalling atmospheric rivers becoming increasingly likely during October 20–24. Read more at CW3E.
Seasonal Drought Outlook: October 1–December 31, 2021
Temperature and Precipitation Outlooks: October–December 2021
Likelihood and Timing of Atmospheric River Conditions
Significant Wildland Fire Potential Outlook
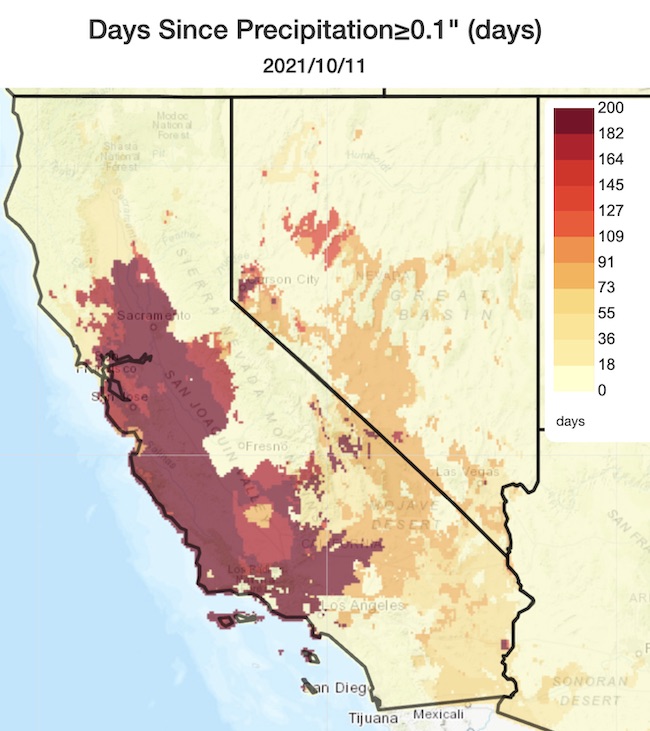
Recent precipitation in Southern California and portions of the Sierra Nevada, combined with cooler-than-normal temperatures in the past week, have tempered large wildfire potential in these regions. Larger fuels in forests of the state (e.g., 1,000-hour fuels) are still drier than normal given the compound hot-dry conditions of the past year. Outside of a few portions of California, many locations have gone more than 200 days since the last wetting rain (daily precipitation exceeding 0.1 inch) and have not seen a fire season-ending precipitation event. Offshore wind events remain a critical fire weather concern for California.
There are increasing odds of a significant autumn precipitation event next week in northern California. Such widespread, long-duration precipitation events measurably allow fuel moistures to increase. While the working definition of a fire season-ending precipitation event is ambiguous, large wildfires are much more rare following significant precipitation events that raise 100- and 1,000-hour fuel moisture levels.
Days Since Last > 0.1-inch Precipitation Event
Drought Early Warning Resources
California Nevada California-Nevada DEWS
Prepared By
Amanda Sheffield
California-Nevada DEWS Regional Drought Information Coordinator, NOAA/NIDIS, CIRES
Email: amanda.sheffield@noaa.gov
Julie Kalansky
Program Manager, California-Nevada Climate Applications Program (a NOAA RISA team)
Email: jkalansky@ucsd.edu
John Abatzoglou
UC Merced, California-Nevada Climate Applications Program (a NOAA RISA team)
Email: jabatzoglou@ucmerced.edu
This drought status update is issued in partnership between the National Oceanic and Atmospheric Administration (NOAA), the California-Nevada Climate Applications Program, a NOAA RISA team, and the Western Regional Climate Center at the Desert Research Institute to communicate the current state of drought conditions in California-Nevada based on recent conditions and the upcoming forecast. NIDIS and its partners will issue future drought updates as conditions evolve.