Region Transitions from Dry Winter to Dry Spring with Dry Soils, Rapid Snowmelt, and Intensified and Expanded Drought Impacts.
Key Points
- After two water years of dry conditions, ~96% of California and Nevada is in moderate-to-exceptional drought. As of March, the last 18 months have been the second driest on record for both states.
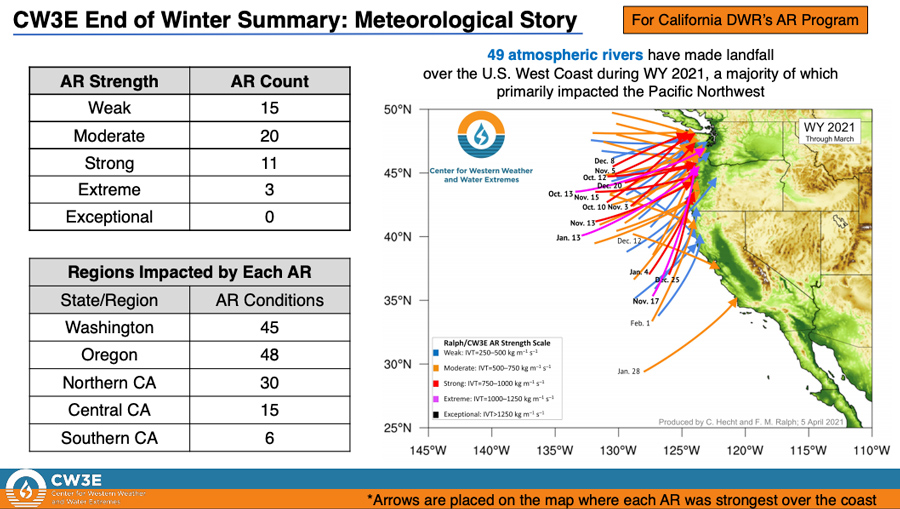
- Abnormally dry conditions this winter were driven by a lack of landfalling atmospheric rivers and persistent ridging/blocking over the Northeast Pacific Ocean.
- Precipitation totals remain well below normal, and below-normal snowpack is melting rapidly. Dry soils are expected to reduce runoff, and vegetation is showing stress.
- A warmer than normal summer is forecasted. Though many areas are currently showing record or near record fuel dryness, significant fire potential for many areas in California is expected to become above normal starting in July and continuing through the summer. Above-normal significant fire potential is expected in some mid to higher elevation areas in far southern Nevada by late May.
- Drought impacts (e.g., pasture conditions, ecosystem health, water supply, recreation, fire potential) have intensified and expanded given back-to-back dry years. Drought preparedness is key.
The U.S. Drought Monitor (USDM) is updated each Thursday to show the location and intensity of drought across the country. Drought categories show experts’ assessments of conditions related to dryness and drought including observations of how much water is available in streams, lakes, and soils compared to usual for the same time of year.
California/Nevada conditions as of April 13, 2021:
- 94% of California is experiencing Moderate (D1) to Exceptional (D4) Drought (33% in D3, 5% in D4)
- California population in drought: 34,058,693
- 100% of Nevada is experiencing Moderate (D1) to Exceptional (D4) Drought (34% in D3, 40% in D4)
- Nevada population in drought: 2,700,553
U.S. Drought Monitor Categories
The U.S. Drought Monitor (USDM) is updated each Thursday to show the location and intensity of drought across the country. Drought categories show experts’ assessments of conditions related to dryness and drought including observations of how much water is available in streams, lakes, and soils compared to usual for the same time of year.
California/Nevada conditions as of April 13, 2021:
- 94% of California is experiencing Moderate (D1) to Exceptional (D4) Drought (33% in D3, 5% in D4)
- California population in drought: 34,058,693
- 100% of Nevada is experiencing Moderate (D1) to Exceptional (D4) Drought (34% in D3, 40% in D4)
- Nevada population in drought: 2,700,553
Current Conditions
- According to the U.S. Drought Monitor, drought conditions degraded in pockets of California, including central and coastal California. Nevada remains 100% in drought and currently has more area in exceptional drought (D4) than at any point during the 2012–2016 drought.
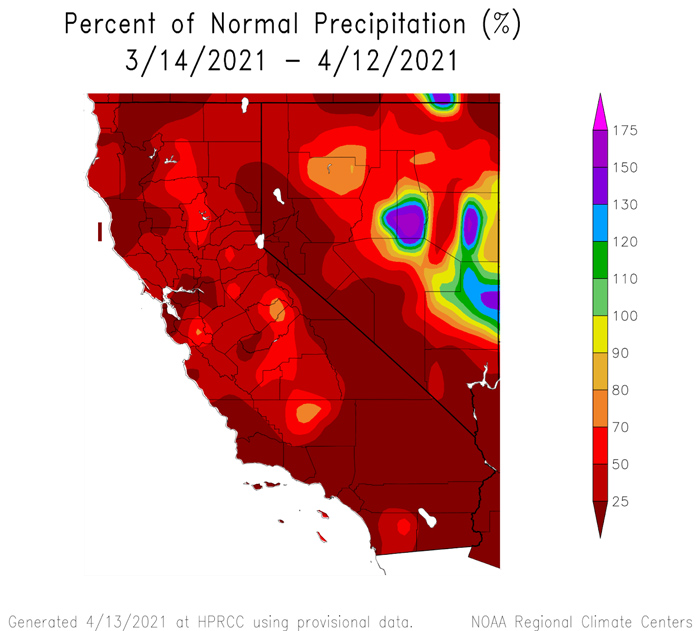
- With the exception of eastern Nevada, the last month was abnormally dry for the region with less than 25%–70% of normal precipitation.
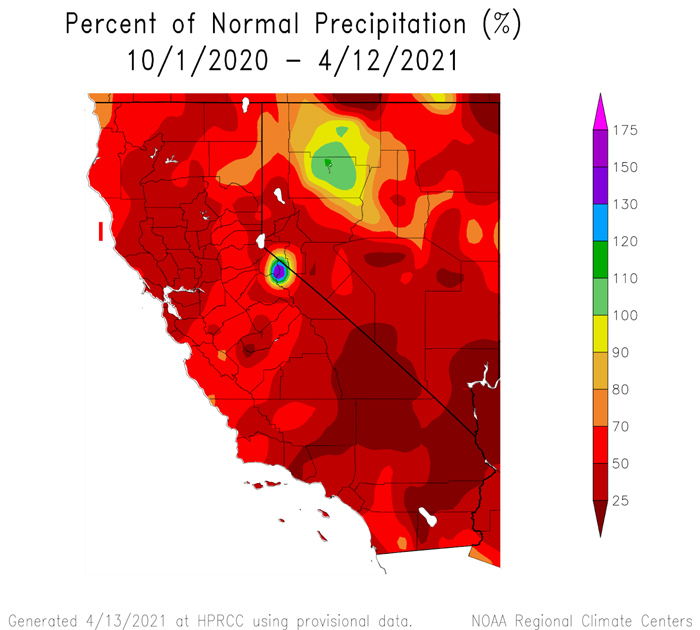
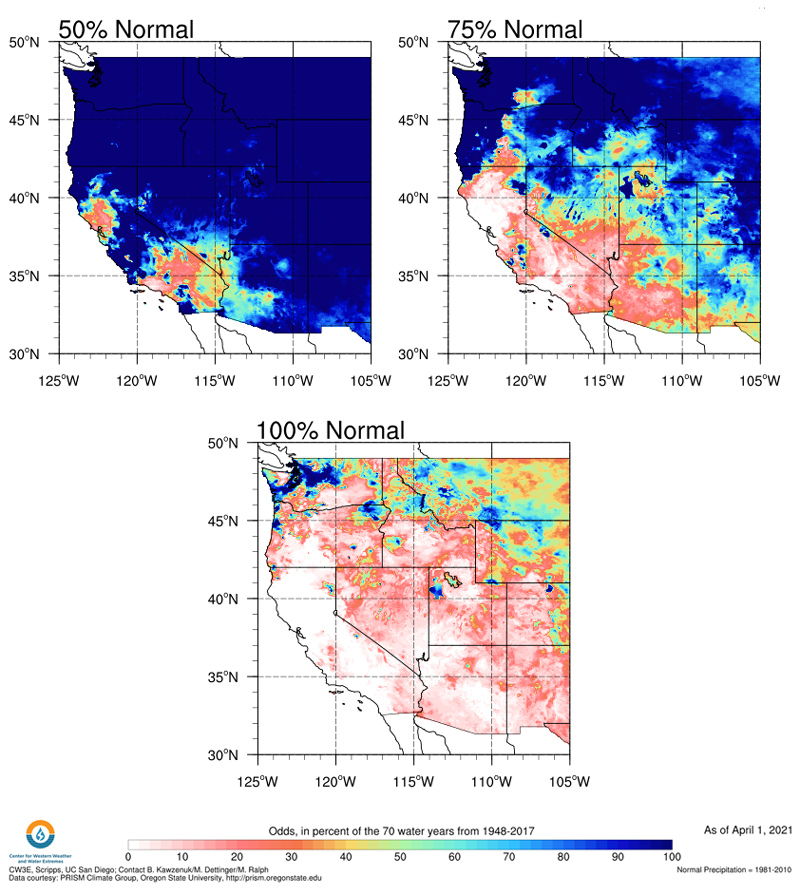
- According to NOAA's National Centers for Environmental Information, California experienced its third driest year on record, and second driest 18 months. Nevada had its driest year on record, and the second driest in 18 months. The historical odds of reaching normal precipitation this water year are 10% or less in many places throughout California and Nevada.
- According to CW3E, abnormally dry conditions this winter were driven by a lack of landfalling atmospheric rivers and persistent ridging/blocking over the Northeast Pacific Ocean (read more here).
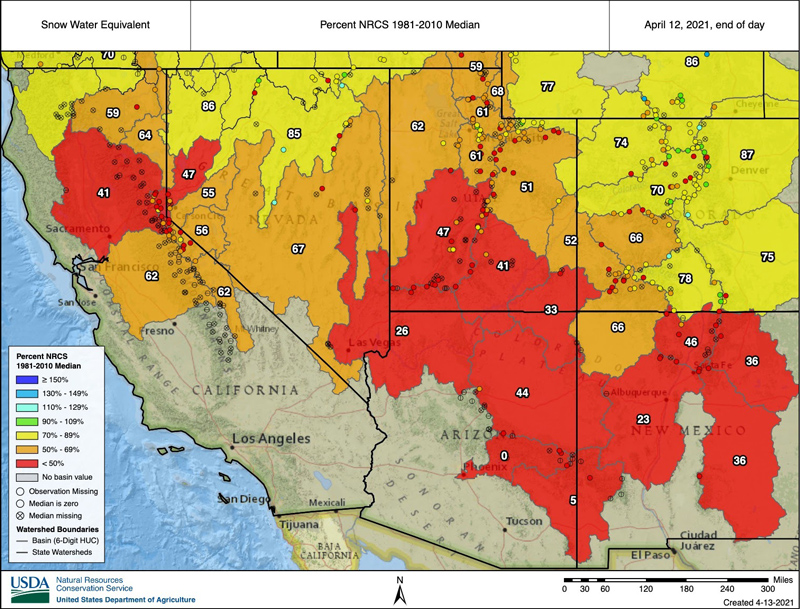
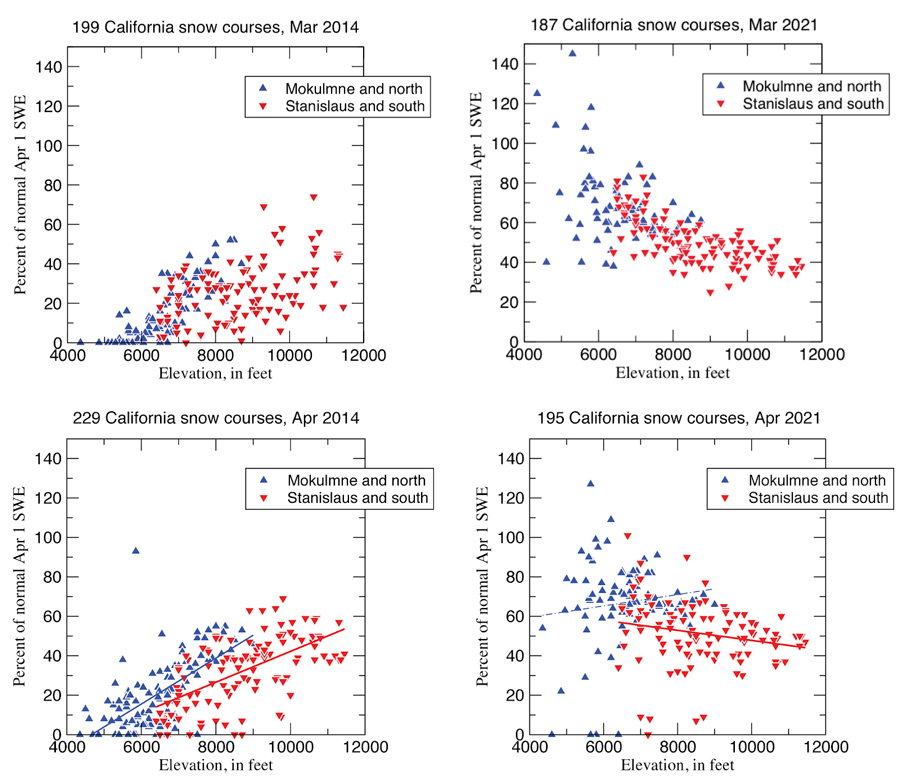
- On April 1, the California Department of Water Resources reported statewide snowpack at 59% of average for the date. Comparing 2021 to 2014, year-to-date precipitation totals have been similar. However, the snowpack is much different across elevations. This year’s snowpack was much heavier at the lower elevations due to the colder storms that have impacted the state.
- The low-elevation snowpack has contributed to the rapid snow melt. Since April 1, statewide snow survey measurements show rapid snow melt with snowpack now 40% of average, and most flows remain below to extremely below normal. High soil moisture deficits are expected to reduce runoff efficiencies.
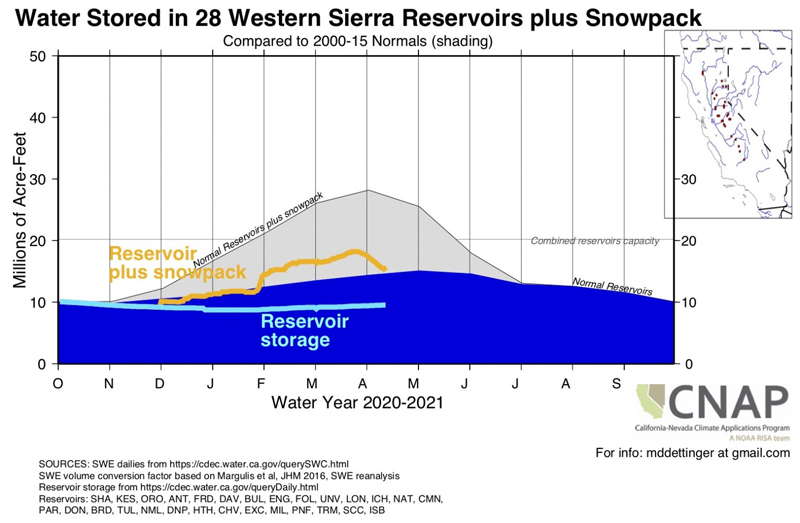
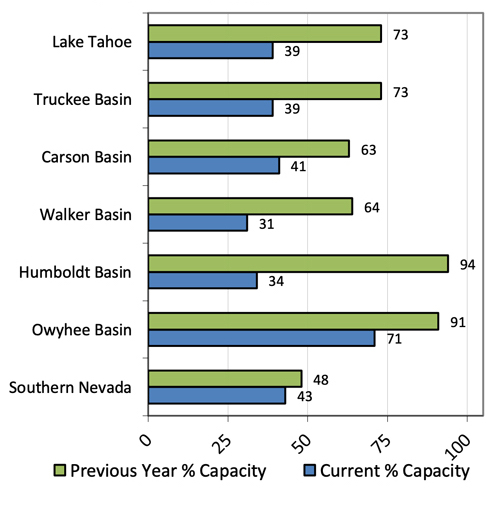
- Storage in the largest northern California reservoirs is well below average and in Nevada is lower than it was this time last year, reflecting cumulative impacts from a dry 2020. For more detail, visit the California and Nevada Natural Resources Conservation Service Water Supply Outlooks.
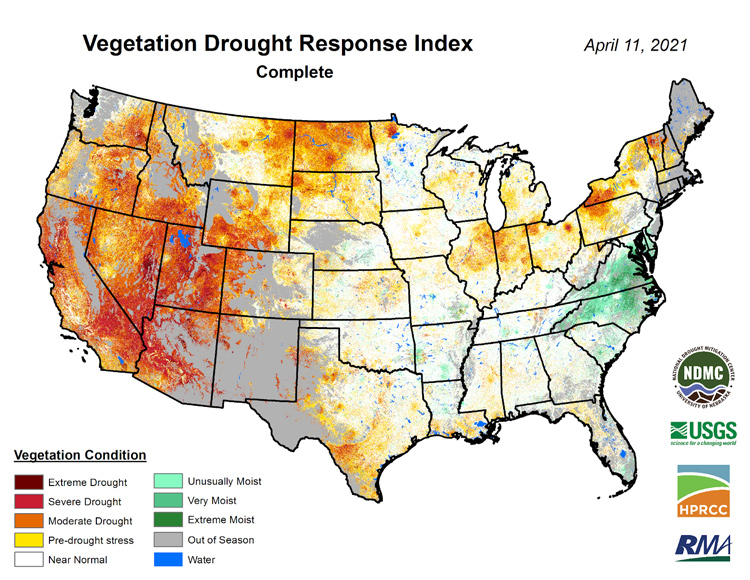
- Evaporative demand (the atmospheric thirst that drives evapotranspiration) remains high as it has been throughout this water year, and vegetation is showing stress.
- Across many areas of California, several indicators related to fire danger fuel dryness are currently at record or near record values. These reflect medium- to shorter-term weather and will change should cooler and wetter conditions occur over the next month or two. Otherwise, this is an early indication of potential significant fire this summer. Above-normal significant fire potential is expected in some mid to higher elevation areas in far southern Nevada by late May.
- Given current conditions, three NOAA National Weather Service Weather Forecast Offices in the region have released drought information statements. You can read them here.
How is drought affecting your neighborhood?
Click to see drought indicators, outlooks, and historical conditions by city, county, and state, and to sign up for U.S. Drought Monitor alert emails.
Percent of Normal Precipitation: Last 30 Days vs. Water Year to Date
Atmospheric River Landfalls
Odds of WY 2021 Reaching Water Year Normal Precipitation for the West
Snow Water Equivalent Percent of Median: April 12, 2021
California Snow Water Equivalent: March/April 2014 vs. March/April 2021
Water Storage in the Western Sierra Nevada
Nevada Reservoir Storage: Percent Capacity in 2020 vs. 2021
Vegetation Drought Response Index (VegDRI)
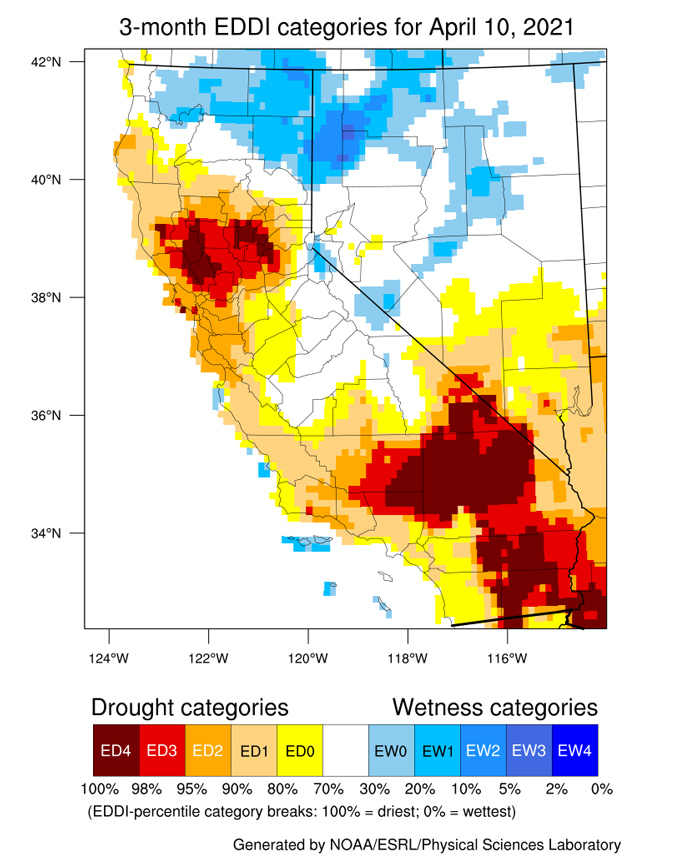
3-Month Evaporative Demand Drought Index (EDDI)
Drought Impacts
- Current conditions continue to intensify and expand drought impacts. As the region heads into summer, agriculture, water supplies, recreation, and ecosystems are likely to be impacted.
- Condition Monitoring Observer Reports (CMOR) over the past month highlights poor pasture forage, animal stress, dry stock ponds, water hauling, winds pulling moisture from soils, irrigated orchards, and culling and selling cattle.
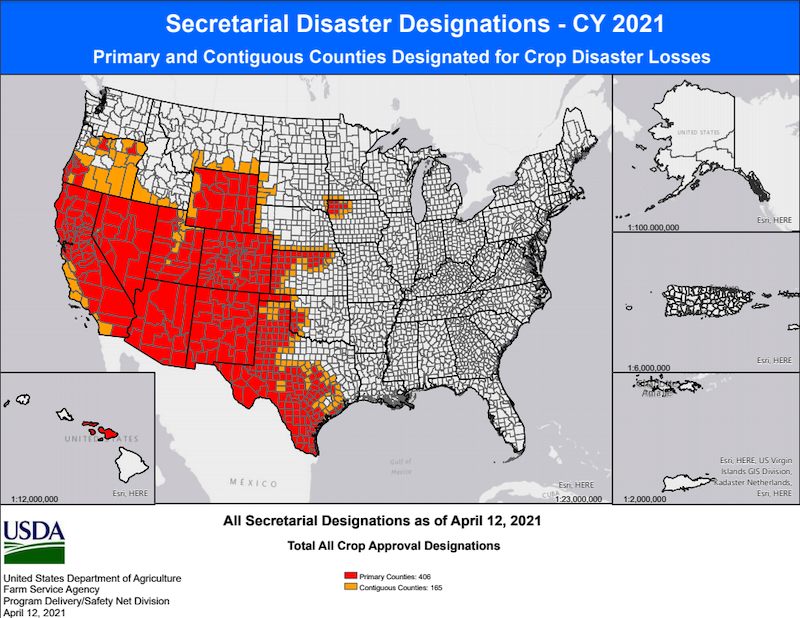
- On March 5, the U.S. Secretary of Agriculture designated 50 California counties and 16 Nevada counties as primary natural disaster areas based on the U.S. Drought Monitor.
U.S. Secretary of Agriculture Disaster Designations
- On March 23, the California State Water Project reduced allocations to 5% of requested supplies and released a revised Drought Contingency Plan as the U.S. Bureau of Reclamation Central Valley Project reduced south-of-Delta allocations.
- On March 22, the California State Water Resource Control Board mailed early warning notices to approximately 40,000 water right holders, urging them to plan for potential shortages by reducing water use and adopting practical conservation measures.
- On April 14, the U.S. Department of Agriculture (USDA) announced the availability of up to $10 million in assistance from USDA’s Wildfire and Hurricane Indemnity Program Plus to assist agriculture producers impacted by the worsening drought conditions in the Klamath River Basin. The U.S. Bureau of Reclamation also released a Temporary Operations Plan and assistance.
- Multiple media outlets are reporting that local water agencies and irrigation districts are considering voluntary or early stage drought actions. On the other hand, the Metropolitan Water District issued a statement that southern California is prepared for drought but is exploring purchasing supplies on the water market.
- Farmers have been encouraged to start planning now for potential water supply shortages later this year and to identify practical actions such as increasing water conservation measures, reducing irrigated acreage, managing herd size, using innovative irrigation and monitoring technologies, or diversifying water supply portfolios. California vineyards are also preparing for continued dry conditions.
- In preparation for this upcoming wildfire season, California will hire ~1,400 additional firefighters, and Gov. Newsom has signed a $526 million wildfire prevention plan.
- Drought contributed to recent Point Reyes Elk death, and other wildlife impacts are expected such as on waterfowl.
Drought and Climate Outlook
ENSO
NOAA’s ENSO alert system status is currently a La Niña advisory, with a transition from La Niña to ENSO-neutral likely in the next month or so, with an 80% chance of ENSO-neutral during May–July 2021. For more information, please check out the NOAA ENSO blog, including a look back at the 2020–2021 winter outlook performance.
Seasonal Drought, Temperature, and Precipitation Outlooks
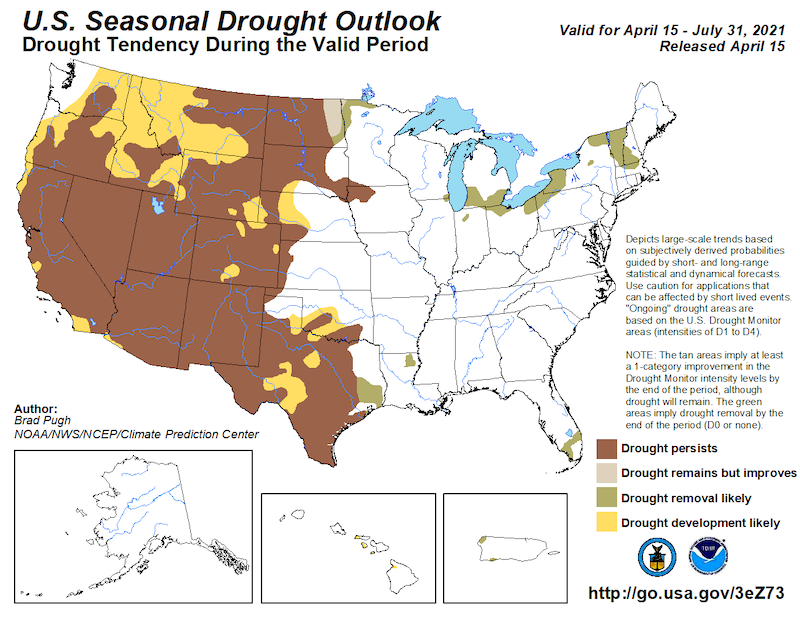
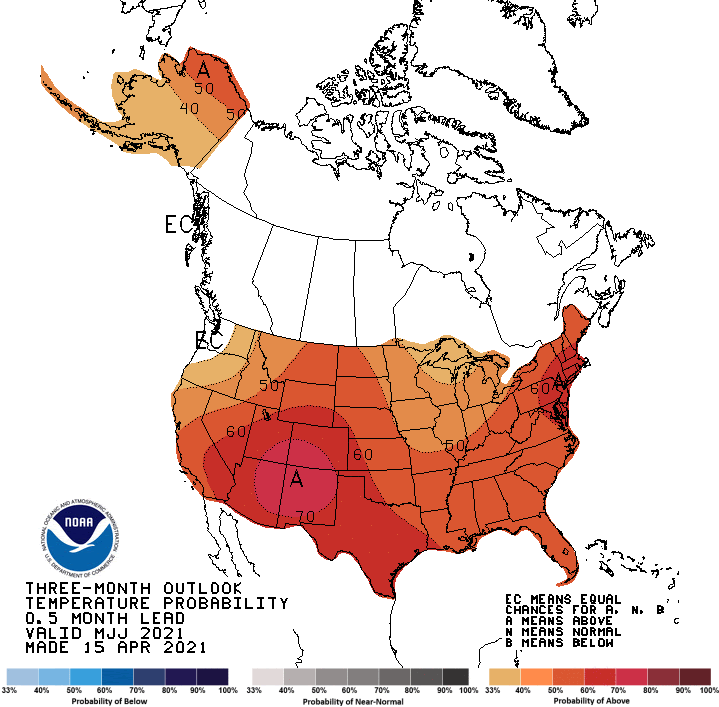
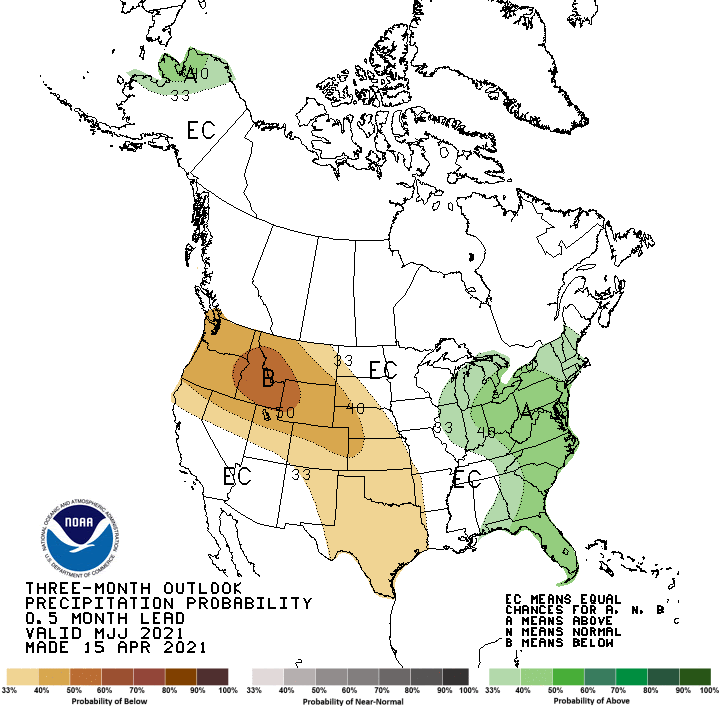
With the close of the primary wet season in California-Nevada, drought is expected to persist or worsen if evaporative demand is high throughout spring and summer. The National Weather Service Climate Prediction Center forecasts through July have increased odds of above-normal temperatures with the highest odds centered on the 4 corners areas. Most of the region has equal chances of above/normal/below precipitation, including those areas impacted by the summer monsoon. S
Seasonal Drought Outlook
Three-Month Temperature and Precipitation Outlooks
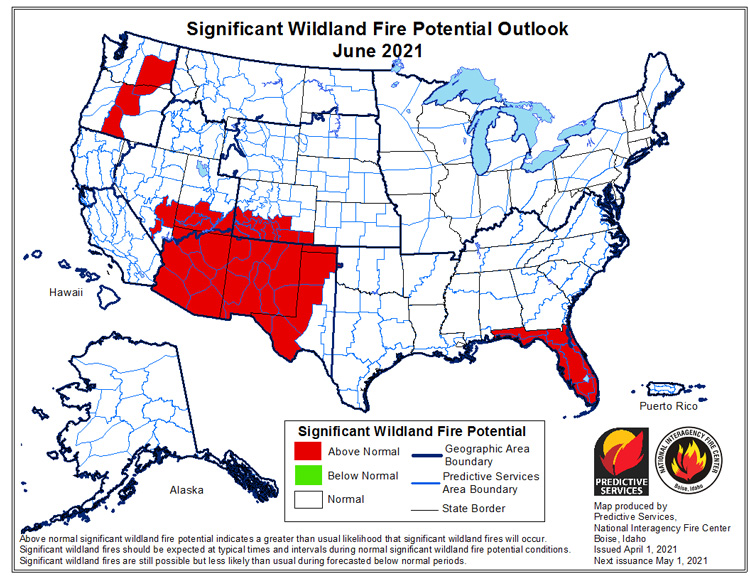
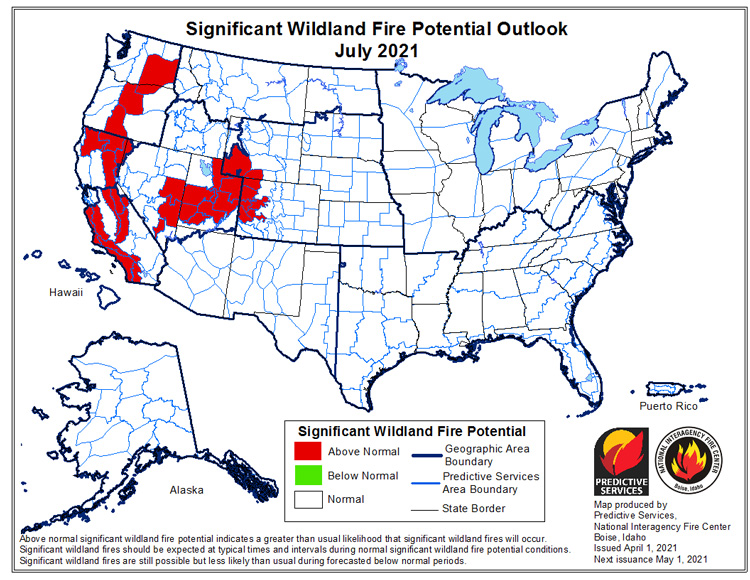
National Significant Wildland Fire Potential Outlook
Much of the West observed below average precipitation and cooler than normal temperatures in March. According to the National Interagency Fire Center’s Predictive Services, southern Nevada may see their fire season start in late May into June. The start of California’s fire season will depend on any extended dry spells combined with low humidity and windy weather. Upper elevations of California will be particularly vulnerable earlier than usual, as the state moves into July and the snowpack potentially melts off earlier than normal. Parts of California’s coast, from central to southern California, will also be at early fire potential due to fuels being abnormally dry.
Drought Early Warning Resources
California Nevada California-Nevada DEWS
Prepared By
Amanda Sheffield
NOAA/NIDIS California-Nevada DEWS Regional Drought Information Coordinator
Email: amanda.sheffield@noaa.gov
Julie Kalansky
Program Manager, California-Nevada Applications Program (NOAA RISA team)
Email: jkalansky@ucsd.edu
This drought status update is issued in partnership between the National Oceanic and Atmospheric Administration (NOAA), the California-Nevada Applications Program, a NOAA RISA team, and the Western Regional Climate Center at the Desert Research Institute to communicate the current state of drought conditions in California-Nevada based on recent conditions and the upcoming forecast. NIDIS and its partners will issue future drought updates as conditions evolve.
The next California-Nevada Drought & Climate Outlook webinar will be a special joint California and Southwest Drought Update and Wildfire Outlook Webinar. Register here to join us on Monday, May 24 at 11 a.m. PT.
